


Introduction
Sir Ernest Shackleton's ship Endurance was trapped in the drifting sea ice of the Weddell Sea, Antarctica, for over 10 months before finally sinking on 21 November 1915 (Fig. 1). Prior to being beset in the ice, the ship had intended to land Shackleton and his 27 man party on the East Antarctic coast to attempt the first crossing of the continent on what was known as the ‘Imperial Trans-Antarctic Expedition’ (Shackleton Reference Shackleton1919). After the sinking of Endurance, there followed a prolonged encampment on the drifting sea ice, a journey in three small open boats to Elephant Island, where the main group of 22 men remained, and then an epic 1300 km voyage across the Southern Ocean to South Georgia by Shackleton and five companions in the 6.6 m-long James Caird to raise the alarm and organize a rescue (Fig. 1) (Shackleton Reference Shackleton1919, Worsley Reference Worsley1931).
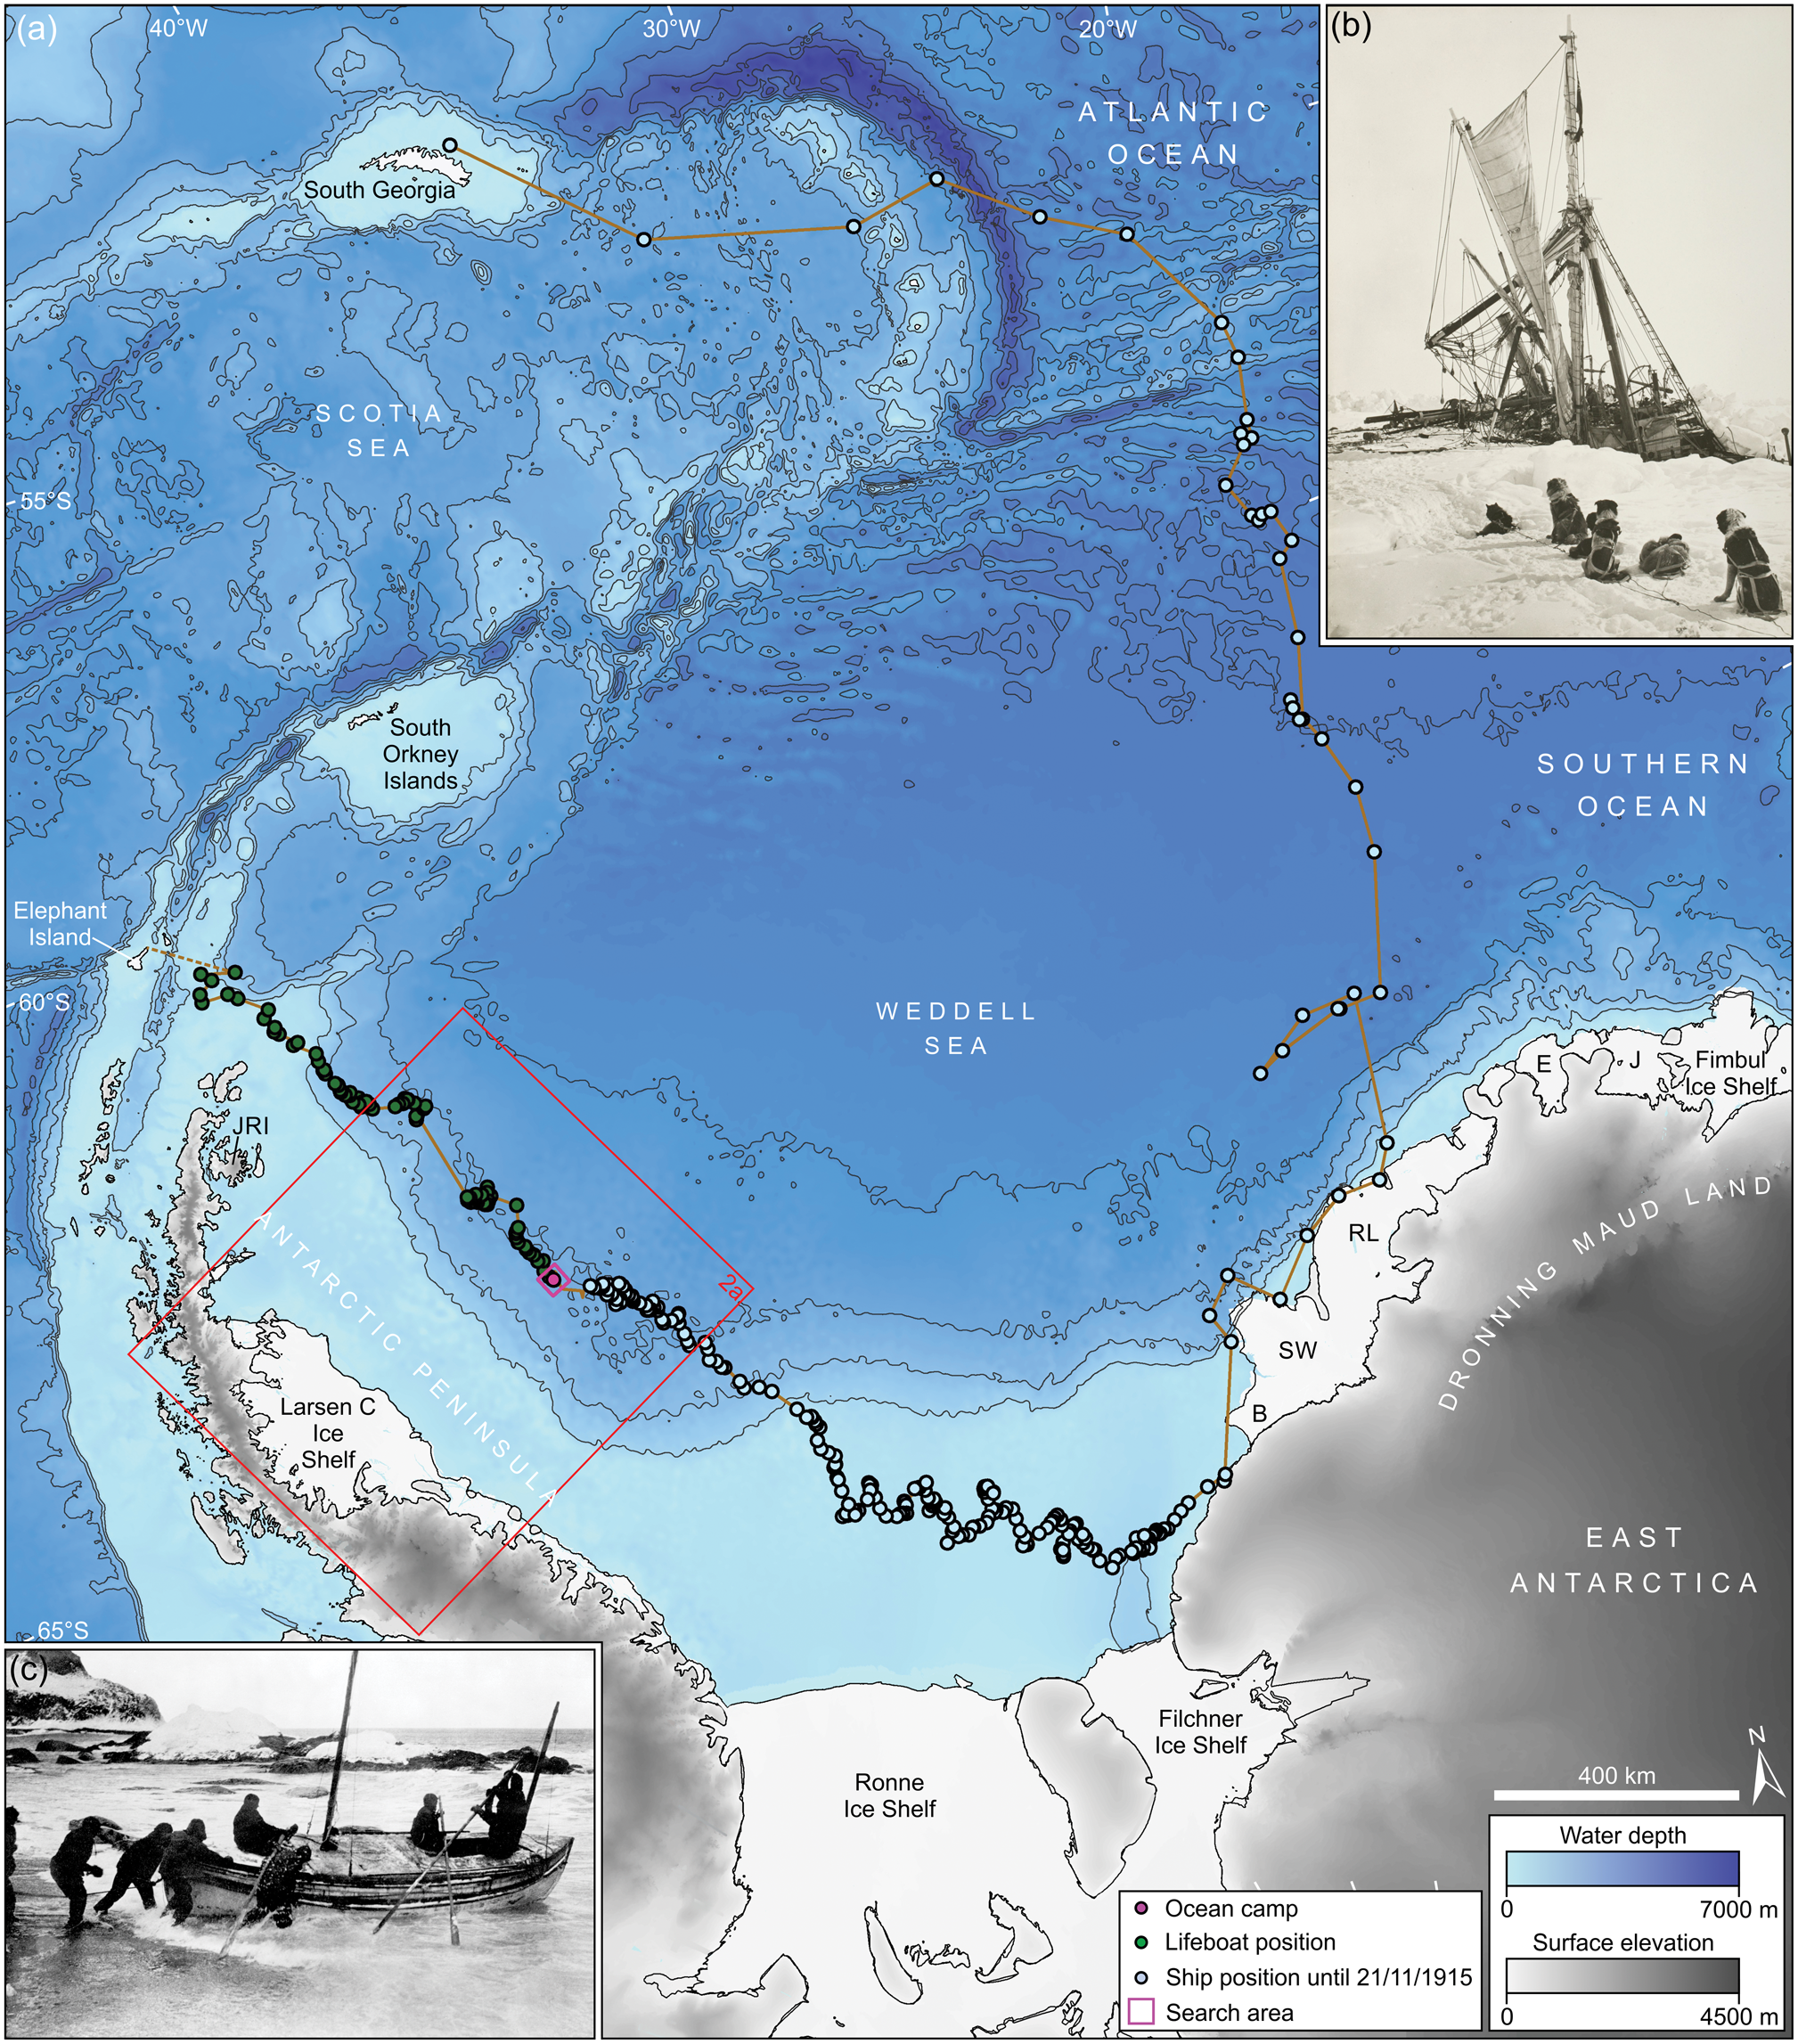
Fig. 1. a. Map showing the route taken by Endurance/‘Ocean Camp’ and James Caird lifeboat, as compiled by Reginald James using Frank Worsley's navigation measurements. Water depths are from ETOPO1 1 arc-minute global relief of the Earth's surface (http://www.ngdc.noaa.gov/mgg/global). Contours are every 500 m. Height of the Antarctic Ice Sheet is from the Reference Elevation Model of Antarctica (REMA) Digital Elevation Model (DEM) (Howat et al. Reference Howat, Porter, Smith, Noh and Morin2019). B = Brunt Ice Shelf, E = Ekström Ice Shelf, J = Jelbart Ice Shelf, RL = Riiser-Larsen Ice Shelf, SW = Stancomb-Wills Ice Shelf. b. Photograph showing Endurance beset in sea ice just before her sinking (© Scott Polar Research Institute). c. Photograph showing James Caird setting out from Elephant Island towards South Georgia on 24 April 1916 (© Scott Polar Research Institute).
The site at which Shackleton's Endurance sank is in ~3000 m of water on the lower continental slope ~300 km east of Larsen C Ice Shelf, the terminus of which forms the longest coastal ice cliffs on the eastern side of the Antarctic Peninsula (Fig. 1). The location is relatively well-known, although some uncertainties remain. Bergman & Stuart (Reference Bergman and Stuart2018) reanalysed the original theodolite- and sextant-derived astronomical observations made at the time the ship sank by Captain Frank Worsley of the Endurance. Worsley's astronomical observations, now held in an historic archive at the Canterbury Museum, Christchurch, New Zealand, suggest that the ship sank at 68°39′30″S, 52°26′30″W. These observations have been reanalysed subsequently to produce a small ‘search box’ within which the vessel is likely to lie on the sea floor (Bergman & Stuart Reference Bergman and Stuart2018).
The main aim of this paper is to consider the nature of the sea floor in the vicinity of the wreck site, together with the geological processes operating today on the continental margin (slope and shelf) upslope of the wreck site, westwards towards the Antarctic Peninsula. These processes include the possible action of erosion and deposition that might impede finding the wreck. Despite the fact that the western Weddell Sea is an area of almost complete sea-ice cover in most years, even during the summer, limited marine-geophysical data in the form of multi-beam echo-sounding and shallow sub-bottom profiling have been acquired from ice-breaking research vessels. These data are used to investigate the morphology and geological processes on the shelf and slope adjacent to the wreck site. In addition, we characterize the sea-ice cover typically found in the western Weddell Sea, which makes access to the wreck site difficult in most years and almost impossible in some, even for vessels with significant ice-breaking capability.
Methods
The multi-beam swath-bathymetric observations and shallow sub-bottom profiler data used in this paper were collected by the Alfred Wegener Institute's (AWI) ice-breaking Research Vessel (RV) Polarstern on several scientific cruises in the Weddell Sea between 1993 and 2011: ANT X/7 (1993; Bathmann et al. Reference Bathmann, Smetacek, de Baar, Fahrbach and Krause1994; https://doi.pangaea.de/10.1594/PANGAEA.763386), ANT XIV/3 3 (1997; Jokat & Oerter Reference Jokat and Oerter1998, https://doi.org/10.1594/PANGAEA.763232), ANT XIX/2 (2001–02; Jokat & Krause Reference Jokat and Krause2003, https://doi.org/10.1594/PANGAEA.701695), ANT XXII/2 (2004–05; Beyer et al. Reference Beyer, Koltsova, Dieckmann, Haas and Schröder2007, El Naggar et al. Reference El Naggar, Dieckmann, Haas, Schröder and Spindler2007, https://doi.org/10.1594/PANGAEA.724659), ANT XXIII/8 (2006–07; Gutt Reference Gutt2008, https://doi.org/10.1594/PANGAEA.668088) and ANT XXVII/3 (2011; https://doi.pangaea.de/10.1594/PANGAEA.766940), available at doi.org/10.1594/PANGAEA. Severe sea-ice conditions made navigation difficult and sometimes reduced data quality. The frequent changes of course on the ship tracks close to the Endurance wreck site are examples of the ship navigating through heavy sea ice (Figs 2a, 3 & 4a), a situation that would have been all too familiar to Sir Ernest Shackleton and his party almost 100 years earlier (Figs 1b & 2a).
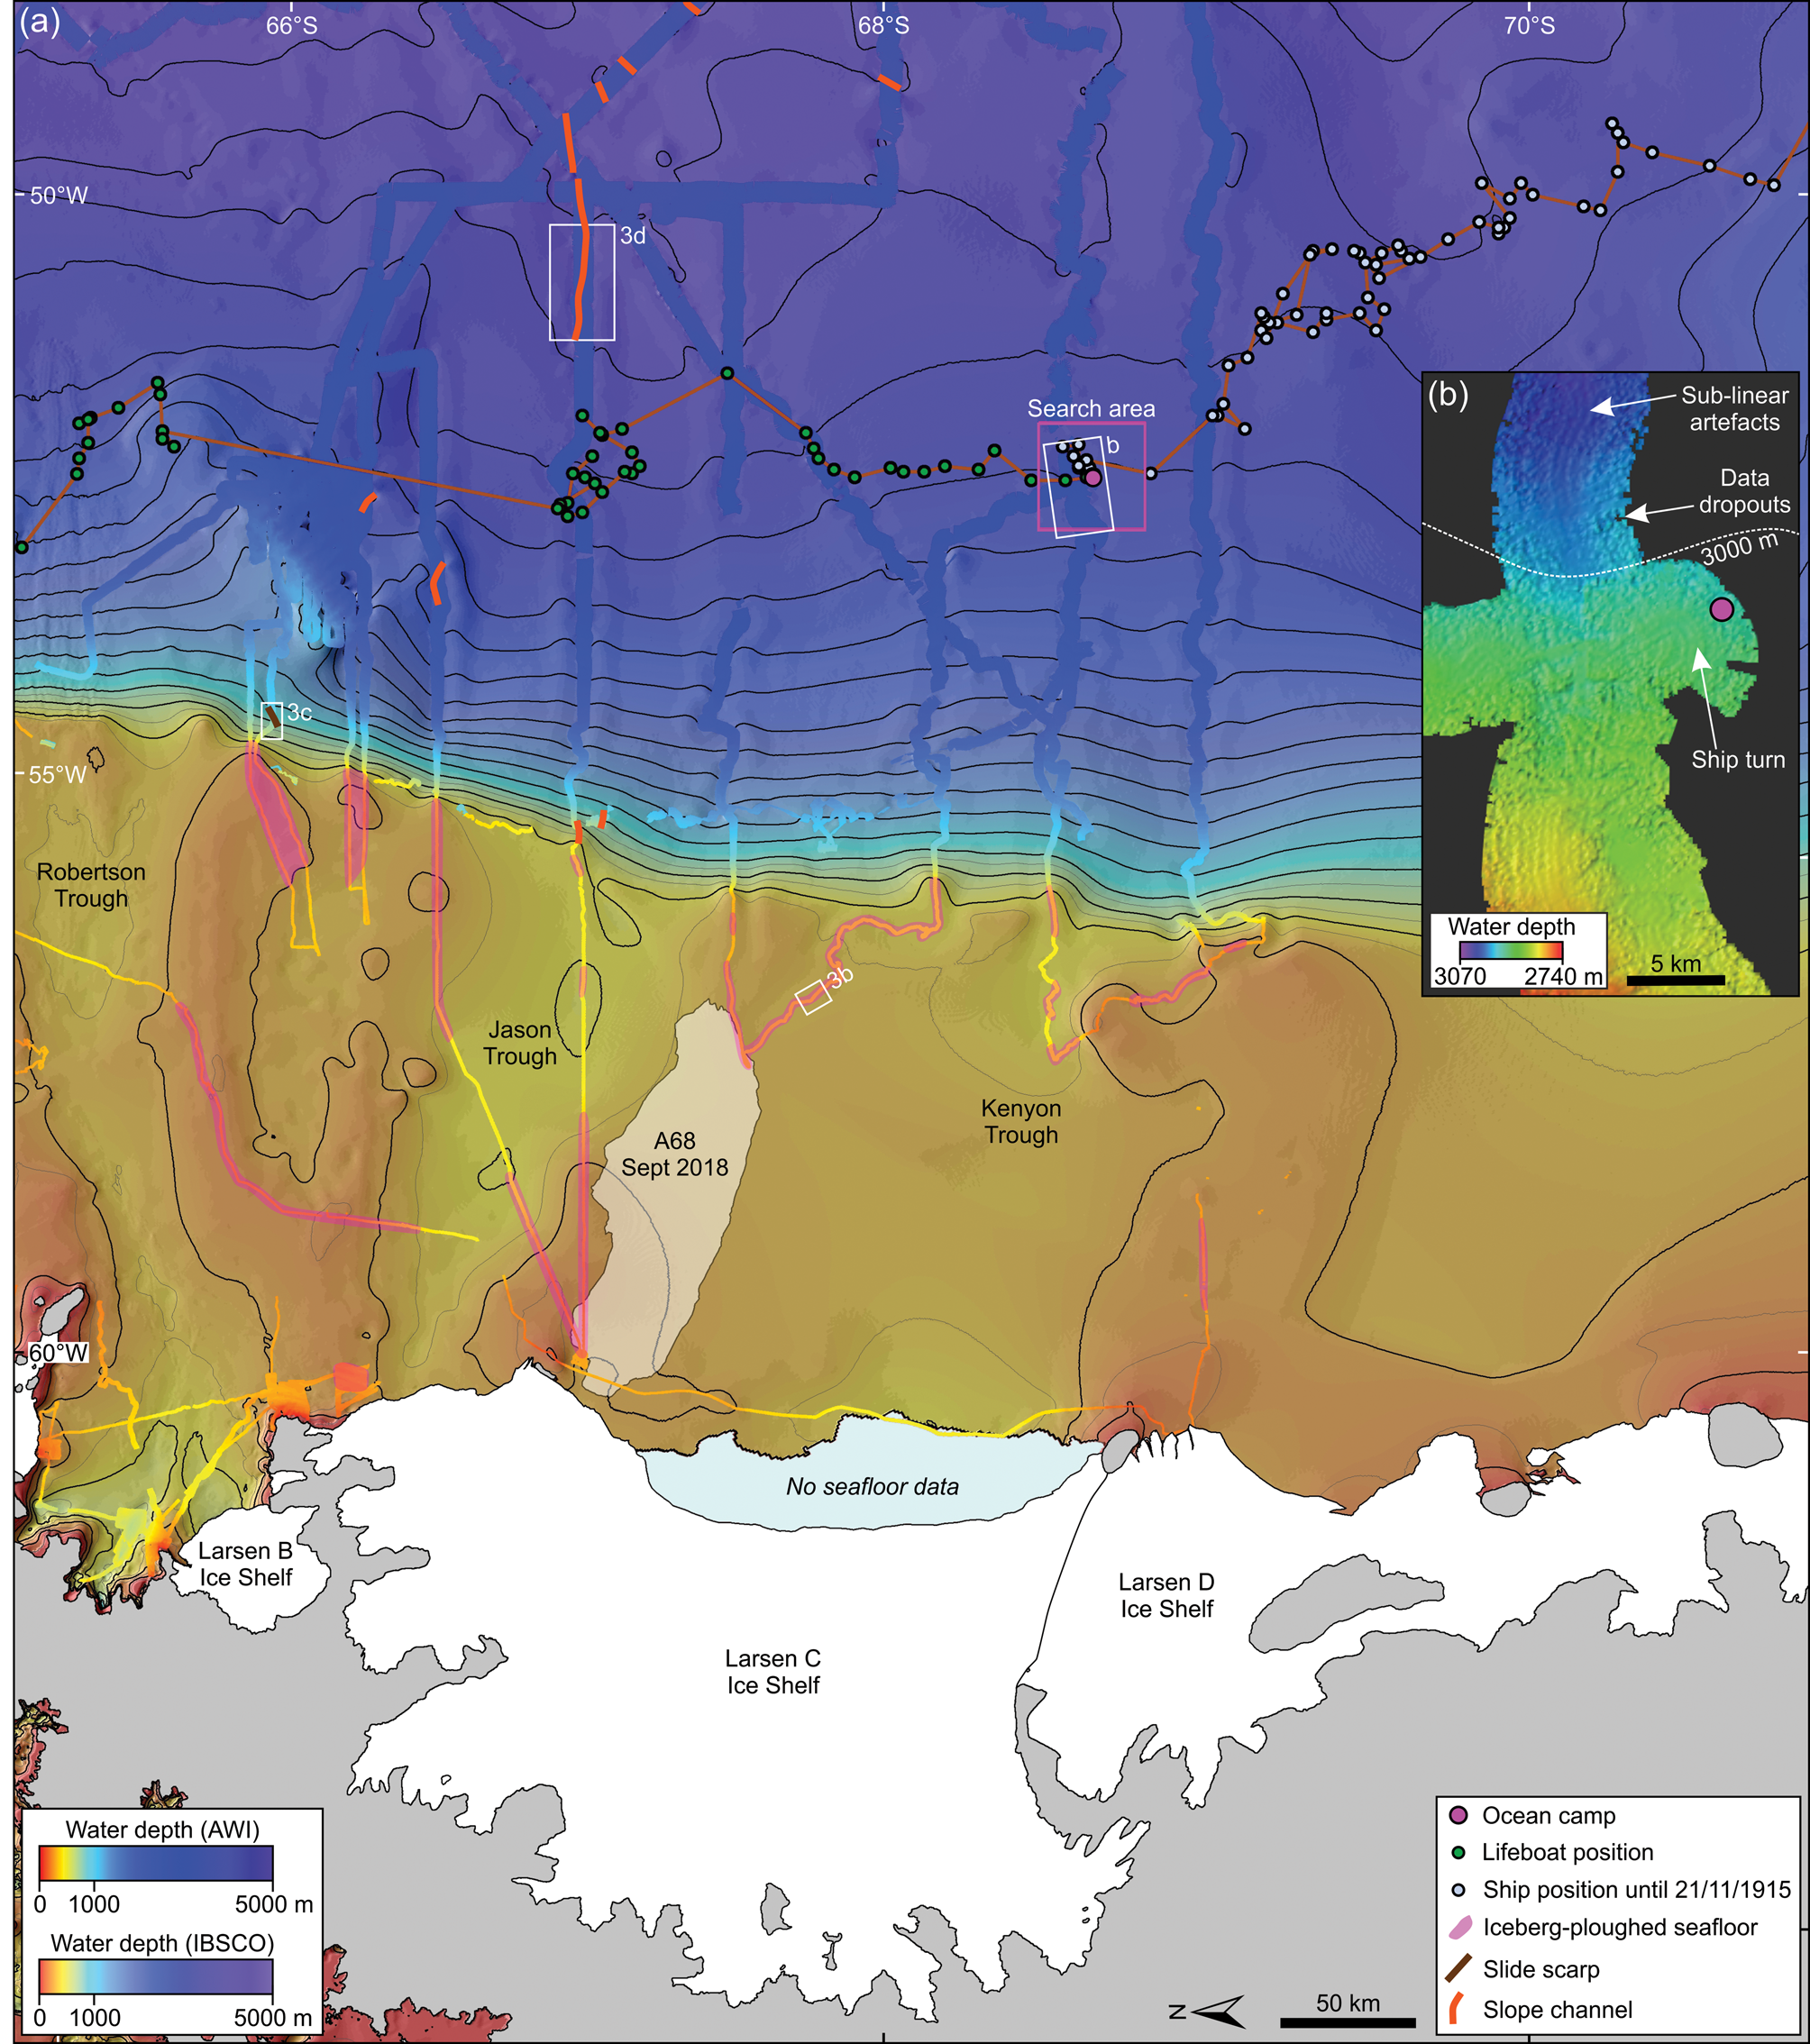
Fig. 2. a. Bathymetric map of the western Weddell Sea showing data collected by the Alfred Wegener Institute (AWI) on board the Research Vessel (RV) Polarstern. Pink box shows the search area for the wreck of the Endurance defined for the Weddell Sea Expedition 2019, which spans 20 nautical miles around the location of Ocean Camp. The distribution of sea-floor disturbances (iceberg ploughmarks, slide scarps and slope channels), mapped from the AWI dataset, is shown. Background shows the International Bathymetric Chart of the Southern Ocean (IBCSO) bathymetry (Arndt et al. Reference Arndt, Schenke, Jakobsson, Nitschem, Buys and Goleby2013) at 500 m resolution with 200 m contours (dark grey) and 100 m contours (light grey) in regions of the sea floor shallower than 1000 m. Grey shading denotes terrestrially grounded ice and white denotes the spatial extent of the western Weddell Sea's ice shelves. The location of iceberg A-68 prior to its calving from Larsen C Ice Shelf is also shown (blue shading), in addition to its observed location in September 2018 (translucent white shading). b. Detail of the sea floor close to the location of Ocean Camp (2970 m water depth). Grid-cell size 100 m.

Fig. 3. Examples of sea-floor disturbances on the shelf and slope of the western Weddell Sea. a. Frequency distribution of the depth of iceberg ploughmarks in the study area. The deepest draft of modern icebergs is from Dowdeswell & Bamber (Reference Dowdeswell and Bamber2007). b. Detail of iceberg ploughmark at ~470 m water depth. Inset is a profile across the iceberg ploughmarks at ~470 m water depth. c. & d. Details of a slide scar and channel on the continental slope. Locations are shown in Fig. 2a.

Fig. 4. Acoustic facies in the western Weddell Sea, derived from Alfred Wegener Institute PARASOUND sub-bottom profiler data. a. Map showing the distribution of the five main acoustic facies. Pink box shows the Weddell Sea Expedition 2019 search area for the wreck of Endurance, which spans 20 nautical miles around the location of Ocean Camp (pink circle). b.–e. Examples of Facies A–D, respectively. TWT = two-way travel time.
The multi-beam equipment used for bathymetric data acquisition from RV Polarstern was hull-mounted 2° × 2° Hydrosweep DS1 (1 August 1989–1 October 1997), DS2 (10 October 1997–10 October 2010) or DS3 (since 20 October 2010) multi-beam systems manufactured by Atlas Hydrographic. The systems operated in a range of frequencies of 13–17 kHz with 59 beams (DS1, DS2) and 141 beams (DS3) and a beam aperture of up to 120°. The raw data were processed using CARIS HIPS and SIPS ® and QPS Fledermaus ® software and gridded at a cell size of 100 m.
Sub-bottom profiler data were acquired using a hull-mounted Atlas PS70 PARASOUND system, manufactured by Atlas Hydrographic, applying a mean water sound velocity of 1500 m s-1. Heavy sea ice caused noisy returns with missing traces on some occasions. The system uses the parametric effect and sends out energy at two primary frequencies (normally 18 and 22 kHz) that produce a secondary pulse at a lower frequency (usually 4 kHz). Vertical resolution is 30 cm or better. Penetration depth of the sub-bottom profiler can reach several tens of metres in fine-grained and well-sorted sediments, but is reduced considerably in diamictic material. In this paper, the PARASOUND data were classified visually into four acoustic facies (e.g. Damuth Reference Damuth1978, Dowdeswell et al. Reference Dowdeswell, Evans and Ó Cofaigh2010): Facies A, acoustically impenetrable sea floor; Facies B, highly irregular sea floor; Facies C, lenses; and Facies D, acoustically stratified (Fig. 4).
Satellite data concerning sea-ice cover over the Weddell Sea were derived from a combination of daily NASA Worldview multispectral (visible, near-infrared and short-wave infrared; 256 m resolution) and thermal band (1024 m resolution) mosaics of Moderate Resolution Imaging Spectroradiometer (MODIS) imagery from the Terra (EOS AM-1) and Aqua (EOS PM-1) satellites and Visible Infrared Imaging Radiometer Suite (VIIRS) imagery from the Suomi NPP satellite. These datasets were employed due to their higher spatial resolution relative to conventional passive microwave-based observations (e.g. Zwally & Gloersen Reference Zwally and Gloersen1977, Comiso et al. Reference Comiso, Parkinson, Gersten and Stock2008, Vernet et al. Reference Vernet, Geibert, Hoppema, Brown, Haas and Hellmer2019), allowing for more detailed depiction of the sea-ice cover. Data were acquired free of charge in GeoTIFF format from the Global Imagery Browse Services (GIBS; https://earthdata.nasa.gov/gibs) web facility, which underpins the NASA EOSDIS Worldview data portal (https://worldview.earthdata.nasa.gov). These datasets were then processed to form daily composites of (as far as possible) cloud-free image coverage in order to classify sea-ice and open-water occurrence and to estimate the ice concentration in ‘sea ice'-classified pixels (with reference to image-specific statistics from ‘water’ and ‘sea ice’ initial classifications). From these daily concentration maps, we then summarized the average summertime sea-ice cover (December, January, February) of the western Weddell Sea, including the Endurance wreck site, for the period covered by the source imagery, from 2002 to present.
The location where Endurance sank clearly defines the downslope end of our study area. There are, however, some relatively small uncertainties in this position due to factors including: the fact that Captain Worsley made no astronomical observations between 3 days before and nearly 16 h after the sinking; the drift of the chronometer used (primarily affecting longitude); the exact distance and bearing between ‘Ocean Camp’ and the Endurance; and the speed and bearing of sea-ice drift assumed for dead reckoning of position. Bergman & Stuart (Reference Bergman and Stuart2018) suggested a latitudinal limit of 4.5 nautical miles to bound the sinking location, and we interpret their findings regarding longitude accuracy to yield an ~13 nautical mile range in the east–west axis. Further uncertainty is added by lack of knowledge of exact offsets between positions recorded in 1915 and the modern-day WGS84 datum (albeit likely to be within ~400 m) and of any horizontal displacement between the point of sinking and the wreck's sea-floor location. In the latter case, the drag caused by remaining vessel masts and yards suggests that the vessel's path to the sea floor would not have differed greatly from the vertical.
Marine-geophysical observations of the sea floor
At present, only a limited amount of multi-beam swath-bathymetric data are available for the ~400 000 km2 area illustrated in Fig. 2a. The area comprises the slope-shelf system present eastwards of the ice cliffs of Larsen C Ice Shelf, extending across the almost 200 km-wide continental shelf and descending to over 3500 m deep beyond the wreck site of Endurance. The multi-beam data coverage of the study area is shown in Fig. 2a, and the accompanying regional bathymetry is from the International Bathymetric Chart of the Southern Ocean (IBCSO) (Arndt et al. Reference Arndt, Schenke, Jakobsson, Nitschem, Buys and Goleby2013). The IBCSO data are gridded at a cell size of 500 m and are interpolated between actual observations of water depth, which, in the study area, are composed almost exclusively of the multi-beam echo-sounder data collected by RV Polarstern and shown here in detail.
Continental shelf offshore of Larsen C
Evidence from multi-beam echo-sounding shows that much of the sea floor offshore of Larsen C Ice Shelf is incised by irregular, linear to curvilinear depressions (Figs 2a & 3b). The depressions are present in water depths of between 280 and 620 m (Fig. 3a), and are up to 200 m wide and 10 m deep (Fig. 3a & b). These features are interpreted as iceberg ploughmarks that are formed by the grounding of iceberg keels in sea-floor sediments (e.g. Dowdeswell & Bamber Reference Dowdeswell and Bamber2007). The depths of most of the iceberg ploughmarks in the western Weddell Sea are significantly greater than the deepest draft of modern Larsen C-derived icebergs (Fig. 3a) (Dowdeswell & Bamber Reference Dowdeswell and Bamber2007), suggesting that most of the ploughmarks were produced during the last deglaciation. There are no dated cores on the continental shelf offshore of Larsen C Ice Shelf; however, cores from the mouth of Prince Gustav Channel near the north-eastern tip of the Antarctic Peninsula suggest that deglaciation probably took place between ~13.6 and 10.7 kyr bp (Evans et al. Reference Evans, Pudsey, Ó Cofaigh, Morris and Domack2005, Pudsey et al. Reference Pudsey, Murray, Appleby and Evans2006, Ó Cofaigh et al. Reference Ó Cofaigh, Davies, Livingstone, Smith, Johnson and Hocking2014). Thus, the continental shelf beyond Larsen C Ice Shelf is likely to have been free of ice for at least the last 10 000 years.
The shallow acoustic stratigraphy of the continental shelf beyond Larsen C Ice Shelf is characterized mainly by Facies B, which comprises a 5–20 ms-thick (~5–20 m) semi-transparent unit underlying a highly irregular sea floor (Fig. 4a & c). This acoustic facies corresponds with the distribution of iceberg ploughmarks on the bathymetric data (Figs 2a & 4a) and is interpreted as sediment that has been reworked by the keels of grounding icebergs (also referred to in the literature as ‘iceberg turbate') (e.g. Pudsey et al. Reference Pudsey, Evans, Domack, Morris and del Valle2001, Hillenbrand et al. Reference Hillenbrand, Baesler and Grobe2005, Campo et al. Reference Campo, Wellner, Domack, Lavoie and Yoo2017).
Continental slope of the western Weddell Sea
Most of the continental slope of the western Weddell Sea is relatively featureless at the 100 m grid-cell size of our bathymetric data (e.g. Fig. 2b). However, there is some evidence for slope disturbances in the form of abrupt changes in slope gradient and submarine channels (Fig. 3c & d), particularly beyond Robertson and Jason troughs to the north of the study area (Fig. 2a). A slide scar, with a headwall up to 60 m high and a sea-floor gradient of ~20°, is present on the upper slope beyond the southern edge of Robertson Trough (Figs 2a & 3c). At ~50 km further downslope of the slide scar, IBCSO bathymetry data suggest that a series of gullies extends between ~1200 and 3000 m water depth (Fig. 2a). These features imply that this area has been affected by slope failures.
Several low-sinuosity submarine channels, up to 1 km wide and 50 m deep, are present on the middle to lower continental slope (Figs 2a & 3d). Individual channels can be traced for up to 100 km, although they most probably extend for significant lengths beyond the limit of our bathymetric data (Fig. 2a). The channels were probably formed by turbidity currents that were triggered by the delivery of turbid meltwater from ice sheets, dense-water formation through brine rejection during sea-ice formation, debris flows and/or other mass movements (e.g. Dowdeswell et al. Reference Dowdeswell, Ó Cofaigh, Noormets, Larter, Hillenbrand and Benetti2008).
In terms of the distribution of acoustic facies, the continental slope can be divided into three broad areas (Fig. 4a). Facies A (Fig. 4b) is generally present on the upper slope, where the lack of acoustic penetration suggests that the sea-floor contains relatively hard sediment that is probably diamictic (e.g. Anderson Reference Anderson1999). Facies C, which comprises stacked, acoustically transparent lenses up to 30 ms (30 m) thick, is present on the mid-slope between 1000 and 3400 m water depth (Figs 4a & d & 5). The geometry and dimensions of the lenses suggest that they are glacigenic debris flows that were produced by the remobilization of deformable diamictic sediments that were delivered to the shelf break and upper slope by the Antarctic Peninsula Ice Sheet during full-glacial conditions c. 20 000 years ago (King et al. Reference King, Haflidason, Sejrup and Løvlie1998, Hillenbrand et al. Reference Hillenbrand, Baesler and Grobe2005). The lenses are draped by an acoustically stratified unit that is up to 10 ms (10 m) thick (Figs 4d & 5b & c), which was probably formed by the deposition of hemipelagic debris in a relatively low-energy environment.

Fig. 5. a. Long profile of the continental slope close to the location of the Endurance wreck site, derived from Alfred Wegener Institute sub-bottom profiler PARASOUND and bathymetric data. Profile is located in Fig. 3a. b. & c. Details of the acoustic character of the lower slope. Data gaps are often produced by sea-ice interference with the sonar system.
In water depths > ~2400 m, the lower continental slope is characterized by Facies D, which has a stratified acoustic character and an acoustic penetration depth of up to 50 ms (50 m) (Fig. 4a & e). This is again probably linked to the slow rain-out of hemipelagic debris. The lower slope therefore probably contains relatively fine-grained and well-sorted sediment that was deposited in a low-energy, ice sheet-distal environment.
Wreck site
In the area of the Endurance wreck, the sea floor appears almost flat in the swath-bathymetric data (Fig. 2b), with a slope angle of no more than 0.3° (Fig. 5) and a water depth of ~3000 m. In contrast to other regions of the continental margin, no sea-floor disturbances, including iceberg ploughmarks, sediment slides, channels or gullies (e.g. Fig. 3), are apparent in the vicinity of the wreck site (Fig. 2). The multi-beam data on the sea floor collected by RV Polarstern, which cover part of the wreck-site search box (Fig. 2a), do not appear to show any evidence of the 44 m-long and 7.6 m-wide wreck (Fig. 2b), although the 100 m grid-cell size of the data should be remembered, as well as the ‘noisiness’ of the data due to navigation through sea ice. Most of the structure apparent in the bathymetric dataset is probably artefactual and includes the effects of the ship turning close to Worsley's reckoning of the location of the expedition's ‘Ocean Camp’ (Fig. 2b). There are also multi-beam signal dropouts near the edges of the mosaic and several subtle sublinear features; the latter are again artefacts probably related to the switching of multi-beam bottom-detection algorithms between the use of phase and amplitude data collected relatively close to the nadir point beneath the vessel (Jakobsson et al. Reference Jakobsson, Gyllencreutz, Mayer, Dowdeswell, Canals and Todd2016).
Sub-bottom profiler data from the same area show acoustic penetration to ~20–30 ms (~20–30 m) below the sea floor (Fig. 5a & c). There is evidence of acoustic lamination together with the pinching out of a lens of debris in the downslope direction (Fig. 5c). The area of the search box therefore appears to contain some characteristics of acoustic Facies C and D (Fig. 4). Persistent acoustically laminated material would suggest slow deposition of hemipelagic debris in a low-energy environment, and this appears to characterize at least the uppermost 10 ms (10 m) of the record (Fig. 5c). Beneath this, there is evidence of the pinching out of a sediment lens, which implies downslope mass wasting, with the profile in Fig. 5c imaging the distal toe of such an event. However, given that the upper part of this lens is buried by ~10 m of sediment, it is probable that low-energy conditions have persisted for some time in the vicinity of the Endurance wreck and that slow sedimentation of hemipelagic debris has characterized sedimentation here over the past century. Indeed, typical deep-water sedimentation rates in dated sediment cores from similar deep-water settings in the Weddell Sea suggest rates of < 1 mm per year (Anderson & Andrews Reference Anderson and Andrews1999), implying that the uppermost 10 m of crudely laminated sediments in the sub-bottom profile closest to ‘Ocean Camp’ shown in Fig. 5c probably represent a multi-millennial period of low-energy conditions. This implies, in turn, that the wreck of Shackleton's Endurance is unlikely to have been disturbed by recent submarine mass-wasting events and that it is being buried only very slowly by modern sedimentation. With cut-down masts and yards trailing behind, drag would have been imposed on the sinking hull, probably reducing the seabed impact velocity of Endurance. We therefore assume that Endurance settled on the seabed keel-first, without significant penetration of sea-floor sediments.
Surface sea-ice conditions
Satellite observations
Sea ice persists through the summer in the Weddell Sea, especially on its western side, including in front of Larsen C Ice Shelf (Fig. 6a). The sea-ice extent generally reaches a minimum in February, with the sea-ice edge typically spanning from west of Brunt Ice Shelf in the eastern Weddell Sea to James Ross Island off the eastern Antarctic Peninsula (Fig. 1a). As sea ice does not generally re-enter the Weddell Gyre to the east, the age of most of the sea ice in the western Weddell Sea is probably < ~2 years (Kottmeier et al. Reference Kottmeier, King, Roth, Ackley, Andreas and Crane1997). Estimates of the mean thickness of unridged sea ice from satellite laser altimetry range between 0.4 and 2 m across this region (Kurtz & Markus Reference Kurtz and Markus2012), although maximum ice thicknesses may significantly exceed this value, for example due to pressure ridges (Tan et al. Reference Tan, Li, Lu, Haas and Nicolaus2012). Since the decommissioning of the ICESat GLAS laser altimeter in 2009, no routine sea-ice thickness products are available, prohibiting interannual comparisons of regional thicknesses and ridging across the Weddell Sea. The distribution and concentration of sea ice in the western Weddell Sea (Fig. 6a) clearly presents a significant challenge to any expedition that seeks to access the wreck site of the Endurance.

Fig. 6. a. Satellite image composite formed from Moderate Resolution Imaging Spectroradiometer and Visible Infrared Imaging Radiometer Suite imagery acquired between 29 January and 4 February 2019 (resolution ~250 m). Yellow shading denotes persistent cloud cover. Red box shows the search area for the wreck of the Endurance, following Fig. 2a. Dashed line is iceberg A-68. LC = Larsen C Ice Shelf. b.–d. Sea-ice average concentration summary images for February for the western Weddell Sea, showing three typical scenarios for accessing the search area for the wreck of the Endurance (white box): b. ‘Good’ (2002), c. ‘Intermediate’ (2019; the route of the SA Agulhas II during the Weddell Sea Expedition 2019 is shown in white) and d. ‘Bad’ (2014). Key in c. and d. is the same as in b. e. Plot showing the changing average December–January–February (DJF) sea-ice conditions in the western Weddell Sea between 2002 and 2019 (inclusive), as assessed using qualitative rankings.
Our maps of average December–January–February sea-ice concentrations in the western Weddell Sea between 2002 and 2019, produced from MODIS and VIIRS optical and thermal imagery, were assessed qualitatively by six independent scientists as ‘Good', ‘Intermediate’ or ‘Bad’ in terms of overall sea-ice navigability (Fig. 6e). Examples of ‘Good', ‘Intermediate’ and ‘Bad’ sea-ice conditions are shown in Fig. 6b–d, respectively. These qualitative rankings are based on 1) the proximity of the Endurance wreck site to open water, and 2) sea-ice concentration at the Endurance wreck site. We also took into account ancillary information, including reference sea-ice thickness (Worby et al. Reference Worby, Geiger, Paget, van Woert, Ackley and deLiberty2008, Kurtz & Markus Reference Kurtz and Markus2012), as well as knowledge of the actual conditions experienced in the area by the Weddell Sea Expedition in February 2019 vs our average concentration map for that month (ship-tracks shown in Fig. 6c). Note that we refer to individual summer periods below according to the year of the January and February of that season (e.g. December 2003 to February 2004 is referred to as ‘2004').
For the last 18 years, average December–January–February sea-ice conditions in the western Weddell Sea have been, in our assessment, generally ‘Intermediate’ or ‘Bad’ (Fig. 6e) for access to the Endurance wreck site. An exception was in 2002, when significant regions of low sea-ice concentration were present in the central western Weddell Sea (Fig. 6b), enabling the Alfred Wegener Institute's research ice-breaker RV Polarstern to navigate close to the estimated wreck location (Fig. 2). Since 2002, three (17%) of the years are categorized as showing ‘Intermediate’ sea-ice conditions, in which the wreck search area was generally < 200 km from open water and in 90–100% sea-ice concentration (Fig. 6c & e). However, 14 (78%) of the assessed years show ‘Bad’ sea-ice conditions, in which the wreck search area was generally > 200 km from open water and in 100% sea-ice concentration (Fig. 6d & e). In early February 2019, the South African research vessel SA Agulhas II navigated to the wreck search area as part of the Weddell Sea Expedition 2019 (Fig. 6c). Although an autonomous underwater vehicle (AUV) was successfully deployed within the wreck search area, SA Agulhas II lost contact with the AUV, and worsening sea-ice conditions meant that the search had to be abandoned with no AUV multi-beam data retrieved.
No clear trend of decreasing or increasing sea-ice concentration in the western Weddell Sea has been identified over the observational period, although sea-ice conditions in the last 10 years have been generally poor (Fig. 6e). Notable interannual differences in summertime sea-ice cover are observed; for example, interannual fluctuations between upper ‘Intermediate’ and ‘Bad’ sea-ice conditions occurred between the summers of 2009 and 2010 (Fig. 6e). For the past 18 years, the most favourable patterns of sea-ice concentration for wreck-site access have generally occurred in February (Fig. 6e). Notable exceptions are in the summers of 2007, 2009 and 2012, when we assessed the most favourable conditions to have occurred in January, and in the summer of 2011, when the easiest access was in December (2010). Assessments of sea-ice navigability in the western Weddell Sea are complicated by the highly changeable nature of the sea-ice conditions, whereby areas of open water, including near-shore leads, can open and close within a timescale of a few days. Our findings are consistent with contemporaneous but lower-resolution passive microwave-derived sea-ice concentration products (https://nsidc.org/data/NSIDC-0051/versions/1). In addition, examination of passive microwave data on Weddell Sea sea-ice conditions from 1978 to 2002 suggests just a few years that were similar to our observations from 2002; the summers of 1981, 1987, 1993 and 1999 were each relatively good years for navigation in the western Weddell Sea.
Major iceberg calving events can also affect sea-ice distribution and concentration, further complicating the predictability of ice conditions. As an example, the calving from Larsen C Ice Shelf in July 2017, and subsequent grounding of iceberg A-68 between June 2018 and early 2019 (Fig. 6a), may have impeded the northerly flow of sea ice in the western Weddell Sea, which typically drifts in a clockwise direction associated with the cyclonic Weddell Gyre (e.g. Deacon Reference Deacon1979, Muench & Gordon Reference Muench and Gordon1995). The barrier-like effect of icebergs such as A-68 is therefore presumably analogous to the protective effects of ice tongues on local sea-ice concentration across other parts of Antarctica (e.g. Miles et al. Reference Miles, Stokes and Jamieson2017).
The Weddell Sea Expedition 2019
In early February 2019, the South African research vessel SA Agulhas II navigated to the wreck search area as part of the Weddell Sea Expedition 2019. Transit to the wreck site was facilitated by a progressive opening in the eastern edge of the sea-ice margin, which extended to within 170 km of the wreck site (Figs 6c & 7a), a phenomenon not observed on MODIS imagery throughout most of its observational record. Approaching the wreck site from this direction, an associated loosening of the pack ice resulted in the presence of several large leads (Fig. 7a) that the vessel was able to exploit despite the still heavy (≥ ~90%) sea-ice concentration. Sea-ice thicknesses ranging from ~2 to 5 m (mean ~2.5 m) were observed during this approach to and within the search area. These values exceed the thickness data provided by earlier ship observations (Worby et al. Reference Worby, Geiger, Paget, van Woert, Ackley and deLiberty2008) and fall within the upper limits of estimates derived from satellite laser altimetry (Kurtz & Markus Reference Kurtz and Markus2012, Kern et al. Reference Kern, Ozsoy-Çiçek and Worby2016). These thickness values were also in good agreement with synoptic sea-ice thickness forecasts from the Copernicus Marine Environment Monitoring Service (CMEMS) Global Ocean 1/12° physics analysis and forecast model (http://resources.marine.copernicus.eu/documents/QUID/CMEMS-GLO-QUID-001-024.pdf). Within the wreck search area, occasional patches of rotten ice were also encountered, and these were composed of honeycombed multiyear ice probably conditioned by summertime surface melting events (Frantz et al. Reference Frantz, Light, Farley, Carpenter, Lieblappen and Courville2019).

Fig. 7. a. Same depiction as Fig. 6c, zoomed in over the central Weddell Sea. TerraSAR-X Stripmap and ScanSAR imagery used for navigation purposes on the approach to the Endurance wreck search area (red box) are shown superimposed on part of the Moderate Resolution Imaging Spectroradiometer/Visible Infrared Imaging Radiometer Suite composite image in Fig. 6c. The route of the SA Agulhas II during the Weddell Sea Expedition 2019 is shown in white. b. TerraSAR-X full-resolution Spotlight image showing the presence of large leads in the search area, with ship track in white. c. Detail showing typical sea-ice conditions encountered by the SA Agulhas II during the search for Endurance, with ship track in white (TerraSAR-X data © Deutsches Zentrum für Luft-und Raumfahrt/DLR).
The presence of open-water sea-ice leads, at times extending to > 900 and 700 m in length and breadth, respectively, persisted well within the search box (Fig. 7b & c). These leads allowed for the successful deployment of a Hugin-6000 AUV tasked with locating and surveying Endurance. Unfortunately, SA Agulhas II later lost communication with the AUV after initially tracking it on several survey lines close to the sea floor. Worsening sea-ice conditions meant that the search for the AUV had to be abandoned with no multi-beam data retrieved. The reasons for the loss of the AUV remain unknown.
Discussion
Marine-geophysical evidence in the form of multi-beam swath-bathymetry and acoustic sub-bottom profiling shows that the sea floor in the proximity of the wreck of Shackleton's Endurance is of very low gradient and likely to be composed of fine-grained hemipelagic sediment (Fig. 5). The very slow rates of sedimentation in the deep waters of the Weddell Sea also suggest that the wreck itself is unlikely to have been draped by more than a few centimetres of silt and clay in the century since it sank.
In addition, the relatively smooth morphology and acoustic character of the sea floor on the continental slope above the wreck site present little evidence of mass movements (Fig. 5). Isolated slide scars and turbidity-current channels have been mapped to the north (Fig. 3c & d), along with a possible presence of gullies on the upper slope below the shelf break inferred from IBSCO bathymetry (Fig. 2a). However, such features are no closer than ~200 km from the wreck site, and multi-beam lines closer to the search area show a relatively smooth sea floor typified by sedimentary lenses of acoustic Facies C (Fig. 4). Importantly, these lenses are capped by a crudely laminated drape of ~10 m in thickness (Fig. 5), indicating low-energy sedimentation over the past 10 000 years since regional deglaciation of the continental shelf east of the Antarctic Peninsula (e.g. Ó Cofaigh et al. 2014).
The sea floor of the continental shelf east of the Antarctic Peninsula has been heavily reworked by the ploughing action of iceberg keels down to modern water depths of 620 m (Fig. 3a & b). Ploughmarks deeper than the keels of icebergs calved from the modern Larsen C Ice Shelf (maximum 320 m) are likely to have been produced during regional deglaciation between c. 14 and 10.5 kyr bp. The maximum observed depth of ploughmark occurrence on Antarctic continental shelves is typically 500–600 m (e.g. Barnes & Lien Reference Barnes and Lien1988, Dowdeswell & Bamber Reference Dowdeswell and Bamber2007), and ploughmarks at 700–800 m depth are exceptional (e.g. Gales et al. Reference Gales, Larter and Leat2016, Wise et al. Reference Wise, Dowdeswell, Jakobsson and Larter2017). The Endurance wreck site is therefore at least 2000 m below the keel-depths of even exceptionally thick icebergs, and damage to the vessel's remains by this mechanism will not have taken place. The probable maximum keel-depths of even ridged multiyear sea ice in the Weddell Sea are no more than 20 m at most, and so this is also no threat to the integrity of the wreck. Thus, our marine-geophysical observations from the slope-shelf system in the western Weddell Sea, around and upslope of the wreck site, suggest that the Endurance is likely to have been both undisturbed and unburied since it sank in 1915.
Arguably, the main difficulty in any attempt to discover and image the wreck using, for example, AUVs and remotely operated vehicles (ROVs) is therefore the severe sea-ice conditions in the western Weddell Sea. Without doubt, an ice-breaking research vessel would be required in any year for which we have observations of late summer sea-ice conditions (Figs 6 & 7). Even in the most favourable year for which observations are available (2002), sea-ice cover was between 40% and 90% around the wreck site, and in every year since then the cover has been 90–100% (Fig. 6). Indeed, 90% and often 100% sea-ice cover often extends several hundred kilometres from the wreck site, making any approach slow at best. This level of sea-ice cover poses problems not just for ice-breaker access, but also for the launch and recovery of AUVs and ROVs that might be used to investigate the wreck site in detail. Sea-ice hazard is probably the main reason why the wreck has remained undiscovered since the loss of Endurance just over a century ago. The Weddell Sea, and particularly the western side of the clockwise gyre, therefore remains one of the world's least accessible oceans because of these extreme sea-ice conditions (Figs 6 & 7).
Summary and conclusions
• We have used marine-geophysical evidence of sea-floor morphology and shallow acoustic stratigraphy to examine the nature of the substrate both around the relatively well-known location at which Endurance sank and for the part of the continental slope-shelf sedimentary system above this site on the western side of the Weddell Sea.
• Few signs of turbidity-current and mass-wasting activity are found either near or upslope of the wreck site, and any such activity was probably linked to full-glacial higher-energy conditions when the Antarctic Peninsula Ice Sheet last advanced across the western Weddell Sea continental shelf ~20 000 years ago.
• The wreck site is well below the maximum depth of iceberg and sea-ice keels, and Endurance will not have been damaged by ice-keel ploughing of the sea-floor.
• Thus, Endurance has remained undisturbed by submarine mass wasting and has probably been draped by only a few centimetres of fine-grained sediment since it sank in 1915.
• Severe sea-ice conditions in the western Weddell Sea almost every year since 2002, a year of unusually low sea-ice cover when access was relatively easy, would hamper access to the wreck site.
• Accessing and investigating the wreck of Sir Ernest Shackleton's ship Endurance in the Weddell Sea therefore represents a significant challenge.
• An ice-breaking research vessel is required in any year for which we have observations, and even this would not guarantee that the site could be reached.
• High-resolution satellite imagery revealed the presence of open-water leads proximal to and extending within the wreck site in February 2019, enabling SA Agulhas II to gain access to this sector of the Weddell Sea.
• Sea-ice cover approaching 100% at the wreck site during most summers may also pose difficulties for the launch and recovery of AUVs and ROVs deployed to investigate the Endurance wreck in detail.
• As the fate of Shackleton and his ship demonstrated a century ago, and as our data show for the modern period, the sea ice of the Weddell Sea makes navigation and access problematic.
Acknowledgements
Data from the EU Copernicus Marine Service Information were used for ship navigation in the Weddell Sea. MODIS and VIIRS imagery were obtained from NASA's Global Imagery Browse Services (GIBS) data portal, part of NASA's Earth Observing System Data and Information System (EOSDIS). We thank the reviewers of the paper for their helpful and constructive comments.
Author contributions
JAD wrote the initial manuscript, on which all authors provided comments. Geophysical data were collected by AWI authors and sea-ice data were contributed from SPRI. CLB drafted the figures.
Financial support
Funding from the Flotilla Foundation and Marine Archaeology Consultants Switzerland to JAD supported the Scott Polar Research Institute's work on this paper. CLB was funded by a grant from the Norwegian Vista Programme. TerraSAR-X data were acquired by the German Aerospace Center (DLR) under grant OCE3624.


 Open access