


Introduction
Frazil-ice formation in northern rivers causes many problems which are fascinating from scientific and engineering points-of-view and are of immediate economic importance. Frazil ice can cause flooding, block water-supply intakes, reduce or halt power generation in hydroelectric facilities, interfere with ship and barge transportation, and damage orrestrict the use of hydraulic structures and facilities. Development of rational design methods for alleviating or avoiding these problems is still hindered by deficiencies in the present state of understanding of frazil-ice formation.
A knowledge of the water temperature in turbulent streams during periods of frazil-ice formation can be used to increase our understanding of heat losses, supercooling, nucleation and growth of frazil ice, and other processes and parameters associated with its formation. However, very few in situ measurements of water temperature during periods of frazil-ice production have been reported. This situation is surprising in view of the fact that frazil ice appears to be the dominant form of ice occurring in turbulent streams in Alaska as well as in other northern regions.
Figure 1 illustrates an idealized thermal history of a turbulent stream during periods of frazil-ice production. These ideal curves are observed in laboratory experiments when heat loss from the water surface is constant (Reference CarstensCarstens 1966, Reference Michel and OuraMichel 1967). However, the variability of heat loss from natural streams leads to more uneven curves (Reference OsterkampOsterkamp 1978) and the magnitudes of the various parameters that define the curves are different for curves obtained under laboratory conditions compared to those obtained in streams. Figure 1 illustrates the fact that the equilibrium temperature of the water te at time te.is usually depressed because of the presence of dissolved substances in the water. In principle, frazil-ice nucleation can occur at any time t after the water temperature has been reduced to Te. Nucleation occurs at time tm and temperature Tn. The minimum stream temperature Tm occurs at time tm. At any time t>te the magnitude of the supercooling of the water is
where T is the water temperature at t. The maximum supercooling is Δ?ιη and the residual supercooling is ΔTΓ which is responsible for the continued growth of frazil-ice crystals and other ice in the water.
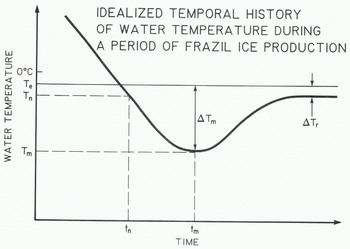
Fig. 1. An idealized graph of temperature versus time during a period of frazil-ice production in a turbulent stream. Te is the equilibrium temperature.and Tn and Tm are the temperatures at the time of nucleation t_ and maximum supercooling tm, The maximum supercooling is t m.and residual supercooling is δ?γ.
The freeze-up period of streams in interior Alaska begins with the first formation of frazil ice during a supercooling event. Frazil ice may be produced for a time period of 1 1/2 months or longer. The number of frazil-ice events may vary from one to perhaps 15 or 20. Each event nay last for a few tens of minutes to several days with events of a few hours’ duration the iiiost common.
Field investigations of frazil ice have been conducted in streams in interior Alaska since the mid 1960s (Reference BensonBenson 1973). Very detailed studies were carried out in 1971 and 1972 in Goldstream Creek and in 1981 in the Chatanika River, with less detailed observations and measurements made during most of the years since the mid 1960s (e.g. Reference OsterkampOsterkamp 1975). Both of these streams are relatively small and have drainage basins in permafrost terrain. Goldstream Creek had a bed slope of ˜0.001 and a discharge of =1 m3 s−1 while the Chatanika River had a bed slope of 0.002 and a discharge of 2 to 5 m3 s−1 at the study site. More detailed characterization of these streams is given by Gilfilian (unpublished) and Gosink and Osterkamp (1983).
This paper summarizes some of the measurements of water temperature made during these investigations with emphasis on the periods of freeze-up during 1971 and 1972 in Goldstream Creek and 1981 in the Chatanika River. These data are used to determine cooling rates of stream water, heat loss, and equilibrium temperatures for 1ce-stream water mixtures, tn, Tn. Δ?n. tm, Tm, Δ?^, and Tr. Some of the experimental methods, results and implications for the formation and growth of frazil ice are discussed.
Equilibrium Temperature of Ice-Stream Water
The equilibrium temperature Te of frazil ice crystals in stream water (Equation (1)) is needed to calculate the magnitude of the supercooling Δ?. Frazil -ice crystals are thought to be relatively pure, clieniically, so that Te can be determined from the equilibrium temperature of a mixture of pure ice and stream water. Finely ground pure ice was placed in a 4-liter dewar which was itself immersed in an ice bath. Water from Goldstream Creek, obtained during freeze-up, was also cooled in the ice bath to 0°c”, This water was then added to the ice-filled dewar and the equilibrium mixture was monitored with four mercury-in-glass thermometers and a thermistor. The thermometers were calibrated in an ice bath and in a triple-point-of-water cell. The measured temperature difference was0.005°c. The thermistor was calibrated in an ice bath only.
The average reading of the four thermometers and the thermistor was -0.005°C which is the same as the value for Te calculated from the electrical conductivity of the water (Reference OsterkampOsterkamp 1978). Therefore the equilibrium temperature Te—0.005°C for water from Goldstream Creek during freeze-up.
Water-Cooling Rates and Heat Losses
Average values of the surface heat loss and water-cooling rates can be useful in devising predictive models of stream freeze-up..
Figure 2 illustrates the water temperatures in Goldstream Creek during the transition from summer to fall and before the first supercooling event. During this time, the stream water temperature lagged the mean daily air temperature by nearly two days. The average net rate of heat loss per unit area per unit time is

where Mw/A is the mass of water per unit surface area, C is the specific heat of the water at constant pressure, and dT/dt is the cooling rate of the water· A rough estimate of dT/dt and 0* can be determined for the last several hundred hours prior to frazil-ice production by fitting a straight line through the data points shown in Figure 2. Average values for dT/dt are -0.10 mK min−1 for 1971 and -0.39 mK min”1 for 1972. Using Equation (2), the corresponding values for Q* are -4.7 and -18 W r, r2 for 1971 and 1972 respectively. In the Tanana River, during 1981, dT/dt»-0.22 mK min−1 and Q*—10 w m−2.
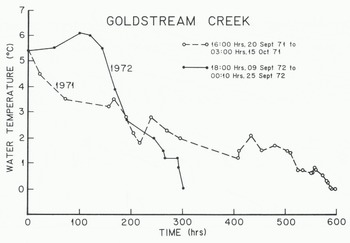
Fig. 2. Water temperatures in Goldstream Creek during the freeze-up period
These sparse data suggest that the average surface heat loss prior to the first period of frazil-ice production in these interior Alaska rivers is on the order of -5 to -18 H m−2. This heat loss produces an average water-cooling rate of several tenths of a degree per day. Short-term values may be an order of magnitude higher and may represent heat gain rather than heat loss.
Frazil-ice production appeared to be different for the 1971 and 1972 freeze-up periods in Goldstream Creek. During 1971, because of the slow rate of water cooling, frazil ice was not formed until 15 October, five days before freeze-up. The stream water supercooled and frazil ice was produced on three of those days. During 1972, the stream water cooled rapidly and frazil ice was produced on eight occasions, starting on 25 September and continuing to the day of freeze-up, 20 October. While the freeze-up dates were the same for both years it is estimated, from visual observations and a few measurements (Osterkamp and others 1975), that much more frazil ice was produced during the 1972 freeze-up.
When the water temperature of a stream is on the order of +1°C or colder, the normal heat losses associated with colder night temperatures can cause the water to supercool and produce frazil ice. Figure 3 illustrates the behavior of the temperature in Goldstream Creek during the eight supercooling periods of 1972, After the first observed period of supercooling on 25 September the water temperature remained within 1.3°C of the freezing point for the 27 days prior to freeze-up.
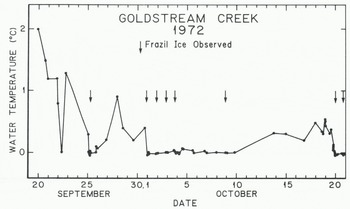
Fig. 3. Water temperatures in Goldstream Creek during the freeze-up period in 1972.
Just before and during periods of frazil-ice production the heat losses from a stream and the water-cooling rates may be an order of magnitude greater than the average values. Figure 4 shows the thermal history of the water in Goldstream Creek just before and during a period of frazil-ice production. It should be pointed out that this thermal history is not necessarily typical. During 1972, only two frazil-ice events produced curves similar to that shown in Figure 4. This natural variability of stream temperature during a frazil-ice event is related to changes in the heat loss caused by changes in air temperature, wind, cloud cover, precipitation, etc. (Reference OsterkampOsterkamp 1978). Consequently it is rare that T versus t graphs may be expected to resemble the nearly ideal case shown in Figure 4.
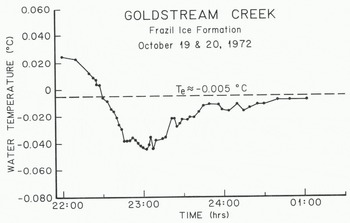
Fig. 4. Water temperatures in Goldstream Creek during a period of frazil-ice production.
For the frazil-ice event shown in Figure 4, dT/dt−1.2 mK min−1 just prior to frazil-ice formation. According to Equation (2), Q*— 55 W m−2. Values for dT/dt usually ranged from -1 to -3 mK min−1 for several other frazil-ice events where there was a nearly linear rate of water cooling before the formation of frazil ice. The corresponding surface heat losses 0* ranged from -47 to -140 W m2.
Water Surface Temperatures
Present theories of frazil-ice nucleation include mass-exchange processes at the air-water interface and secondary nucleation (Reference OsterkampOsterkamp 1977), and nucleation in a thin supercooled surface layer of water (Reference MichelMichel 1978). One way to test these theories is to measure the surface temperature Ts of the water. There are at least two ways to determine Ts: by measuring the temperature profile in the air and water and by direct measurement using a radiation thermometer. Air-water temperature profiles have been measured in a small pond, during warm weather, by Woodcock and Stommel (1947) using liquid-in-glass thermometers and in a stirred laboratory tank by Michel and Hanley (1975) using thermistors. These tank experiments showed that the surface temperature of the water was -0.1 to -0.3°C at the time of frazil -ice nucleation. Radiation thermometers have been used to measure the supercooling at the surface of a lead in sea ice (Reference KatsarosKatsaros 1973), in laboratory tanks (Katsaros and Liu 1974), and in a small stream during periods of frazil-ice production {Osterkamp and Gilfilian 1975). These radiation measurements showed that the water surface in a small stream during a period of frazil-ice production was, at most, supercooled a few tenths of a degree. We have measured air-water temperature profiles and have obtained additional data on Ts during periods of frazil-ice production in the Chatanika River using a radiation thermometer during the freeze-up period in October 1981.
Measurements of the air-water temperature profile were made with a needle probe thermistor (1.275 mm in diameter and 77 mm in length) which had a time constant of 0.2 s. A threaded rod was attached to the thermistor probe which was mounted horizontally. The whole assembly was clamped to a pipe driven into the river bottom. This arrangement allowed the thermistor to be positioned vertically to an accuracy of about 0.5 mm. Accuracy of the temperature measurements was better than ±10 mK with a sensitivity of about 5 mK. Figure 5 shows an air-water temperature profile measured with this apparatus. The zero position of the probe was taken to be the point at which it was immersed in the water. Corrections for radiative heating of the probe (-0.31°C) have been made using the method suggested by Reference Deacon, Dobson, Hasse and DavisDeacon (1980). In Figure 5, it is thought that the break in the temperature profile at -2.t13°C was caused by turbulent rupture of the boundary layer in the air above the water.
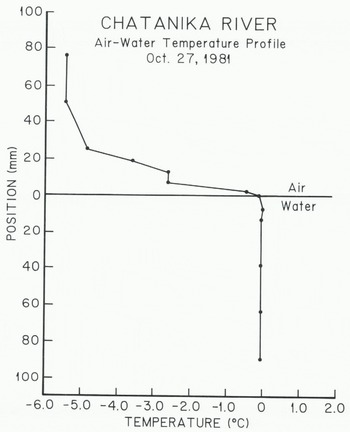
Fig. 5. A temperature profile across the air-water interface during a period of frazil-ice formation in the Chatanika River.
Figure 5 shows that the major portion of the temperature change across the air-water interface occurred in the air above the water surface. At a position 1.9 mm above the water surface, the temperature was -0.47°C. The zero position temperature (probe immersed in the water surface) was -0,009°C. Linear interpolation between these two points gives TS»-0.12°C. The bulk water temperature was constant at -0.005°C except for the point 7.0 mm below the water surface where it was -0.001°C. Measurements made with precision mercury-in-glass thermometers (Reference OsterkampOsterkamp 1979) gave a bulk water temperature of -0.006”C at the time the thermistor measurements were made.
An infrared radiometer which operates in a “window” of the water-vapor absorption spectrum can also be used to measure Ts (Reference KatsarosKatsaros 1973). Radiation detected by the radiometer is emitted primarily from the water above the 50 mm depth so that the measured temperature should be Ts. A Barnes PRT-10 radiation thermometer was used to measure Ts in the Chatanika River prior to and during periods of frazil-ice production. An ice-water slush was used to calibrate the instrument at 0°C and the measurements were then made within a few tens of seconds after the calibration. Ts was found to be 0°C within the sensitivity of the measurements (0.2°C).
The air-water temperature profile in Figure 5 and the radiometer measurements show that Ts was about -0.2°C or warmer in the Chatanika River during periods of frazil-ice production. Therefore it is concluded from these measurements that supercooling of the river water surface during periods of frazil-ice production did not exceed 0.2°C.
Nucleation Temperatures
When the stream temperature was decreasing and it appeared that the water would supercool, repeated observations were made in the stream searching for the presence of frazil-ice crystals. The crystals were observed by noting their reflections in an underwater light beam. These observations allow an estimate of tn, Tn, and Δ?n or, at least, a determination of their limits. It is estimated, from these observations, that the time of frazil-ice nucleation usually occurs within a few minutes of te. Given the values dT/dt (-1 to -3 mK min−1) and Te (-0.005°C), then, for the bulk water in the stream, Δ?n<10 mK. On two occasions, frazil-ice crystals were observed when the water temperatures were slightly positive (+0.004°C and +0.026°C). The first case can be explained by noting the accuracy of the temperature measurements (±5 mK) and the timing of the observations (±1-2 min). However, in the second case, the water was 0.031°C warmer than Te when a small isolated frazil cluster was observed in the stream. It is believed that the observed frazil cluster was produced at an upstream site. It is estimated that a frazil cluster could survive for 10 to 100 minutes at the measured water temperature depending on its size and relative velocity with respect to the surrounding flow.
These measurements show that the magnitude of the supercooling in the stream at the tirile of frazil-ice nucleation was Δ?η10 mK. The above measurements of water surface temperature show that the magnitude of supercooling at the water surface AT<0.2°C These field measurements show that frazil-ice nucleation in these streams in interior Alaska occurs at water temperatures very close to Te. Since there are no known naturally occurring nuclei that could nucleate frazil-ice crystals at these temperatures, it is concluded that the primary source of frazil-ice nuclei in streams must be other ice particles, cold organic material or cold soil particles that may be introduced into the stream by mass-exchange processes at the air-water interface (Reference OsterkampOsterkamp 1977). Nucleation along the edges of a stream from existing border ice is another possibility but this nucleation mechanism is restricted to the stream edges.
Amount of Supercooling
The ni ni mum water temperature measured during these investigations was Tm = -0.045°C. Since Te = -0.005°C this corresponds to a maximum super- cooling of Δ?η = 40 mK. Arden and Wigle (1973) have reported iTm = 70 mK and Reference AltbergAltberg (1923) has reported occasional values of Δ? = 100 mK.
Residual Supercooling and Growth Rates of Frazil Ice
The variability of stream temperatures in response to changes in heat loss makes it difficult to identify residual supercooling. Figure 4 shows what may he a residual supercooling of Δ?Γ = 3 mK near the end of the observation period. In one other case, Δ?Γ = 9 mK which was observed for -80 min in Goldstream Creek.
These values of Δ?Γ may be used to estimate frazil-ice growth rates using the expression (Fernandez and Barduhn 1967)
where v is the growth rate in cm s”1, A is a constant (0.0466), V is the relative velocity between the ice crystal and the water in cm s−1, Δ? = Δ?Γ and n is an empirically determined parameter. Gosink and Osterkamp (1983) have suggested that V should be about the same as the rise velocity of frazil-ice crystals in stagnant water. Their measurements show that V«10 mm s”1 for frazil-ice crystals 3 mm in diameter. Fernandez and Barduhn (1967) have shown that n-1.82 at these low relative water velocities. For the two measured values of δ?γ (3 and 9 mK), v-1.2 × 105 mm s1 and 8.8 × 10⁵ nm s−1, respectively. These growth rates are extremely slow compared to the growth rate near the time of maxi mum supercooling (Tn = 40 mK] when v-1.3 × 10⁻³ mm s−1. At these growth rates, assuming Equation (3) holds at very small crystal sizes, the time required to produce a frazil-ice crystal 1 mm in diameter would be about 13 min (ATm = 4-0 mK) near tn while about three hours to one day would be required at the observed values of Δ?Γ. For the case represented in Figure 4 during a night of supercooling this suggests that, unless the period of residual supercooling is very long, most of the frazil-ice production occurred during the transient period from the time of nucleation to the time that the water became resi dually supercooled.
Summary
Field measurements of the water temperatures in turbulent streams in interior Alaska have been made before and during periods of frazil-ice production. A separate laboratory experiment was performed to measure the equilibrium temperature Te of an ice-stream water mixture. These data include water-cooling rates, water surface temperatures and profiles, minimum stream temperatures, and the magnitude of the supercooling at the time of maximum supercooling and during periods of residual supercooling. The data have been used to estimate water surface temperature, heat losses from the water surface, frazil nucleation times and temperatures and the magnitude of the supercooling at the time of frazil nucleation.
Average water-cooling rates during the summer-to-fall transition period amount to several tenths of a degree per day with heat losses of -5 to -18 M m−2. Short-term values may be an order of magnitude greater. Just prior to a frazil-ice event the water-cooling rates were -1 to -3 mK min−1 with corresponding heat loss rates of -47 to -140 W m”z.
The equilibrium temperature for water collected from Goldstream Creek during freeze-up was found to be -0.005°C.
Supercooling at the water surface of a stream before and during periods of frazil-ice production did not exceed 0.2°C as shown by measurements of the air-water temperature profile and radiometer measurements. Supercooling in the water at the time of frazil-ice nucleation was <10 mK. These measurements suggest that frazil-Ice nuclei in streams must be other ice particles, cold organic materials, cold soil particles, or combinations of these that may be introduced into the stream by mass-exchange processes at the air-water interface (Reference OsterkampOsterkamp 1977).
The maximum supercooling observed in these field studies was 40 K (water temperature -0.045°C). Two measured values for residual supercooling were 3 and 9 iiiK, Frazil-ice growth rates calculated from the observed supercooling values suggest that, unless the period of residual supercooling is very long, most of the frazil-ice production during one night of supercooling occurred during the transient thermal period from the time of nucleation to the tine that the water became residually supercooled.
Acknowledgements
We wish to thank the many persons who have helped, over the years, in the difficult and arduous task of obtaining water temperature measurements in streams during frazil-ice events which almost always occurred in the early morning hours before daylight. This research was formerly supported by the US National Science Foundation, Earth Sciences Section, Grant GA-30748, and is presently supported by the US Army Research Office,


