


Introduction
Mountain forests have two major roles in avalanche protection. The first is to prevent avalanches from starting and the second is to decelerate and stop small, frequent flowing avalanches. A forest on a steep slope can inhibit avalanche formation because it influences the character of the snowpack by intercepting incoming/outgoing radiation, interrupting snow transportation by wind and intercepting snowfall. Snow released from tree crowns as lumps and meltwater produces an irregular snowpack structure. Tree trunks may also support the snowpack. These effects inhibit the formation of slab avalanches (in der Gand, 1981; Reference Gubler and RychetnikGubler and Rychetnik, 1991; Reference McClung and SchaererMcClung and Schaerer, 2006).
The second use of mountain forests, that of breaking small frequent avalanches, has not been investigated in detail. Since large flowing avalanches can easily destroy large tracts of mountain forests, they are almost unaffected by trees. The energy required to fracture, uproot and entrain trees is small compared with the total potential energy of an avalanche, especially when the avalanche is large (Reference Bartelt and StöckliBartelt and Stöckli, 2001). In fact, the damage potential of large avalanches with tree debris may even be larger because of the increase in high-density mass within the avalanche. However, the role of forests in stopping small and medium-sized avalanches remains difficult to assess.
Avalanche dynamics models including avalanche size and tree effects have not been studied in detail except for an initial study by Reference Bartelt and StöckliBartelt and Stöckli (2001). That study presented a simple center-of-mass avalanche model that applies the principle of conservation of energy to calculate the deceleration of avalanches caused by tree fracture, overturning and debris entrainment. The calculated results revealed that tree entrainment slows down an avalanche more than tree fracture, depending on the mass of the root system mobilized during tree upheaval and entrainment.
Avalanche dynamics models have included the effects of forests (Reference Christen, Bartelt and KowalskiChristen and others, 2010). Simulations reveal that even if forests cannot reduce the runout distances of large avalanches, they can prevent the lateral spreading of avalanches, reducing the inundation area. These results are based on ad hoc selection of friction parameters. Therefore, fundamental problems remain in understanding how forests reduce the speed of avalanches. The question what kinds of forests provide the maximum protection against snow avalanches is unanswered. Clearly, more instrumented observations of avalanches and forest damage are required to solve these problems.
In 2008, we had the unique opportunity to obtain a dataset of an avalanche with forest damage from the Makunosawa valley, Myoko, Japan. A large-scale dry slab avalanche occurred in the valley on 17 February 2008 and damaged many trees (Fig. 1; Reference TakeuchiTakeuchi and others, 2009, 2010). Snow avalanches have often occurred in the Makunosawa valley, so it is ideally suited for studying how meteorological elements influence avalanche activity. Since 2000, five large-scale snow avalanches with a running distance exceeding 2000m have been observed and some characteristics of avalanches in this valley have been obtained from the 11 winter seasons up to 2010 (Reference Takeuchi, Akiyama and IrasawaTakeuchi and others, 2002, Reference Takeuchi, Yamanoi, Endo, Murakami and Izumi2003; Reference TakeuchiTakeuchi, 2010).

Fig. 1. Avalanche damage to cedar trees in the Makunosawa valley in 2008. (a) Cedar leaves and branches appeared on the debris surface in the melt season. (b, c) Broken and fallen cedar trees from the avalanche.
The 17 February 2008 avalanche was the largest of the five observed. It was the only event that damaged large tracts of forest. During the melt season in April, many trees broken by the avalanche appeared on the surface and we found that the avalanche seemed to stop in the cedar (Cryptomeria japonica) forest and not pass through the forest. Therefore, we were able to investigate the extent of damage to the cedar forest and attempted to estimate the avalanche velocity in the forest from the bending stress of the broken cedar trees. The purpose was to verify the effect of forests in reducing avalanche velocity.
The role of mountain forests in stopping avalanches is an important problem in Japan. There have been several reports on forest damage caused by snow avalanches in Japan (e.g. Reference SaekiSaeki, 1975). The path and form of movement of avalanches has been determined according to the tree damage (Reference ShimokawaShimokawa, 1983). Reference Johnson, Ramey and O‘HaganJohnson and others (1982) estimated the maximum wind velocity of hurricanes based on tree damage. However, we know of no studies that have estimated avalanche velocity in the same way. We analyzed the position and damage of each tree and were thus able to estimate the avalanche velocity in the forest.
In this paper, we present two results regarding snow avalanche activity in mountain forests. Firstly, we present general information regarding the occurrence of a very large-scale avalanche, including the meteorology leading up to the avalanche, the extent of the runout zone and the mass of debris. Secondly, we report details of forest damage and estimate the avalanche velocity in the forest.
Site and Methods
The Myoko area including Makunosawa valley (36˚54' N, 138˚10' E) is located on the Sea of Japan side in the center of the main island (Honshu) of Japan. It is one of the heaviest snowfall areas in Japan, where the northwesterly monsoon conveys heavy snowfalls in winter. The depth of daily new snowfall sometimes exceeds 1 m, and the annual maximum snow depth is >4m in the valley. Makunosawa valley starts near the peak of Mount Kanna and faces east (Fig. 2). The altitude at the top of the valley is 1740 m. The valley slope generally increases with altitude. It is 35–40˚ at the highest part, which is the starting zone of the large-scale avalanches.

Fig. 2. (a) Overview of Makunosawa valley. (b) Runout zone taken at the point ⊙ in (a). G: geophone; D1 and D2: snow avalanche detection systems; M: meteorological station; V: video camera.
Avalanches were detected by a geophone, video camera and a snow avalanche detection system located in the Makunosawa valley. A geophone (G) was set up on the avalanche path and recorded vertical tremors of ground motion caused by avalanches. A snow avalanche detection system consists of detection poles and a signal conversion device. Two detection poles, D1 and D2, were installed on the avalanche path and subjected to avalanche impact with built-in vibration sensors (Reference Iikura, Kawashima, Endo and FujiiIikura and others, 2000). A video camera (V) was set up to record the process of avalanche release and flow. Meteorological elements (air temperature, precipitation and snow depth) were measured at a meteorological station, M, where the altitude is 810 m. V and M are not on the avalanche path and are safe from avalanches (Fig. 2). In addition, data on sunshine duration and wind speed at the site nearest the Makunosawa valley of the Automated Meteorological Data Acquisition System (AMe-DAS) of the Japanese Meteorological Agency (Sekiyama; 350ma.s.l.) were obtained for the simulation of the snow-pack model.
We confirmed the avalanche in the Makunosawa valley on 22 February 2008, 5 days after it occurred. The fracture line of the flank was seen in the highest part of the valley, and the starting zone of the avalanche seemed to be the east-southeast-facing slope around 1700 ma.s.l.
The debris was surveyed in April to understand the deposited mass and the extent of the runout zone of the avalanche. Before the debris snow began to melt, a pit observation of debris was made at the center of the runout zone (point A), and the density, liquid water content, hardness and snow water equivalent of debris were measured. To estimate the snow water equivalent of the debris, snow cores were taken using a Kamuro-type snow sampler (cross-sectional area 20cm2) at ten points along the longitudinal line of the runout zone, and the thickness and mass of the debris layer in each snow core were measured. The positions of the measurements were recorded by GPS. The furthest reach of debris and the lateral edge of debris were recorded by GPS, when many leaves and branches carried by the avalanche and buried in the debris appeared on the surface due to melting (Fig. 1a).
In May, after the snow had disappeared, tree damage in the cedar forest in the runout zone was investigated. The cedar trees were planted in 1947. The distance from the avalanche starting point to the upper part of the forest is ~2700 m. The area of investigation (17m wide and 130m long; Fig. 3a) was fixed and all trees in the area were measured. The items measured were the tree height, height of the lowest branch, breaking height of the trunk, trunk diameter at the breaking height, diameter at breast height, and position of the tree. The height of the lowest branch (see Fig. 6 left, further below) is the lowest height at which branches survive on both sides of the trunk, and implies the height (thickness) of the avalanche. Trees with lower branches newly broken by the avalanche were measured and uninjured trees were excluded.

Fig. 3. (a) Topographic map of the Makunosawa valley. Arrows indicate the direction of fallen trees, i.e. The flow direction of the avalanche. The dotted line is an extension of the facing direction of the starting zone. (b) Runout zone and the positions of debris survey. G: geophone; D1 and D2: snow avalanche detection systems; M: meteorological station; V: video camera.
Results
Time of avalanche release
The time of the avalanche release was 1348 h on 17 February according to the data of the geophone, the avalanche detection system and the video camera. Obvious tremor data were recorded for ~30 s by the geophone, and the maximum amplitude of the tremor velocity exceeded 3000×10–6ms–1. Pulse signals were recorded for ~15 s by the avalanche detection system. The avalanche could not be photographed due to very low visibility on account of the heavy snowfall; only snow powder blowing toward the camera could be taken at that time.
Meteorology preceding avalanche
The air temperature, snow depth, precipitation and sunshine duration during the 7 days before the avalanche release are shown in Figure 4. The weather cleared up and the air temperature exceeded 0˚C on 11 February. Snowfall started the next morning, and 2–3cm of new snow was deposited on the evening of the 12th. The air temperature dropped rapidly in the evening, decreasing to –9.2˚C before the dawn of the 13th. At the same time, snowfall increased and the snow depth increased rapidly. The total precipitation from 12 February to the time of the avalanche release was 174 mm, and the snow depth increased from 225cm to 381 cm. The air temperature when the avalanche released was –6.7˚C.

Fig. 4. Meteorology from 11 to 17 February 2008. (a) Air temperature, (b) snow depth and (c) precipitation at 810ma.s.l. (d) Sunshine duration at 350ma.s.l. Arrow indicates the time of avalanche release.
Runout zone and path
The farthest reach of debris was ~770ma.s.l., and the horizontal runout distance was 3000 m from the top of the starting zone. The starting zone and runout zone are shown in the topographic map (Fig. 3). The area surrounded by a solid line indicates the runout zone where we confirmed debris. It was estimated at ~10 ha.
According to the positions and directions of fallen trees, the avalanche seems to have separated, with part of it flowing straight over the ridge as shown by the dotted line (Fig. 3).
Water equivalent of debris
In the results of the pit observation of debris, the snow depth was 349cm and the debris depth was 319–174 cm; the thickness was 145 cm. The debris layer included many snow blocks of various sizes up to ~1m. This corresponds to observed dry and wet snow avalanche deposits in Switzerland (Reference Bartelt and McArdellBartelt and McArdell, 2009). Most of the debris had become granular snow and the liquid water content was 8–10% (9% on average).
The debris thicknesses are shown in Figure 5. Since the granular snow deposited after the avalanche remained on the debris at all points, we considered the debris had not yet melted. As the debris should not include any liquid water at first, the 9% liquid water was considered to be filtrated meltwater and rain. The water equivalent of the original debriswas estimated at 400–1500mm (1000mm on average) by excluding the 9% liquid water from the mass of debris.

Fig. 5. Thickness of debris and natural snowpack at 11 points in the runout zone.
Extent of cedar forest damage
A total of 130 trees within the fixed area were investigated, and we found that 12 were uninjured, 48 were upright with only the branches broken, 11 were leaning, 13 were broken and fallen, 22 were stumps without fallen trunks and 24 were fallen trunks without stumps (Fig. 6). Ninety-five per cent (123) were cedar trees, and only the cedar tree data were used in this study. The cedar tree heights were 3.5–22.2m (15.5m on average), and the diameters at breast height were 0.14–0.56m (0.38m on average). Damage to the cedar trees was most severe near the upper edge of the forest. It gradually decreased, and the rate of uninjured trees increased, the further we went into the forest. The direction in which the trees had fallen indicated the avalanche track (Fig. 7).

Fig. 6. Damage to the cedar trees.

Fig. 7. (a) Positions and damage of cedar trees in the investigation area. (b) the directions of fallen trunks. White arrows are fallen trunks with stumps; black arrows are fallen trunks without stumps.
Near the upper edge of the forest the height of the lowest branch was ~17 m. This decreased the further we went into the forest, and indicated the avalanche height decrease (Fig. 8). The trunk diameter at the break height was ~0.70m near the upper edge of the forest. This also decreased the further we went into the forest (Fig. 9). The decreasing tendency was not observed in the diameters at breast height of trees that were not broken (+ in Fig. 9). Therefore the decrease in trunk diameter at the break height appears to be caused by a decrease in avalanche velocity and impact force in the forest. In Figure 9, 32 (97%) of the broken trunks are located at <70m from the upper edge of the forest. The avalanche seems to have advanced 70 m, breaking many trunks and high branches, and then to have broken only three thinner trunks and lower branches (Fig. 8 and 9) in its continued advance. This suggests it was decelerating within the forest. No tendency can be seen in the relationship between the distance from the upper edge of the forest and the breaking height of the trunk (Fig. 10). The mean of the breaking height was 1.2 m, and many more trunks were broken at the lower height than at the snow surface height of 3.8 m.

Fig. 8. Relationship between height of the lowest branch and distance from the upper edge of the forest. •: upright tree, ∘: leaning tree.

Fig. 9. Relationship between trunk diameter at the breaking height and distance from the upper edge of the forest. +: diameters at breast height of trees that were not broken.

Fig. 10. Relationship between breaking height of the trunk and distance from the upper edge of the forest. The dashed line indicates the height of the snow surface (3.8 m).
Discussions
Snowpack estimation in the starting zone
As it was difficult to carry out a pit observation in the starting zone, the snow type and stability index of the snowpack were estimated using a snowpack model. The SNOWPACK model was developed by Reference Bartelt and LehningBartelt and Lehning (2002) and applied by Reference Lehning, Bartelt, Brown, Fierz and SatyawaliLehning and others (2002a,Reference Lehning, Bartelt, Brown and Fierzb) for the Swiss avalanche warning. The parameterization of shear strength was improved based on the data in heavy-snowfall areas of Japan by Reference Hirashima, Nishimura, Yamaguchi, Sato and LehningHirashima and others (2008). We simulated the snow profile and stability index (SI) using this improved model. The SI is the shear strength divided by the shear stress. Reference Hirashima, Nishimura, Yamaguchi, Sato and LehningHirashima and others (2008) estimate the stability index from the shear strength formulated by Reference Yamanoi and EndoYamanoi and Endo (2002) and Reference Abe and GleasonAbe and others (2006).
Meteorological data (air temperature, precipitation, snow depth, sunshine duration and wind speed) were used as input data for the simulation. Air temperature was corrected for the starting zone altitude (1700ma.s.l.) considering a lapse rate of 6.5×10⁻³˚Cm–1. The slope angle was inputted as 40˚ and the direction was southeast in the simulation. In the results, the surface snow had melted due to solar radiation on 11 February, and faceted grains then formed on the refrozen layer at 2 m (Fig. 11a). Because snow had been deposited on the faceted snow layer right after that, the minimum SI of snowpack decreased to 0.5, which is highly susceptible to avalanche release (Fig. 11b). Accordingly, the sliding surface of the avalanche was presumed to be the faceted snow which formed on 13 February and remained in the snowpack until 17 February.
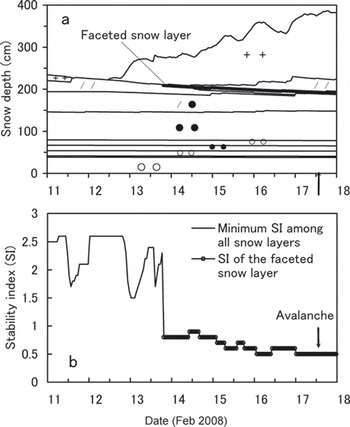
Fig. 11. Snow profile and stability index (SI) at the starting zone (1700ma.s.l.) simulated by SNOWPACK model. The thick line in (a) indicates a faceted snow layer. +: new snow, /: lightly compacted snow, •: compacted snow; ∘: granular snow.
Avalanche mass estimation
We have estimated the avalanche mass very roughly based on the snow water equivalent of debris measured at 11 points. The method chosen to estimate the avalanche mass depends on the circumstances. For example, Reference Vallet, Gruber and DufourVallet and others (2001) obtained volume measurements before and after the avalanche triggering by photogrammetric methods. They measured the release and deposition volumes of large-scale avalanches and proved that avalanches entrain a large amount of snow along the avalanche track. Reference Sovilla, Sommavilla and TomaselliSovilla and others (2001) carried out manual measurements of the mountain snowpack from the starting zone to the deposition zone for four avalanche events in order to investigate mass entrainment and deposition processes. The mass-balance analysis of the four events showed that the deposition increased with track length. This result confirms the similar results of Reference Maeno, Naruse and NishimuraMaeno and others (1987) who investigated the formation mechanism and deposition patterns of snow avalanche debris using a mini-avalanche system constructed in a cold laboratory.
The deposition pattern was assumed to be similar in the case of the avalanche at the Makunosawa valley, and the snow water equivalent of debris was approximated by a quadratic expression on the distance from the farthest reach of the debris, based on the observed data in this study. The approximated values of snow water equivalent multiplied by the area of the runout zone gave a deposition mass of 10×107 kg. Since the base snow-water equivalents of debris were measured along the longitudinal center line of the runout zone and the debris was considered to be thicker in the center, this value of 10×107 kg may be an overestimate. Assuming that the debris thickness was highest at the center and fell to zero at the lateral edges of debris, the deposition mass might be underestimated at 5×10⁷ kg. Consequently, the deposition mass of the avalanche was roughly estimated at 5–10×107 kg (1–2×10⁵m3 based on the mean density of debris, 463 kg m–3).
Avalanche velocity estimation in the cedar forest
Based on the investigation results, the avalanche velocity was estimated from the bending stress of the broken cedar trees. Generally, three layers can be distinguished in the well-developed, full-size dry-snow avalanches: a dense-flow layer at the bottom with a density of ~300 kg m–3; the saltation layer with a density of ~30 kg m–3 above or ahead of the dense layer; and the suspension layer with a density of <10 kg m–3 above and behind the saltation layer (Reference Issler, Hutter and KirchnerIssler, 2003).
The dense-flow layer contains snow blocks, and the suspension layer consists of small snow grains. There is a fairly clear interface, rather than a gradual transition, between the dense core and the powder snow avalanche. The height of the powder snow layer can be 200 m or more, while the thickness of the dense-flow layer was less than ~2m and large shear rates were found in the dense-flow layer (Reference GublerGubler, 1987; Reference Nishimura and ItoNishimura and Ito, 1997; Reference Kern, Bartelt, Sovilla and BuserKern and others, 2009).
Snow blocks were found in the debris in the runout zone, and the avalanche seemed to reach ~17m height at the upper edge of the cedar forest. We estimate the avalanche velocity assuming two layers: the dense-flow layer and the powder snow layer. The velocities of the two layers are assumed to coincide.
It was considered that the cedar trees broke as a result of bending, not shear stress, as the ends of the broken trunks were roughly split (Fig. 6). A tree is considered to break when the bending stress exceeds the modulus of rupture (MOR) of the tree. The MOR of the cedar trees in the Makunosawa valley was unknown, so the measurement value for Japanese cedar trees of 30±5MPa (Reference NakataniNakatani, 1991) was adopted. Assuming the trunk is a column with diameter D (m), the maximum bending stress, σ (Nm–2), is expressed as
where M (N m) is the bending moment and Z (m3) is the section modulus. The section modulus is directly related to the strength of a corresponding shape of section. In the case of a circle section, section modulus can be obtained by
The avalanche force on the trunk, F (N), is expressed as
where A (m2) is the area of the vertical section (A = Dh; h (m) is flow thickness), C d is the drag coefficient, ρ (kgm–3) is the avalanche density and v (m s–1) is the avalanche velocity. In this case, the sum of the bending moments of the two layers, M 1 and M 2, caused by F 1 and F 2, operates on the breaking height, h b (m), of the trunk (Fig. 12). The avalanche was assumed to flow on the snow surface, the height of which, h s, was 3.8 m. The force received from the snowpack was regarded as negligible. The bending moments, M 1 (N m) and M 2 (N m), operating on the breaking height, h b (m), are expressed as

Fig. 12. Schematic of load on trunks from avalanche.
The thickness of the powder snow layer, h 1 (m), is obtained by deducing snow depth, h s (m), and the thickness of the dense-flow layer, h 2 (m), from the height of the lowest branch, H (m), as
The value of h 2 was unknown, so it was assumed to be 1 or 2 m, because the debris thickness observed near the forest was ~2m (Fig. 5) and the large shear rate at the bottom layer was found to be below ~2m (Reference GublerGubler, 1987; Reference Nishimura and ItoNishimura and Ito, 1997; Reference Kern, Bartelt, Sovilla and BuserKern and others, 2009).
When F 1 (N) and F 2 (N) obtained by Equation (3) are substituted into Equations (4) and (5), the bending moments, M 1 (N m) and M 2 (N m), can be expressed as the function of avalanche velocity, v (m s–1), as shown by Equations (7) and (8). The drag coefficient, C d, was given as 1.2 following Reference KashiyamaKashiyama (1967), Reference Johnson, Ramey and O‘HaganJohnson and others (1982)
and Shi-igai (1993).
Using these equations, (1) the initial velocity of the avalanche flowing into the forest and (2) the deceleration in the forest were calculated. To estimate the initial velocity flowing into the forest, the bending stress on the trunk with a 0.70 m diameter was calculated since this was the largest diameter among the broken trunks near the upper edge of the forest (Fig. 9). The breaking height, h b (m), of the trunk was 0.5 m according to observation. Avalanche velocities for various densities (ρ 1 is 3, 10 and 30 kg m–3, ρ 2 is 200, 300 and 400 kg m–3) were calculated, assuming h 2 (m) to be 2 m. Because the distance, x (m), from the upper edge of the forest to the broken trunk was 4 m, H (m) was set at 16.7 m following Equation (10).
The relationships between the bending stress and the initial velocity of the avalanche for various densities are shown in Figure 13. Assuming ρ 1 = 3 kg m–3 and ρ 2 = 300 kg m–3, the initial velocity of flow into the cedar forest is estimated from the figure to be at least 26–31ms–1.

Fig. 13. Relationship between avalanche velocity and the bending stress on the trunk with 0.70m diameter. The range of MOR (30±5MPa) is shown by the dotted lines. (a) the density of the powder snow layer, ρ 1, is 3, 10 and 30 kgm–3, and the density of the dense-flow layer, ρ 2, is fixed at 300 kg m–3. (b) ρ 1 is fixed at 3 kg m–3, and ρ 2 is 200, 300 and 400 kg m–3.
This result was compared with previous works. Examples of peak velocities for large-scale dry snow avalanches are 18–35ms–1 at Rogers Pass, Canada, 23–49ms–1 for 12 dry snow avalanches at Ryggfonn, Norway, and up to 65 ms–1 in the Aulta path in Switzerland (Reference Issler, Hutter and KirchnerIssler, 2003). For the Makunosawa valley avalanche in 2001, the mean velocity was ~40ms–1 from the tremor of the geophone (Reference Takeuchi, Yamanoi, Endo, Murakami and IzumiTakeuchi and others, 2003). The 1984 avalanche was simulated and the velocity was calculated at ~30ms–1 near the upper edge of the cedar forest (Reference Abe, Nakamura, Lang and OhnumaAbe and others, 1987). The velocity obtained in this study seems to be a reasonable value.
To estimate the avalanche deceleration, the trunk diameter, D (m), at breaking height was given by Equation (9) because D (m) decreased with the distance x (m) like the line in Figure 9. H (m) was given by Equation (10) like the line in Figure 8. This line connects the maximum H in the area with x≤70 m, because 97% of the broken trunks are located in the area where x≤70m (Fig. 9).
The h b (m) was fixed at 1.2 m which is the mean of all measurements. Avalanche velocities were calculated in three cases in which h 2 = 2, 1 and 0m, assuming ρ 1 = 3 kg m–3 and ρ 2 = 300 kg m–3.
Decreases in avalanche velocity in the forest are shown in Figure 14. The velocity was estimated to be larger with a smaller h 2, because the contribution to the bending moment of the dense-flow layer with high density is larger than that of the powder snow layer with low density. In this calculation, H (m) was given by Equation (10) and this approximate line does not coincide with the observed H in the area with x > 70m (Fig. 8). However, this influence on the calculated velocity was confirmed to be very small. In this calculation, the thickness of the dense-flow layer was fixed at 1 or 2 m, and the difference of H came to be the difference in the thickness of the powder snow layer. As the density of the powder snow layer is small, the bending moment of the layer to the trunk is small. Therefore the influence on the calculated results was small. The height of the lowest branch lowered abruptly ~70m from the upper edge of the forest. This may show that the branches were broken by the dense-flow layer in the area with x>70m, while they were broken by both layers in the area before 70 m. The velocity decreased to 0ms–1 ~130m from the upper edge of the forest in any case of h 2. This result was caused by the decrease in D (m) as shown by Equation (9), but this position where the velocity became 0ms–1 coincided with the observation.

Fig. 14. Avalanche velocities in the forest calculated in three cases (the thickness of the dense-flow layer, h 2, is 2, 1 and 0 m). The densities of powder snow and dense-flow layers (ρ 1 and ρ 2) were assumed to be 3 and 300 kgm–3. The MOR was given as 30MPa, and the dotted lines indicate the results of MOR fluctuation (30±5MPa).
Concluding Remarks
We obtained a dataset on a large-scale dry slab avalanche and forest damage in the Makunosawa valley. The avalanche on 17 February 2008 was one of the largest observed in the valley; the horizontal runout distance was ~3000 m, the area of the runout zone was ~10 ha and the mass of debris was 5–10×107 kg (1–2×10⁵m3). The sliding surface of the avalanche was presumed to be the faceted snow which formed at 2m height according to the snowpack model simulation. The avalanche was estimated to flow into the cedar forest at a velocity of >26–31ms–1, with a 17 m high suspension layer and a dense-flow layer <2m in height. It slowed down in the forest, and stopped ~130m after penetrating the upper edge of the forest.
We attempted to calculate the avalanche velocity in the forest from the bending stress of the broken cedar trees and obtained a reasonable deceleration of the avalanche. However, the cause for the avalanche stopping there may be not only the resistance of the forest but also the terrain of the valley. Had the cedar forest not existed there and had the avalanche reached further, the effects of the forest in reducing the avalanche velocity would have been confirmed. To understand the decelerating effects of forests, a numerical simulation of an avalanche over the terrain of the Makunosawa valley with and without forest would be useful. This study will help such a numerical simulation in the future.
In this study, only the bending stress was considered and the force of the avalanche was assumed to operate on the trunk with constant pressure. Consideration of a more complex process such as shear stress by a large shear rate and impact force by snow blocks in the dense flow layer will be a future work.
Acknowledgements
The survey and investigations on the snow avalanche and forest damage were supported by K. Izumi, I. Kamiishi, K. Kawashima, S. Yamaguchi, N. Miyazaki, E. Podolskiy, T. Suzuki, T. Sakamoto, H. Hagino, Y. Goto, S. Murakami and Y. Endo. This study could not have been carried out without their support, for which we are very grateful. We also thank the scientific editor, P. Bartelt, for his useful suggestions on the manuscript and very kind encouragement. Part of this study was financially supported by a Grant-in-Aid for Scientific Research (project No. 22510199) from the Ministry of Education, Culture, Sports, Science and Technology of Japan.


