Introduction
Ice-flow modeling requires a constitutive relation giving the mechanical response of ice to stresses. Calculations described in most ice-sheet models are based on non-linear isotropic flow laws. Discrepancies between calculated and in-situ data can be due to deficiencies in the flow law (Reference Van der Veen and WhillansVander Veen and Whillans, 1989). Anisotropic flow laws accounting for polar ice fabrics observed on deep ice coreshave been proposed by Reference Lliboutry and DuvalLliboutry and Duval (1985) and Reference Van der Veen and WhillansVan der Veen and Whillans (1990). A simpler procedure accounting for anisotropic effects is to introduce an enhancement factor, defined as the ratio of the measured strain rates to that corresponding to isotropic ice (Reference Dahl-Jensen and GundestrupDahl-Jensen and Gundestrup, 1987). But this technique is not satisfactory since the flow law is always isotropic. Data from laboratory tests on Antarctic ices have already demonstrated the importance of anisotropy in the constitutive relations. for example, ice with c-axes aligned with the vertical axis is stiffer to horizontal normal stresses and softer with respect to shear stresseson horizontal planes (Reference Pimienta and DuvalPimienta and others, 1987).
Since fabrics change with time, the anisotropic constitutive equations must be associated with a model giving the evolution of the preferential orientation of c-axes. To develop such a model, deformation and recrystallization mechanisms must be determined. For conditions prevailing in polar ice sheets, intracrystallined is location glide is the main deformation mechanism(Reference Pimienta and DuvalPimienta and Duval, 1987; Reference AlleyAlley, 1992). Grain growth driven by grain-boundary energy is observed in the first hundred meters of central parts of the ice sheets. In warmice, typically above -12°C, near to the bedrock, are crystallization regime involving rapid migration of grain boundaries is observed. Multi-maxima fabrics are associated with this termed "migration recrystallization".Between these two zones, new grains are formed during creep polygonization, and grain-boundary migration is driven by both grain-boundary and strain energies(Reference Lipenkov, Barkov, Duval and PimientaPimienta and Duval, 1989). As a result, grain-size generally does not increase. This recrystallization regimeis termed "rotation recrystallization" (Reference PoirierPoirier, 1990). The boundary between rotation and migration recrystallization regimes corresponds to a limited range ofdepths. Clear evidence of this transition was observed by Reference Gow and WilliamsonGow and Williamson (1976) at a depth of 1800 m in the Byrd Station ice core. An evolution from slow impurity-controlled to fast impurity-free grain-boundary migration as proposed by Reference Guillopé and PoirierGuillopé and Poirier (1979), may be the origin of this rapid change of the recrystallization regime
The purpose of this paper is to introduce a deformation model for the evolution of fabrics in polar ices. The effect of recrystallization is not taken into account. The formation mechanism offabrics is based on the rotation ofc-axes induced by basal glide. The mechanical response ofthe polycrystal is obtained by an appropriate average ofthe response of each grain.
A first approach to this problem has been given by Reference Azuma and HigashiAzuma and Higashi (1985). The implicit assumption of their theory is that basal glide occurs at the same rate in each grain, regardless of its orientation. They found that the model predicts the observed fabric development at Dye 3, Greenland. This model, modified for uniaxialtension and pure shear, also describes fabrics observed in the Vostok ice core (Reference AlleyAlley, 1988). But this kind of model has not been tested for simple shear or other strain configurations.
Considerable effort has been made to apply polycrystalline plasticity theory to rocks. The Taylor theory(Reference TaylorTaylor, 1938), which assumes homogeneous deformation,has been successfully used to simulate fabric development as long as the plastic anisotropy of crystalsis not too large. In visco plastic self-consistent approaches(Reference Molinari, Canova and AhziMolinari and others, 1987), which compromise between stress equilibrium and strain continuity, each grain is considered as an inclusion in a homogeneous isotropic medium, representing the "weighted" average of all grains. The interaction formula is solved by minimizing stress and strain-rate deviations. This theory can provide good results for materials with a small number of independent slip systems (Reference Wenk, Canova, Molinari and KocksWenk and others, 1989, Reference Wenk, Bennett, Canova and MolinariWenk and others 1991).
Following Reference Lliboutry and DuvalLliboutry and Duval (1985), the uniform stress approximation may be applicable to polar ice, since grain-boundary migration associated with grain growth or rotation recrystallization should accommodate intra-crystallined is location glide. In this paper, the uniform stress bound (lower bound) is adopted to model both the creep and the development of fabrics in polar ice.
2 The Model
Let (O xyz ) be the reference frame of the laboratory(fixed) and (O λμν )be the coordinate system of eachcrystal (crystallographic coordinate system), where (O ν )corresponds to the c-axis (see Fig. 1). The Euler angles used are φ andϑ. To bring into correspondence the set of axes (O xyz ) with the set (O λμν ), two rotations are necessary: first, (O xyz ) is rotated by the angle ϑ about they y axis; then, the new system is rotated by the angle φ about the z axis. A third Euler angle is not necessary, because there is no preferential slip direction in the basal plane.
Let Q be the corresponding transformation matrix(expressed in(O λμν )); Q is given by:

Fig.1 Orientation of ice Crystals defined in the crystallographic axes system (Oλμν) relative to the fixed external axes (Oxyz). (Ov) corresponds to the c axis.(Oμ)is in the plane (Oxy).
We call T the average stress tensor applied to the polycrystal, expressed in (O xyz ). With the assumption of a uniform stress state, the stress tensor Tc in each grain is given, in the crystallographic axes, by:
where QT is the transposed matrix of Q
We assume that monocrystals can deform only bybasal glide. Reference HutchinsonHutchinson (1977) noted that the self,consistent theory could provide reasonable estimates of the flow strength for hexagonal polycrystals displaying less than five independent slip systems. From Hutchinson,the overall deformation of polycrystalline ice is possible with only basal and prismatic slip. From Reference Duval, Ashby and AndermanDuval and others (1983), non-basal glide requires a stress at least 60 times larger than that required for basal slip at the same strain rate. The introduction of prismatic slip therefore has little effect on the deformation of ice crystals.
Thus, only the stress components![]() and
and![]() can induce basal glide.
can induce basal glide.
The velocity gradient tensor Lc for each crystal expressed in (O λμν ), is given by:
With a viscoplastic power law for basal glide
Where
A simple calculation shows that, in our deformation model, the exponent n is necessarily the same for the bulk sample and the monocrystal. Simulations were done using two values of the stress exponent n. The value n = 1.5 was chosen from data obtained by Reference Pimienta and DuvalPimienta and others(1987) on polycrystalline ice at low stresses. The value n = 3 was taken with reference to the commonly adopted value for polycrystalline ice.
The coefficient A is fitted to reproduce the viscosity of an isotropic ice sample; we have found, in order to reproduce the Glen law coefficient Bo at -15°C, for n = 3: A = 1.4 × 10⁻²⁴ Pa-3 S-1, which gives Bo = 3.2 × 10⁻²⁵ Pa-3 S-1 (from Legac,1980); for n = 1.5: A = 5.6 × 10⁻¹⁷ Pa-1.5 S-1, which gives Bo = 1.9 × 10⁻¹⁷ Pa-1.5S-1(from Reference Pimienta and DuvalPimienta and Duval, 1987).
It is important to compare these values with the coefficient of the power law obtained using mechanical tests on a monocrystal, even if the exponent of the flow law is different (Reference Duval, Ashby and AndermanDuval and others, 1983). For a single crystal, strain rates for basal glide are at least two orders of magnitude higher than those determined using the above coefficients. Ina polycrystalline aggregate, grain-boundary migration and/or recrystallization should accommodate strain incompatibilities (Reference Lliboutry and DuvalLliboutry and Duval, 1985) but not enough to impede completely grain interactions.
The expression of the velocity-gradient tensor L of each grain in the laboratory axes is:
which can be decomposed into the sum of the strain-ratetensor D (symmetric) with the rotation-rate tensor W (antisymmetric) :
with
The bulk velocity gradient L (in O xyz ) of the sample is given by averaging all tensors L:

where m is the number of grains.
L , in the same way as L, can be decomposed as:
Now we apply the boundary conditions: let
L
F
be the final average velocity gradient of the polycrystal after applying the boundary conditions (with the decomposition![]() and L
f the final velocity gradient of each grain (with:L
f=D
f+Wf
), both expressed in (O
xyz
).
and L
f the final velocity gradient of each grain (with:L
f=D
f+Wf
), both expressed in (O
xyz
).
We make the assumption that during the transformation,the rotation of the matrix of material containing the considered grain is equal to the bulk final imposed rotation![]() . In the most rigorous way, the rotation of this matrix has to be taken equal to the average rotation of thedirect environment of the inclusion (in our case about five to ten grains). The assumption made here does not allow us to calculate local effects concerning the crystal orientations but it does not affect significantly the average fabric evolution. Furthermore, the rotational part Wf of the final velocity gradient of each grain has to be equal to the rotation of the matrix, i.e.
. In the most rigorous way, the rotation of this matrix has to be taken equal to the average rotation of thedirect environment of the inclusion (in our case about five to ten grains). The assumption made here does not allow us to calculate local effects concerning the crystal orientations but it does not affect significantly the average fabric evolution. Furthermore, the rotational part Wf of the final velocity gradient of each grain has to be equal to the rotation of the matrix, i.e.
Let![]() be the rotation rate that is necessary to add to the velocity gradient
L
to satisfy the local boundary conditions.
be the rotation rate that is necessary to add to the velocity gradient
L
to satisfy the local boundary conditions.
i.e.
In the case of irrotational transformations (irrotational uniaxial compression, tension or pure shear),![]() is given by:
is given by:
In the case of a simple shear in the plane (O xy ), in thedirection (O x ):

Now let ![]() be the rotation rate that is necessary to add to the velocity gradient Lto satisfy the local boundary conditions. The final velocity gradient of each grain isthen given by:
be the rotation rate that is necessary to add to the velocity gradient Lto satisfy the local boundary conditions. The final velocity gradient of each grain isthen given by:
i.e.
Equations (3)andEquations (5) then give:
The tensor Wbe then corresponds to the rotation rate ofthe c axis of the considered grain.
The calculation step used for the simulations is 1% equivalent strain, which is defined as:
where dt is the time step, and![]() is the equivalent strain rate, defined as:
is the equivalent strain rate, defined as:
This calculation step is small enough to consider all tensors constant during one step.
The gradient transformation tensor Fc , corresponding to the c-axis rotation is given by:
where the exponential function is defined, for second-order tensors, with the relation:

with I the identity tensor.
The final c-axis orientation is given by the vector Cf (expressed in O xyz ), with:
where C is the unit vector of the(O v ) axis in(O xyz )

In the same way, the transformation gradient tensor F of the bulk sample, corresponding to the considered calculation step, is given by:
and the total (cumulative) transformation gradient tensor F tby:
where![]() is the initial transformation of the polycrystal.
Results of this model can then be separated in two parts:
Equation (6) gives the fabric development
Equation (4) gives the rheological law of the anisotropic ice sample.
is the initial transformation of the polycrystal.
Results of this model can then be separated in two parts:
Equation (6) gives the fabric development
Equation (4) gives the rheological law of the anisotropic ice sample.
3 RESULTS AND DISCUSSION
3.1 fabric evolution
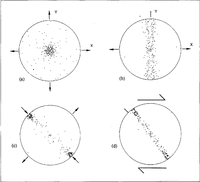
Figure 2displays the simulated fabrics in (a) uniaxial compression, (b) uniaxial extension, (c) pure shear and (d) simple shear, respectively, at 45%, 30%, 50% and40% equivalent strain. All these fabrics were simulated with n = 1.5 and with a constant applied stress. However,for simple shear, it is necessary to impose axial stresses increasing with strain to impede axial deformation,particularly when the preferential orientation of c-axes becomes pronounced. The corresponding evolution of the normalized equivalent strain rate is given in Figure 3. As the fabric develops, basal glide becomes impossible and, in the framework of our model, deformation of the polycrystal cannot occur any more.

Fig.2 Simulated c-axes fabric diagrams for an initially isotropic ice sample deformed: (a) to 45% equivalent strain in uniaxial compression; (b) to 30% in uniaxial tension; ( c) to 50% in pure shear and (d) to 40% in simple shear; arrows denote the sense of deformations; calculations were done with the exponent of the flow law n = 1.5; 200 grains.

Fig.3 Evolution of the normalized equivalent strain rate with the equivalent strain obtained by simulation in: (a)uniaxial compression; (b) uniaxial extension; ( c) pure shear; (d) simple shear. ∈eq = 0 corresponds to a randomly oriented aggregate. n = 1.5.
Fabric patterns in compression, extension and pure shear are in agreement with those simulated by Reference Azuma and HigashiAzuma and Higashi (1985) andReference Alley Alley (1988), and with fabrics observed in ice sheets, e.g. Dye 3 (Reference Herron, Langway, Brugger, Langway, Oeschger and DansgaardHerron and others,1985) and Vostok (Reference Lipenkov, Barkov, Duval and PimientaLipenkov and others, 1989) cores.
In simple shear, the c-axes rotate toward the direction of the maximal compression. This behavior is contrary to the intuition that the slip plane orients itself into the shear plane. Strong single-maximum fabrics observed in several deep ice cores are attributed to the rotation of the c axis by shear, and basal planes arc parallel to the permanent shear plane (Reference AlleyAlley, 1988).
It is interesting to compare these simulated fabrics with those obtained by the viscoplastic self-consistent theory on anisotropic rocks. The simulations for peridotiteby Reference Wenk, Bennett, Canova and MolinariWenk and others (1991) gave results similar to those obtained above for ice, and especially for peridotites containing 30-100% enstatite. Enstatite has, as for ice, a single easy-slip plane.
For α-quartz, for which basal slip predominates, the c axis fabric diagrams in simple shear deduced from boththe Taylor and self-consistent theories (Reference Wenk, Canova, Molinari and KocksWenk and others,1989) are qualitatively similar to those obtained using thehomogeneous stress bound.
Therefore, strong single-maximum fabrics cannot be attributed to simple shear alone. But, a metastableorientation of the c-axis along the normal to the permanent shear plane is found with the homogeneous stress bound. This orientation can be made stable if a compression normal to the macroscopic shear plane is imposed. These conditions are found in ice sheets; a more or less constant vertical strain rate is associated with the imposed horizontal shear stress (Reference Dahl-JensenDahl-Jensen, 1989).
Another explanation of the strong single-maximum fabrics is to associate rotation of basal planes by dislocation glide and rotation recrystallization. Such an explanation was given by Reference Kamb, Heard, Borg, Carter and RaleighKamb (1972) and Reference Bouchez and DuvalBouchez and Duval (1982). A review of mechanisms for the development of fabrics in ice sheets was recently given by Reference PatersonPaterson (1991).
3.2 Rheological parameters of the flow law
As seen in section 2, the model is able to produce the evolution of the rheological parameters of a polycrystalline aggregate, corresponding to the imposed stress state (or strain history).
Experimental results from uniaxial compression,biaxial compression and torsion tests on ice samples from the Vostok and Law Dome (Antarctica) ice cores have been analyzed by Reference Pimienta and DuvalPimienta and others (1987).Values of the rheological parameters at -15°C, corresponding to the anisotropic power law given by Reference Lliboutry and DuvalLliboutryand Duval (1985), were determined.
We call B the coefficient of the extended Glen law for anisotropic ice corresponding to an imposed deformation,and B o the coefficient of the Glen law for isotropic ice.Table 1 gives the ratios B/B0 for three different deformation configurations: uniaxial compression indirection (z',z), uniaxial compression in direction (x',x)and simple shear parallel to (x',x), where the axis system(xyz) is shown in Figure 2. These ratios are comparedwith those deduced from the homogeneous stress model with an exponent n = 3. The input fabrics are those givenby the model with simulations in uniaxial compression (∈eq = 45%) and uniaxial extension (∈eq = 30%) (see Fig. 2), using 200 grains. The value of B ois that obtained with a randomly oriented aggregate (isotropic).
Comparison of these results shows that our model is able to reproduce with quite good fidelity the different viscosities of both ice samples tested in compression.
Data from laboratory tests were obtained at high stresses for which the exponent n is equal to 3. The basic assumption for the homogeneous stress theory is probably not well adapted since high internal stresses must be present at high stresses (Reference Duval, Ashby and AndermanDuval and others, 1983). But experimental data from mechanical tests on anisotropic samples at low stresses (about 0.01-0.05 MPa) are notavailable.
Both ratiosB/B 0 obtained for the Law Dome sample in simple shear experiments are quite different (by afactor of 4). The simulated value cannot be higher than 4.3 (simulation with a single crystal where ϕ= 0),whereas a value of about 10 is obtained from laboratory tests on ice with a strong single-maximum fabric(Reference Pimienta and DuvalPimienta and others, 1987; Reference Budd and JackaBudd and Jacka, 1989).
These discrepancies probably originate from the value of the coefficient A of the flow law of ice crystals, fitted to reproduce the viscosity of isotropic polycrystalline ice.From Reference Lliboutry and DuvalLliboutry and Duval (1985), this parameter must depend on the fabric. The viscosity of ice crystals inserted into an anisotropic aggregate with a strong single maximum fabric is probably lower than that associated with an isotropic ice.
Table 1 Experimental data (from Reference Pimienta and DuvalPimienta and others, 1987) and simulated values of the ratios B/B0 , where B is the flow-law coefficient for Vostok (-2039 m) and Late Dome anisotropic ices and Bo is the average coefficient for isotropic ice samples (from Reference LeGacLegac, 1980). Fabrics taken Jar simulations are given in Figure 2a and Figure 2b; the external axes are represented in Figure 2; n =3

Acknowledgements
This work has been funded by the Centre National de laRecherche Scientifique (CNRS, France). We are very grateful to G. Canova for fruitful discussions