


Introduction
Deflecting dams are often used to protect settlements against dense-flow snow avalanches. The traditional design of such dams is based on rough energy or centre-of-mass considerations which take no account of the three-dimensional flow of the avalanche during the impact with the dam. There is therefore a substantial uncertainty associated with the design of such dams. Very few large avalanches have been observed to hit man-made deflecting dams. In spite of recent compilations of observations of the run-up height of avalanches on natural terrain formations (Reference Domaas, Harbitz and HestnesDomaas and Harbitz, 1998), there is a serious lack of the direct observations that are required in order to evaluate current design principles for deflecting dams, and thereby the effectiveness of such dams.
The traditional design of deflecting dams is based on the equation
which expresses the run-up height of a point particle, travelling at speed v on a horizontal plane, which hits a deflecting dam under a deflecting angle φ. It is assumed that no energy is lost during the impact of the particle with the dam, nor due to friction with the dam as the particle moves along the dam after the impact. The design height of the dam is then determined from the equation
where hk is given by Equation (1) and hs and hd are estimates of the thickness of snow on the ground and the thickness of the dense part of the flowing avalanche, respectively.
More elaborate descriptions of the flow of an avalanche against a dam are given by Reference McClung and MearsMcGlung and Mears (1995) and Reference Irgens, Schieldrop, Harbitz, Domaas and OpsahlIrgens and others (1998). Laboratory scale-model experiments have also been used to study the flow of avalanches that hit deflecting and catching dams (Reference Chu, Hill, McClung, Ngun and SherkatChu and others, 1995; Reference Tai, Noelle, Gray and HutterTai and others, 2001). The analysis of McGlung and Mears applies for a catching dam rather than a deflecting dam, i.e. the deflecting angle φ in Equation (1) is equal to 90°. Their analysis indicates that the run-up height given by Equation (1) is underestimated by a factor of the order of 2 for a catching dam, but an adaptation of their analysis for a deflecting dam is not given. The formulation of Irgens and others is based on a centre-of-mass avalanche model and makes it possible to take into account the slope of the hill where the dam is located, the slope of the dam side, energy loss in the impact of the avalanche with the dam, and friction of the avalanche as it flows along the dam. In spite of these improvements with regard to Equation (1), this formulation is based on great simplifications of the flow of the avalanche during and after the impact with the dam. There is therefore a pressing need for direct observations of avalanches that hit deflecting dams and also for further theoretical improvements in the description of the flow in order to reduce the uncertainty of the design of deflecting dams. Such observations and theoretical improvements are of great practical value considering the high cost of avalanche-deflecting dams and the important public safety implications of their design.
Avalanche Protection Measures at Flateyri
Two large deflecting dams connected by a short catching dam were constructed above the village Flateyri, northwestern Iceland, after a catastrophic avalanche accident in 1995. The dams, which were completed in 1998, were designed by the engineering firm Verkfraðistofa Sigurðar Thoroddsen hf. and the Norwegian Geotechnical Institute (VST and NGI, 1996; Reference Sigurðsson, Tomasson, Sandersen and HestnesSigurðsson and others, 1998). The dam height was chosen based on the traditional assumptions for the design of deflecting dams given by Equations (1) and (2).
The deflecting dams are designed to divert avalanches coming from the two main avalanche paths above the village, Skollahvilft and Innra-Bagargil, away from the settlement and into the ocean on the respective sides of the reef (Fig. 1). The catching dam has the purpose of stopping avalanche debris that might spill over the deflecting dams in a large event. Each deflecting dam is about 600 m long and 15–20 m high, and the catching dam is about 350 m long and 10 m high. The total volume of fill in the dams is about 700 000 m3, and the total cost of their construction was about USD5.5 million.

Fig. 1. Outlines of the avalanches on Flateyri in 1999 and 2000. The outline of the catastrophic avalanche in 1995 is also shown. The channelized flow of the 1999 avalanche from Skollahvilft along the deflecting dam is indicated with a dashed curve. Hypothetical outlines of the avalanches in 1999 and 2000 in the absence of the deflecting dams are shown as dotted curves.
Since the construction of the dams, both deflectors have been hit by avalanches with a volume of > 100 000 m3 and an estimated return period of 10–30 years (Fig. 1). The avalanche in 1999 from Skollahvilft was substantially smaller than the catastrophic avalanche in 1995, and would probably not have caused damage in the absence of the dams, since buildings in this part of the village had been destroyed by the avalanche in 1995. It is possible, on the other hand, that the avalanche in 2000 from Innra-Bsjargil would have reached the current settlement and destroyed several houses.
Observations of the Avalanches at Flateyri in 1999 and 2000
The avalanches from Skollahvilft on 21 February 1999 and from Innra-Bagargil on 28 February 2000 both occurred during typical avalanche cycles for northwestern Iceland. In such cycles there is typically intense snowdrift in strong northerly winds from the mountain plateau to the starting zones of the avalanche paths above Flateyri. The weather improved in both cases shortly after the avalanches occurred, providing favourable conditions for field observations including observations of flow marks along the track and in the run-out area.
The outlines of the avalanches were measured with Trimble Pathfinder and GeoExplorer global positioning system instruments, except for the westernmost part of the starting zone of the avalanche from Skollahvilft and the starting zone of the avalanche from Innra-Bsjargil. These parts of the outlines were estimated from below, based on the location of visible fracture lines with respect to landscape features that could be identified on a map of the mountain. The measured outlines are shown in Figure 1, together with the outlines of the catastrophic avalanche in 1995.
The outlines of the 1995 and 1999 avalanches from Skollahvilft between approximately 200 and 400 ma.s.l. show interesting dynamical features reflecting undulations in the flow of the avalanches in bends in the gully. The highest runup marks of the avalanches are up to 20–25 m higher along the western side of the gully than along the eastern side. This is a consequence of centrifugal forces due to changes in the flow direction around the bend to the left in the gully in this altitude range. These features, which implicitly determine the speed of the avalanche in the gully, are an interesting subject for study with a two-dimensional avalanche model, but will not be further discussed in this paper which focuses on the run-up marks on the deflecting dams.
The vertical run-up of the avalanches along the dams was found by measuring the vertical distance from the top of the dam to the highest flow marks at 20 (Innra-Bsjargil) and 40 (Skollahvilft) points using a Leica Vector 1500 distance ranger (Figs 2 and 3). This vertical distance was subtracted from the height of the dam at each location, giving the vertical run-up of the avalanche at the respective points. The highest flow marks on the dams were in many cases positioned where the snow on the side of the dam had been brushed away by the avalanche flow. The Skollahvilft dam was covered with snow when it was hit by the avalanche in 1999, and such marks in the snow could easily be identified along most of the dam. Another type of flow mark was scratches on icy patches of the surface of the dam side or vegetation fragments or soil particles scattered in the direction of the flow. Such marks were identified at several locations on the Innra-Bagargil dam in 2000.
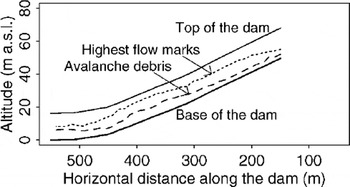
Fig. 2. Run-up of the Skollahvilft avalanche on 21 February 1999 along the eastern deflecting dam.

Fig. 3. Run-up of the Innra-Bæjargil avalanche on 28 February 2000 along the western deflecting dam.
It is not possible to determine the exact dynamic meaning of the run-up height determined in this way. Ideally one would wish to determine the maximum run-up of the dense part of the flowing avalanche. It is, however, possible that the saltation layer of the avalanche is able to produce flow marks of the type used to determine the run-up height along the dams at Flateyri, especially the marks in the snow on the Skollahvilft dam in 1999. If this is the case, the estimated flow marks are an overestimate of the highest run-up of the dense part of the avalanche, but it is difficult to quantify the degree of overestimation.
According to Equation (2), the highest run-up of the avalanche is given as the sum of the thickness of snow on the ground hs and the thickness of the dense part of the flowing avalanche hi, in addition to the vertical elevation increase arising from the kinetic energy of the avalanche given by Equation (1). Rough estimates of these terms are hs ≈ lm and hd ≈ 1 m. They are not exactly defined due to inevitable variations in the thickness of the snow on the ground in the vicinity of the dam before the avalanches occurred and the unclear meaning of hi in Equation (2) for the complex flow of the avalanche near the dam. The extent to which snow on the ground near the dam was entrained by the avalanche and carried along with it is also not well known. Some undisturbed snow was observed near the bottom of a snow pit near the Innra-Bagargil dam in 2000, but avalanche snow reached all the way to the ground in some of the other pits.
The highest run-up marks were 13 m above the base of the Skollahvilft dam for the 1999 avalanche and 12 m above the base of the Innra-Bagargil dam for the 2000 avalanche. The minimum vertical distance from the highest marks to the top of the dam was about 4 and 6 m, respectively. Subtracting hs ≈ 1 m, this total run-up corresponds to a dynamic run-up of 11–12 m due to the speed of the avalanche and the thickness of the dense part h*
The thickness of snow in the avalanche tongues was measured with avalanche probes along several lines across the tongue, and the snow density in the tongue was measured in snow pits, from which the total volume and the mass of the avalanches could be derived. The height of the fracture line and the snow density were measured in the main (eastern) starting zone of the Skollahvilft avalanche, but not for the Innra-Bagargil avalanche due to practical problems in reaching the starting zone in Innra-Bagargil.
Table 1 summarizes the main characteristics of the avalanches from Skollahvilft and Innra-Bagargil in 1999 and 2000 based on these measurements, together with the corresponding data for the catastrophic avalanche from Skollahvilft in 1995.
Table 1. Characteristics of the avalanches

An interesting observation related to the avalanches in 1999 and 2000 is the absence of any reported effects of the powder part of the avalanches. This is perhaps not unexpected for the Skollahvilft avalanche in 1999 since the current settlement is located some distance away from the dam due to the devastation of this part of the village in 1995. However, there are currently a few houses < 100 m away from the Innra-Bagargil dam, and the people in these houses did not notice any wind or pressure effects due to the avalanche on 28 February 2000. The avalanche was in fact only discovered some time after the event by people traveling across the avalanche path. The weather was bad at the time, so a powder cloud could easily have gone unnoticed, and a relatively weak powder pressure could have been mistaken for a wind gust. It is, however, clear that the powder pressure arising from the impact of the avalanche with the dam was not sufficient to break ordinary window glass or cause any damage to wood frame buildings 50–100 m away from the dam. It is possible that the absence of damages due to a powder cloud is caused by a sheltering effect of the dam which may influence the flow of the powder part of the avalanche in such a way that the powder flows above the houses located behind the dam (Reference Scheiwiller, Hutter and HermannScheiwiller and others, 1987). It is also possible, and perhaps more likely for the relatively mild maritime climate of Iceland, that the powder part of the avalanche was not powerful enough to reach the buildings behind the dam. In either case, this observation shows that the powder cloud associated with the impact of a 100 000 m3 avalanche with the deflecting dams at Flateyri does not endanger buildings close to the dams.
Interpretation
The impact with the dam channelized a part of or the whole of the width of the Skollahvilft and Innra-Bsjargil avalanches into a stream 20–80 m wide where the thickness of the flowing avalanche seems to have been increased with respect to the thickness of the undisturbed flow (indicated with a dashed curve for the Skollahvilft avalanche in Fig. 1). The width of the stream was 20–30 m for the first 100–200 m of the flow of the avalanche along the Skollahvilft dam and increased to 7080 m where the avalanche flowed over the road to the village below the lower end of the dam. The whole width of the Innra-Bsjargil avalanche was channelized into the stream along the lower part of the dam where the width of the stream was close to 50 m. The run-out of this channelized part of the avalanche is in both cases estimated to have been increased by > 100 m by the deflection of the flow by the dam.
Hypothetical outlines of the avalanches in the absence of the deflecting dams were estimated by redistributing the volume of snow in the streams, where the avalanche debris was observed to be thicker than in the undisturbed flow. The snow thickness within the hypothetical outlines was assumed to be the same as in the undisturbed flow (about 1 m in both cases), and the hypothetical tongue was laid out in the direction of flow of the avalanche before it was deflected by the dam. Some consideration was also given to the geometry of previous avalanches recorded from these paths in deriving the hypothetical outlines, especially for the Innra-Bagargil avalanche.
The run-out corresponding to the hypothetical outlines makes it possible to compare the avalanches in 1999 and 2000 to previous recorded avalanches at Flateyri. The return period of the avalanches from Skollahvilft and Innra-Bsjargil in 1999 and 2000 is estimated to be in the range 10–30 years (Reference JohannessonJohannesson, 1998; Reference Johannesson, Pétursson, Egilsson and TomassonJohannesson and others, 1999).
Estimates of the velocity of the avalanches as they hit the dams were derived by a physical model calibrated to reach the run-out corresponding to the hypothetical outlines described above and shown in Figure 1. The model incorporates similar physics as the traditional Voellmy-Salm model used for hazard-zoning in Switzerland (Reference Salm, Burkard and GublerSalm and others, 1990) and the Perla/Cheng/McClung (PCM) model (Reference Perla, Cheng and McClungPerla and others, 1980). A description of this model is given by Vatnaskil (1992). The Coulomb-friction and turbulent-drag parameters were given the values μ = 0.25 and ξ = 3000, respectively. The initial thickness of the avalanche was assumed to be 1–1.5 m for the Skollahvilft avalanche, and about 2 m for the Innra-Bagargil avalanche. The length of the moving avalanche in the computations was 300–350 m, and the variable width of the avalanches along the paths was derived from the outlines shown in Figure 1. These computations yielded the velocity v ≈ 30 m s-1 where the avalanches hit the dams.
The flow of the avalanches outside all the streams, that formed along the dams, seems to have been largely unaffected by the dams. East of the stream, which is indicated with the dashed curve in Figure 1, the margin of the tongue of the Skollahvilft avalanche in 1999 seems, in particular, unaffected by the presence of the dam. This shows that disturbances in the flow due to the impact with the dam are advected at high speed with the main avalanche flow along the dam and are therefore unable to reach further away from the dam than the 20–80 m indicated by the width of the streams. The dimensionless Froude number, which is a measure of the relative importance of gravitational and kinetic energy in the flow,
![]() is quite high for the avalanches, indicating a strongly supercritical flow. This shows that no disturbances due to the impact of the flow with the dam are able to propagate upstream against the rapid main flow, and indicates that there is a physical limit to the sideward propagation of disturbances away from the dam into the main avalanche flow. The Froude number may be interpreted as the ratio of the speed of the main flow to the propagation speed of disturbances. Therefore, the ratio of the increase in the width of the Skollahvilft stream, ≈50m, to the length of the stream, ≈450m, may be expected to be similar to 1/Fr =1/9, and these observations of the dimensions of the stream show this to be the case. Such considerations cannot be applied to the Innra-Bagargil stream which channelized the whole width of the avalanche.
is quite high for the avalanches, indicating a strongly supercritical flow. This shows that no disturbances due to the impact of the flow with the dam are able to propagate upstream against the rapid main flow, and indicates that there is a physical limit to the sideward propagation of disturbances away from the dam into the main avalanche flow. The Froude number may be interpreted as the ratio of the speed of the main flow to the propagation speed of disturbances. Therefore, the ratio of the increase in the width of the Skollahvilft stream, ≈50m, to the length of the stream, ≈450m, may be expected to be similar to 1/Fr =1/9, and these observations of the dimensions of the stream show this to be the case. Such considerations cannot be applied to the Innra-Bagargil stream which channelized the whole width of the avalanche.
The above velocity estimate can be inserted into Equation (1) to determine the term hv in the traditional formula for the run-up of an avalanche that hits a deflecting dam. The deflecting angle for the avalanches may be estimated from Figure 1 to be φ ≈ 25° for the Innra-Bagargil avalanche and φ ≈ 20° for the Skollahvilft avalanche (the deflecting angle is in both cases determined at or slightly upstream from the location of the highest run-up; other values for the deflecting angle are found at other locations along the dams). The results of these computations are shown in the last lines of Table 1. The total predicted run-up, K + hs + hd, is found to be 10.2 and 7.4 m for the Innra-Bagargil and Skollahvilft dams, respectively, which may be compared with the observed 12 and 13 m run-up.
Although of the correct order of magnitude, the predicted run-up is somewhat lower than the observed run-up. This may be partly explained if the run-up marks are to some extent produced by the saltation layer of the avalanche as discussed above. This possible effect of the saltation layer is more likely to be important for the run-up marks in the snow on the Skollahvilft dam, which are described above, where the discrepancy between the observed and predicted run-up is larger. The discrepancy could also be an indication that the modelled velocity is too low, or that the simple run-up formulation given by Equations (1) and (2) underestimates the run-up of avalanches on deflecting dams. Increasing the velocity from 30 m s–1 to 35 ms–1, which is within the uncertainty range of the velocity modelling, increases hv by 2–3 m. This eliminates the discrepancy between the observed and predicted run-up for the Innra-Bagargil dam, but not fully for the Skollahvilft dam. It is of course conceivable that the velocity of the Skollahvilft avalanche was higher when it hit the dam than the velocity of the Innra-Bagargil avalanche, but our observations and modelling do not indicate this. We are therefore not able to explain the larger discrepancy between the observed and predicted runup for the Skollahvilft dam than for the Innra-Bagargil dam.
There is inevitably an uncertainty associated with the derivation of the hypothetical outlines, and also in the modelled velocity values and in the estimated deflecting angles. In view of this uncertainty, there is an overall agreement between the observed and predicted run-up for the two avalanches, in spite of the above problems in deriving a fully consistent interpretation of the observed run-up height on both dams. This overall agreement is an important order-of-magnitude verification of the traditional formulation for the design of deflecting dams given by Equations (1) and (2), although this very simple formulation cannot be expected to be correct in detail. In view of the remaining vertical distance from the highest run-up marks to the top of the dams, this indicates that the dams will be effective against substantially larger events. Further theoretical interpretation of the observations of the avalanches at Flateyri in 1999 and 2000 may make it possible to quantify this conclusion more exactly.
Acknowledgements
O. Petursson, G. G. Tomasson, J. G. Egilsson, L. Tracy, I. Arnalds and A. Jónsson participated in the field measurements of the avalanches. I thank M. M. Magnússon and G. G. Tomasson who made useful comments on the text.


