Introduction
Ice shelves play an important role in the dynamics and possibly also in the stability of the Antarctic ice sheet. In order to be able to estimate the reaction of the ice sheet to sea-level change, it is necessary to understand the dynamical processes in the grounding zone. For this purpose a numerical ice-sheet-ice-shelf model of the grounding zone was applied to field data for Ekstromisen, Dronning Maud Land, Antarctica (Reference MayerMayer, 1996). The grounding zone of an ice shelf is often characterized by a change of surface slope from a steep, undulated surface of the grounded ice to a gently sloping surface of the floating ice shelf. Details are described by Reference VaughanVaughan (1994). Transition processes from shear-stress-dominated dynamics to a longitudinal stress regime characterize the ice in the area. Another characteristic feature is the onset of ablation processes at the ice-ocean interface right at the grounding line.
In order to obtain input data for future elasto-mechanical modelling, field data have been collected at the southern grounding line of Ekstromisen. The main emphasis of the field program was placed on collecting continuous observations of the horizontal as well as the vertical component of the ice displacement and their lateral variations across the grounding zone. The first modelling approach uses a simple elastic-beam model (Reference HoldsworthHoldsworth 1969) to obtain an approximation for tidal deflection dependent on Young’s modulus.
Fieldwork
During the austral summer 1996-97 an extensive field program was carried out with geophysical observations (reflection seismics, gravity, radio-echo sounding) and geodetic terrestrial and satellite measurements across the grounding line of Ekstromisen (Reference Nixdorf, Lambrecht, Steinhage and OerterNixdorf 1997), one of the smaller ice shelves in northern Dronning Maud Land. The expedition started at the German wintering base Neumayer situated in the northern part of the ice shelf close to Atka Bay (70°36′ S, 08° 15′ W). The area of investigation is located 120 km south of the base.
We measured the response of the ice body to the ocean tides at different locations with different sensor types: on the ice shelf 5 km from the grounding line, at the grounding line and on the grounded ice at 0.5, 1, 2 and 3 km from the grounding line (Fig. 1).
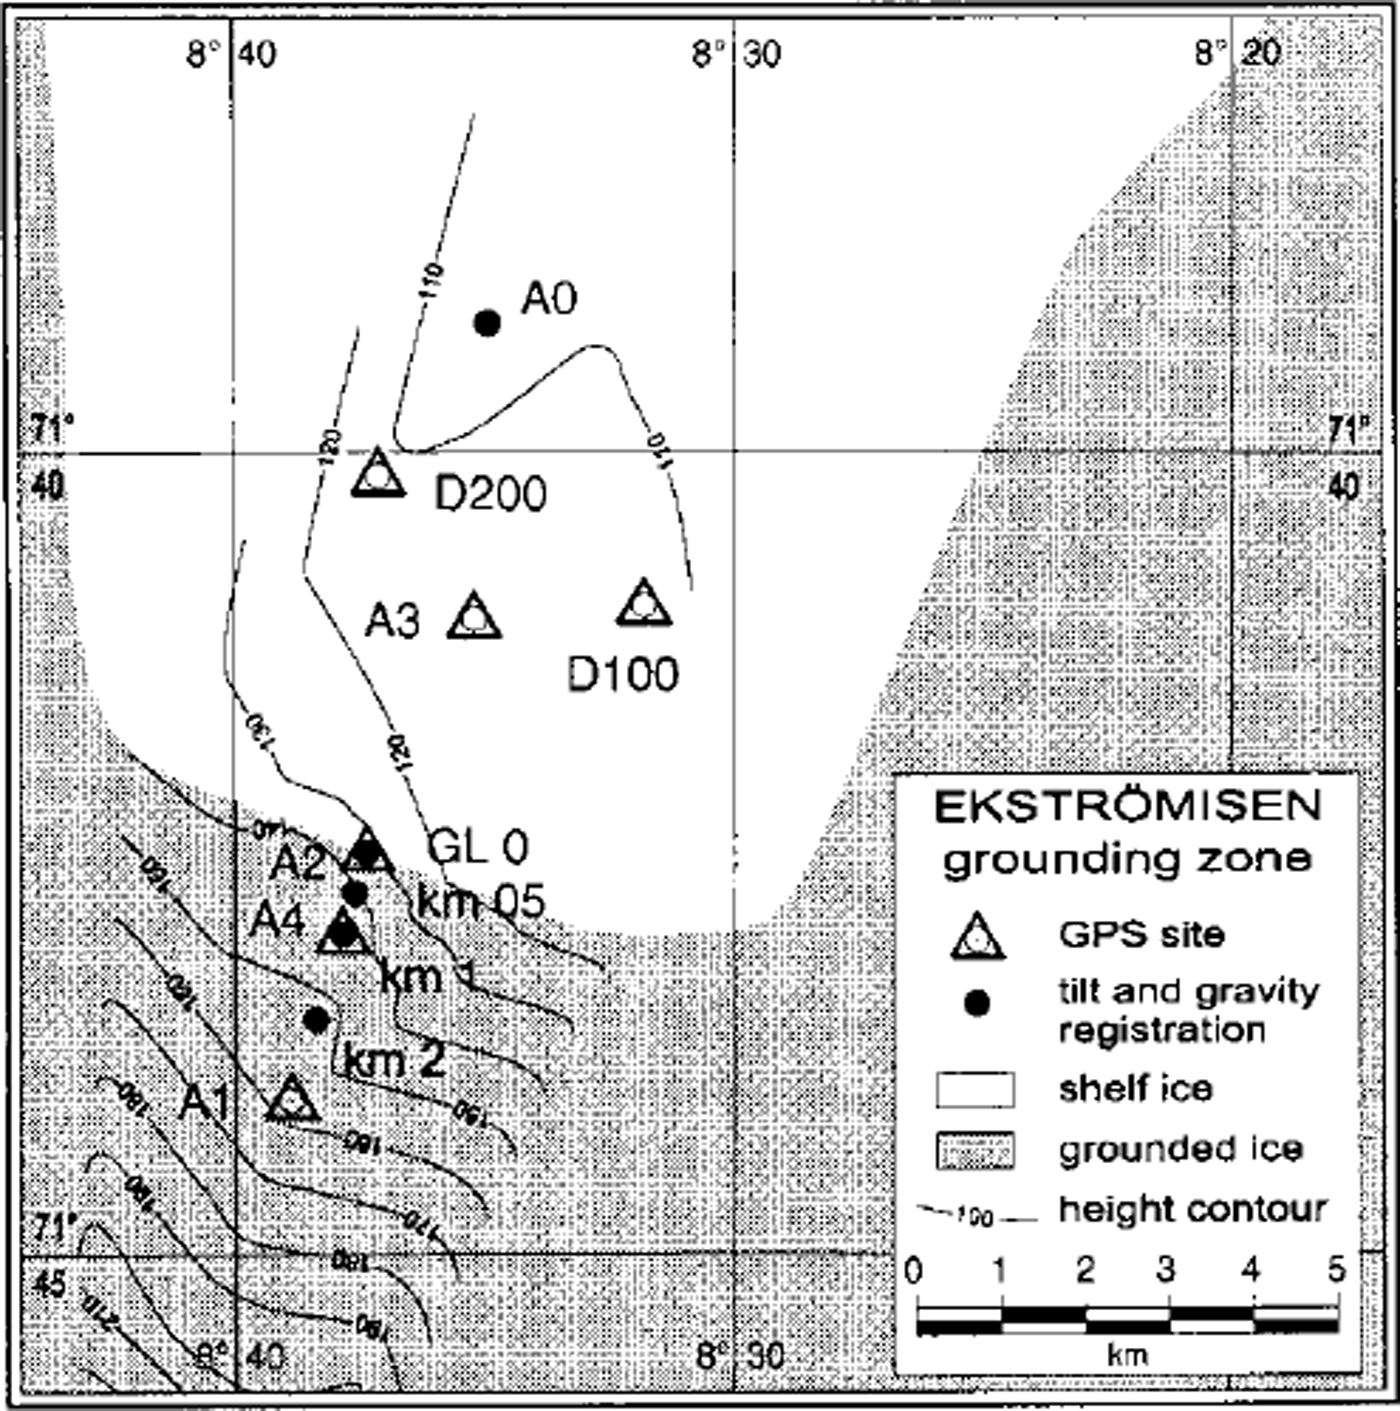
Fig. 1. The southern Ekströmisen grounding zone with the sites for continuous data.
To calculate the tidal deflection, data from two gravity meters (LaCoste Romberg gravity meters, G-type) and two tiltmeters (Tilt Ltd, Electrolevel type) with external data loggers were used. These instruments were buried in snow pits at the sites A0, GLO, km05, kml and km2. The recorded signals of the instruments are mainly due to the vertical displacement of the ice body under the influence of both ocean and earth tides. The length of the recorded time series is 5-13 days.
As reference data for the ocean tide signal we used the gravity time series of the Neumayer observatory. The tidal deflection influencing the gravity recording at Neumayer is primarily caused by the local sea tides (Reference Tezkan and YaramanciTezkan and Yaramanci, 1993)
In addition, six global positioning system (GPS) receivers (Trimble 4000 SSE) collected data in two different types of arrays. To determine the absolute ice movement, differential GPS was used in connection with a reference station on solid rock. Continuous strain observations were recorded in a second triangular array. The GPS observations lasted up to 16 days with only short interruptions. Through kinematic data-processing, three-dimensional coordinates were derived for every recorded time epoch.
Data Processing
Firstly, the recorded gravity and tiltmeter data had to be calibrated. Data gaps occurred due to battery failure and during the downloading of the data. To fill these gaps the Melchior procedure was adapted (Reference KobargKobarg, 1988), allowing further analysis on continuous time series. Then outliers had to be detected and removed. Snowdrift in the snow pits caused a change in the levelling of the instruments, resulting in an instrumental drift. These trends and the high-frequency noise were removed by bandpass filtering. Figure 2 shows a typical raw dataset for position km2.
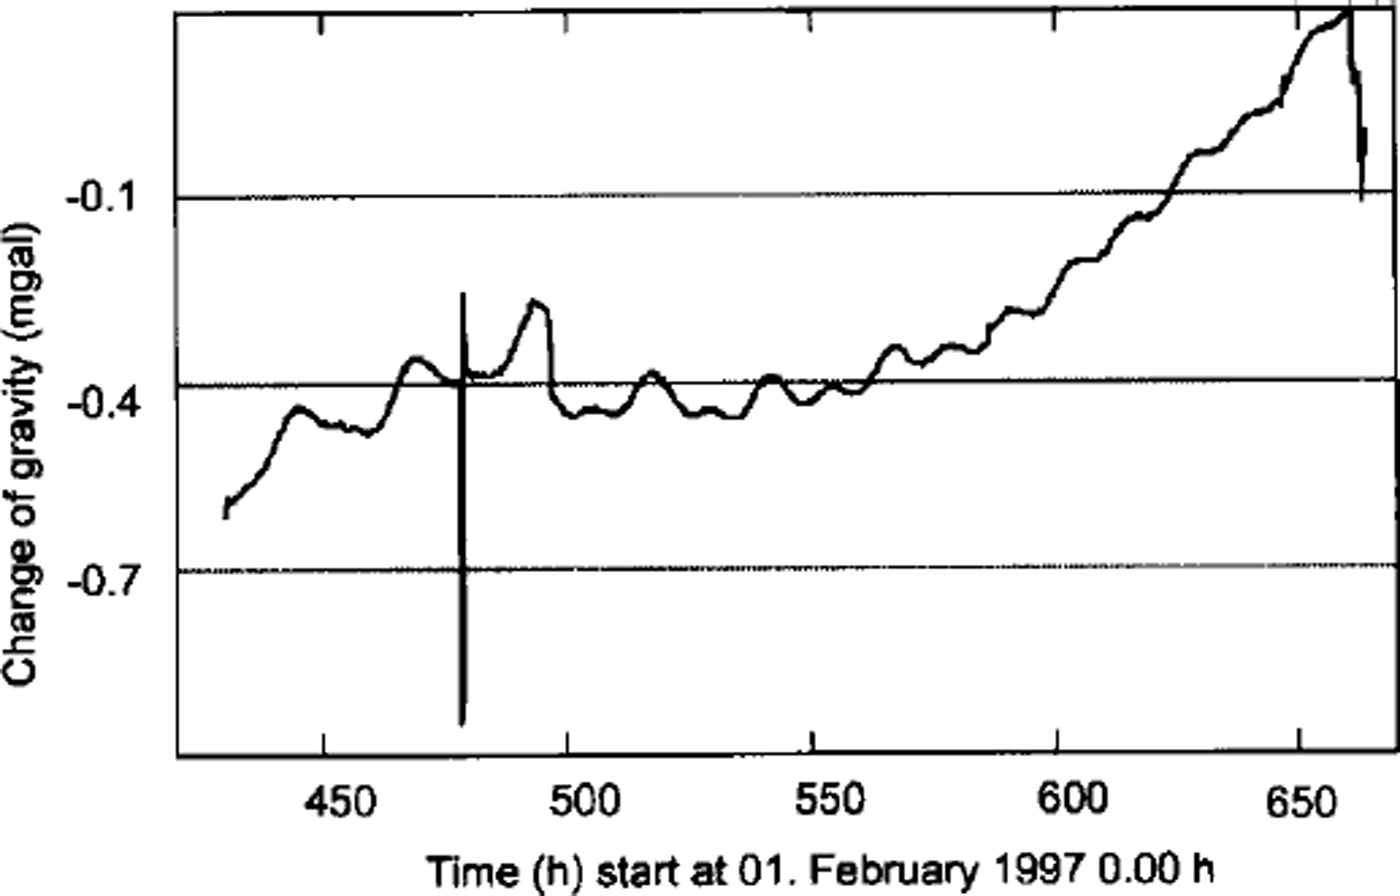
Fig. 2 Raw field data from gravity recordings at position km2.
These procedures resulted in continuous time series of 5-10 days for the gravimeter and tiltmeter data.
The processing of the GPS data started with static processing of position Al in relation to the reference field station in the Kottas mountains (Heimefrontfjella; 74° 18′S, 9°45′W; 1420 m a.s.l.). This reference station was 3 km south of the grounding line on grounded ice. The daily coordinate solutions for Al were used as the local base-station data, and the kinematic post-processing of the other GPS stations was carried out in relation to position Al. The flow velocity of position Al was addressed as a trend effect. All following processing steps were similar to the processing of the tiltmeter and gravity data (e.g. the filling of data gaps and removal of outliers).
The kinematic data-processing for all GPS stations provided coordinates for each antenna phase center in the three coordinate components. Figures 3 and 4 show the continuous time series for the three-dimensional movements of the 16 day dataset for station A3, situated on the ice shelf 3 km downstream from the grounding line. The tidal deflection shows maximum amplitudes of ±0.50 m for station A3.
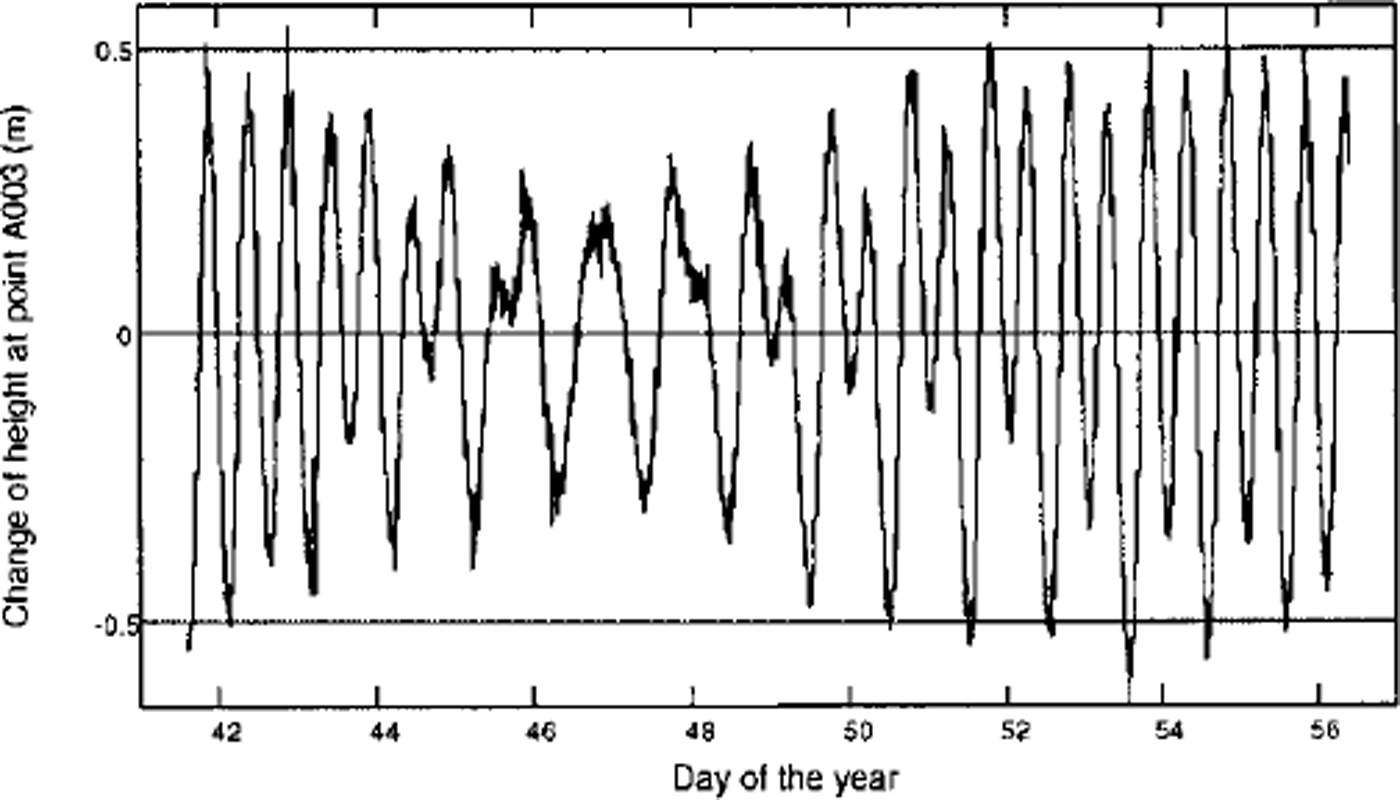
Fig. 3 Time series for the vertical movement of the antenna phase center for A3.
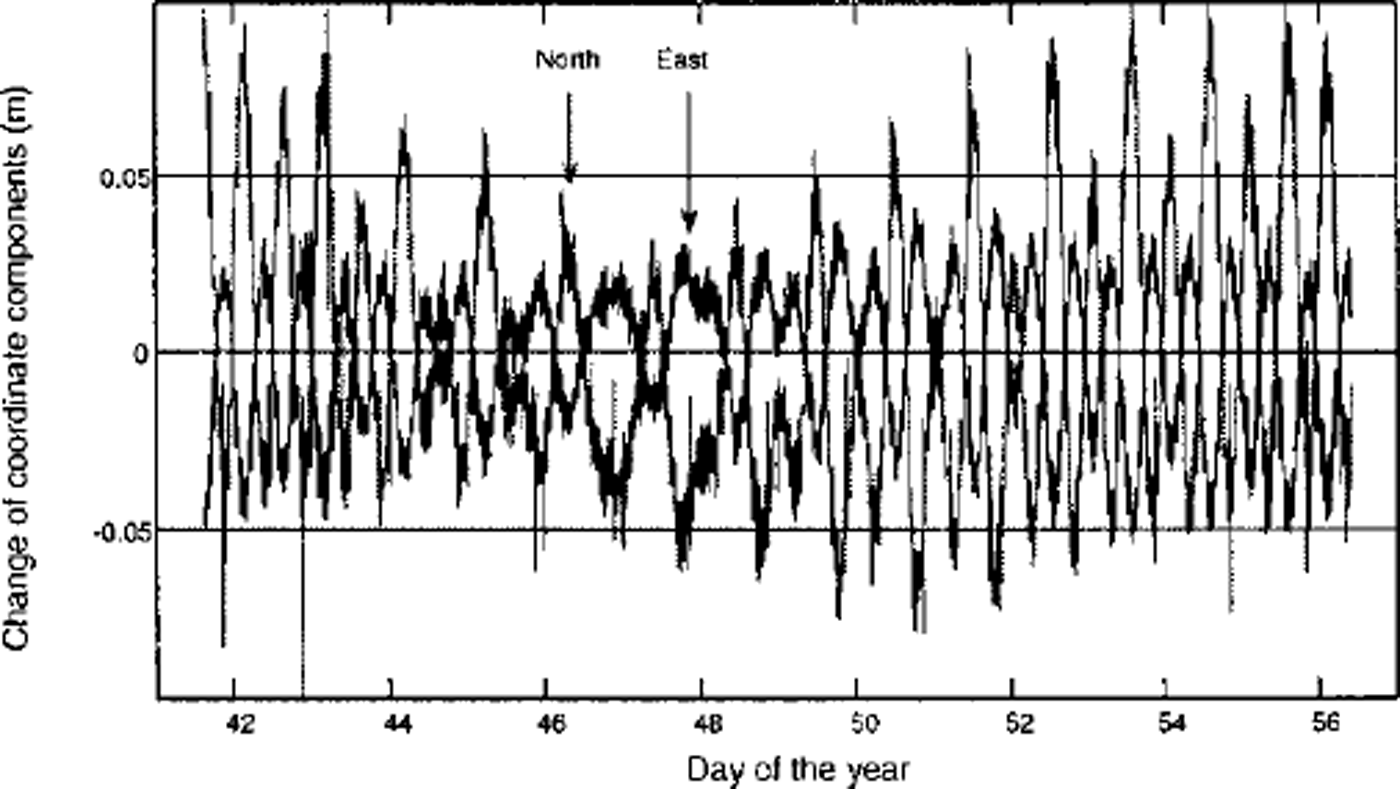
Fig. 4. Time series for the horizontal movement of the antenna phase center for A3.
According to Figures 3 and 4, it is obvious that tidal deflection in the case of high tide leads to a horizontal movement of the antenna towards the south. Low tide causes horizontal movement to the north. The third coordinate component also shows a tidally induced east-west movement. There is a high correlation between the vertical deflection and the horizontal movement during the tidal cycle. The same pattern was derived for station A2, located on the grounding line, with a maximum tidal deflection of ±0.15 m (Reference Riedel, Heinert and OerterRiedel, 1998). The shorter time series of 8 days for stations D100 and D200 yielded similar results. For position A4 we were unable to derive any tidal displacement from the processing of the kinematic GPS data.
The fast Fourier transform (FFT) was applied to the GPS, gravity and tiltmeter time series in order to derive amplitudes, frequencies and the phase of the ocean tides.
It was possible to derive the diurnal tides Kl and Ol and the semi-diurnal tides M2 and S2 for position A2, as well as for the other GPS sites, with the 16 day GPS dataset (Fig. 5). The FFTs of the shorter time series show fewer details. For instance, the 8 day series of the position km2 gravity data resolves one diurnal and one half-day tidal signal (Fig. 6).
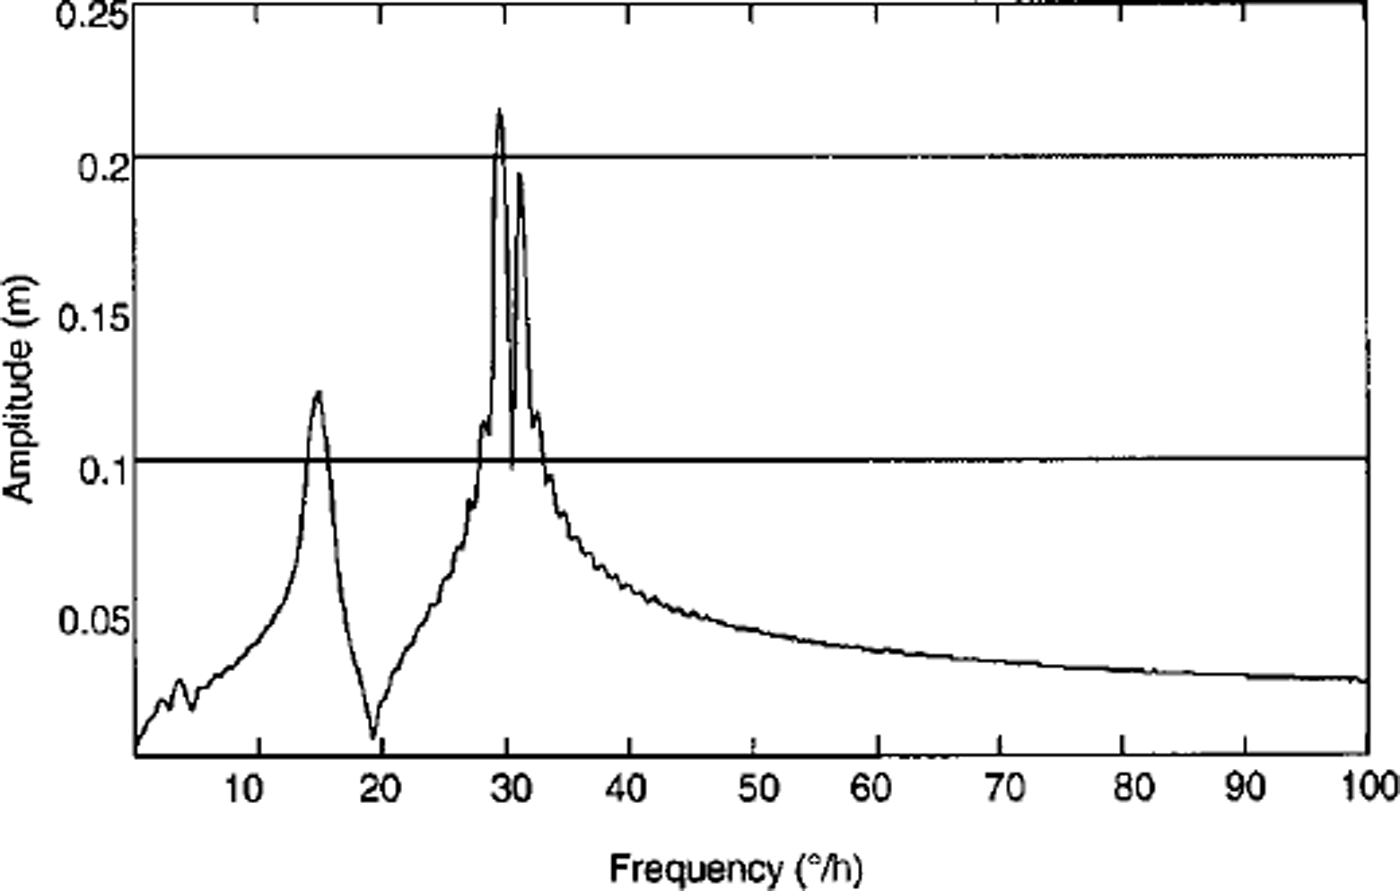
Fig. 5. Tidal spectrum for position A2.
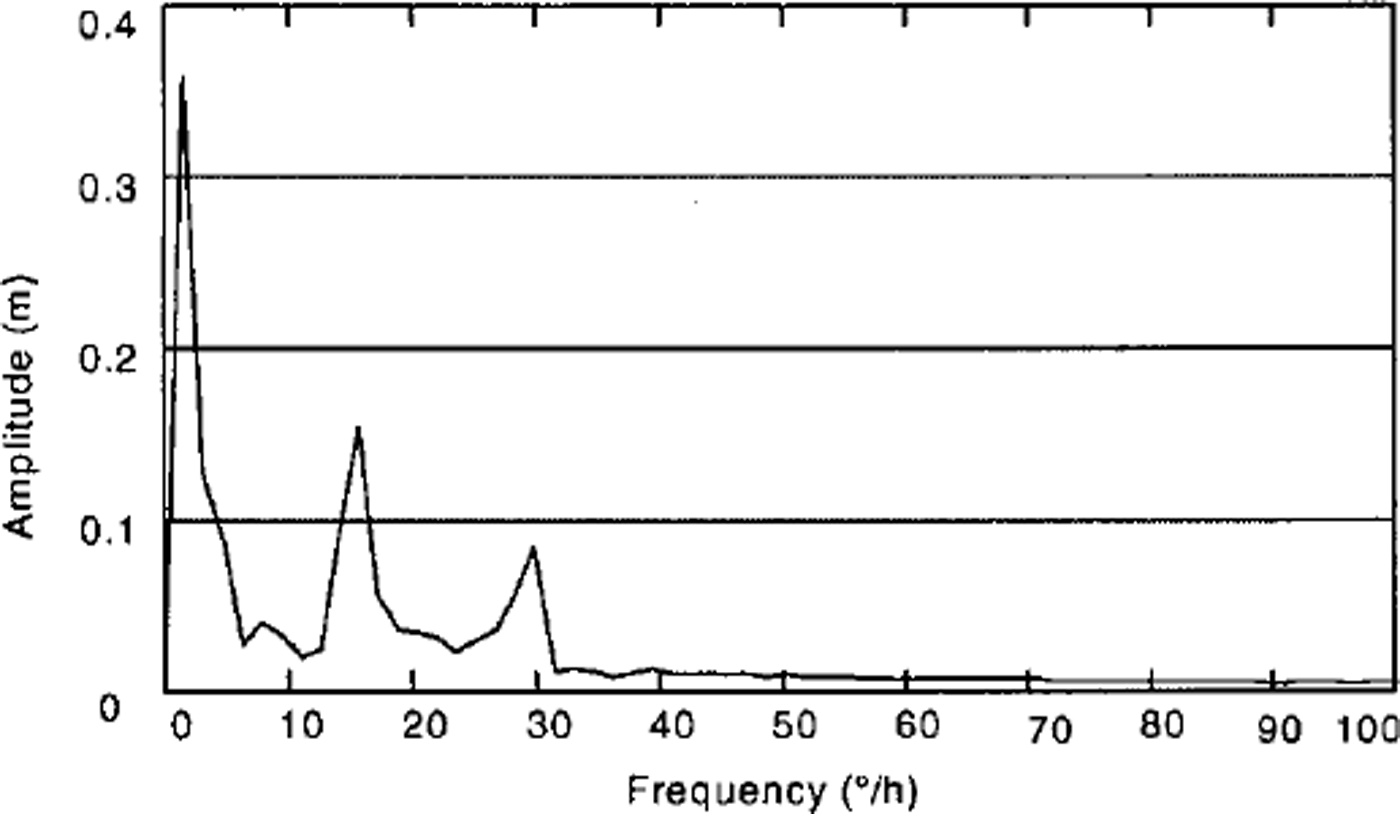
Fig. 6. Tidal spectrum for position km2.
The tidal signal for position km2 on grounded ice, 2 km south of the grounding line, has an amplitude that is as big as the signal amplitude that can be calculated for the Earth tides at this station with the program ETGTAB (Reference Timmen, Wenzel and SunkelTimmen and Wenzel, 1995). This implies that the observations in this snow pit were caused solely by the influence of the Earth tides on the grounded ice body.
Preliminary Results
Because the different tidal waves are well known from astronomical observations, the results of the FFT could be optimized by the application of a conditioned least-squares fit, resulting in a kind of harmonic analysis. The result of this analysis is the splitting of the signal into ocean and body tides. Table 1 shows the signal of the ocean tides for the different stations on the ice body. The results of this analysis are preliminary, because there is an unsolved difference between amplitudes from the GPS and gravity measurements for station A2. This difference could be accounted for by the differences in the length of the time series or by the difference between the geometrical displacement observed by the GPS and the tidally influenced water-mass movement between the bottom of the ice body and the bedrock in the grounding zone. An observed gravity signal at this position may not be caused by vertical displacement of an identical amplitude.
Table 1. Optimized amplitudes of the main ocean tidal wave
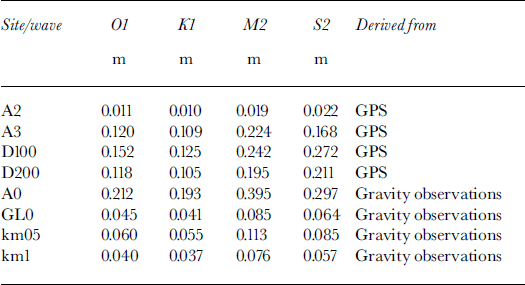
The data so far show a clear influence of the ocean tides on the ice movement at least up to 1 km south of the grounding line on grounded ice.
A comparison of the observed data at station A0 with the predicted data from a modified ocean tidal model for the Weddell Sea (Fig. 7) shows that the observed values are only 75% of the predicted values (Reference Robertson, Padman, Egbert, Jacobs and WeissRobertson and others, 1998). This means that tidal information from models cannot always be used to exactly describe the vertical tidal deflection of the grounding zone.
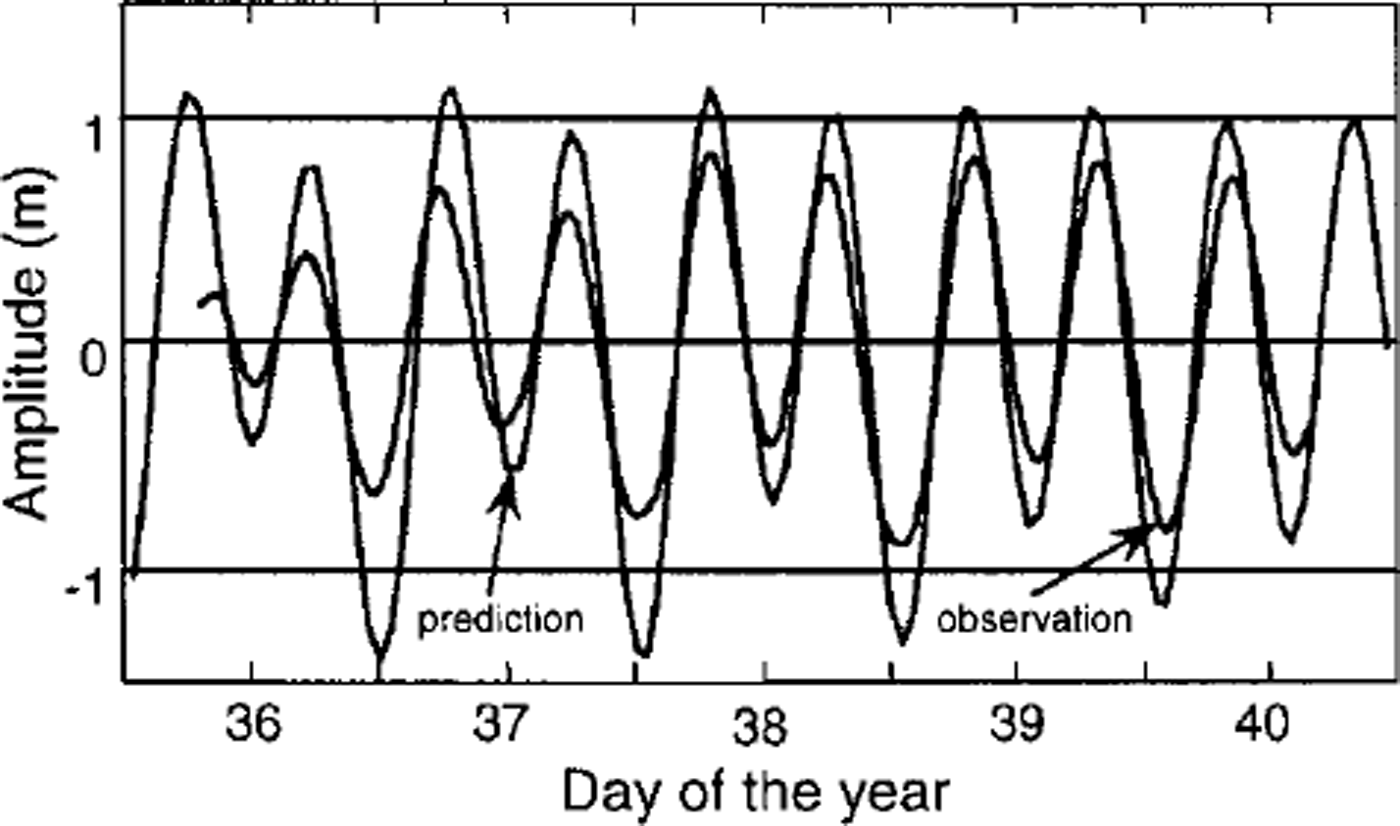
Fig 7. Observed and predicted data for station A0.
The method of analysis described enables us to calculate time series for every station and any period, especially for positions where we had no instruments or for time intervals where we had data gaps. These time series of tidal amplitudes, together with the tilt values, will be used for future mechanical modelling.
An example of differences between observed and modelled tiltmeter data is shown in Figure 8. In the model all significant tidal parameters have been considered. The maximum differences between modelled and observed tiltmeter data are < 3 µrad. This means that modelled and observed values are in very good agreement.
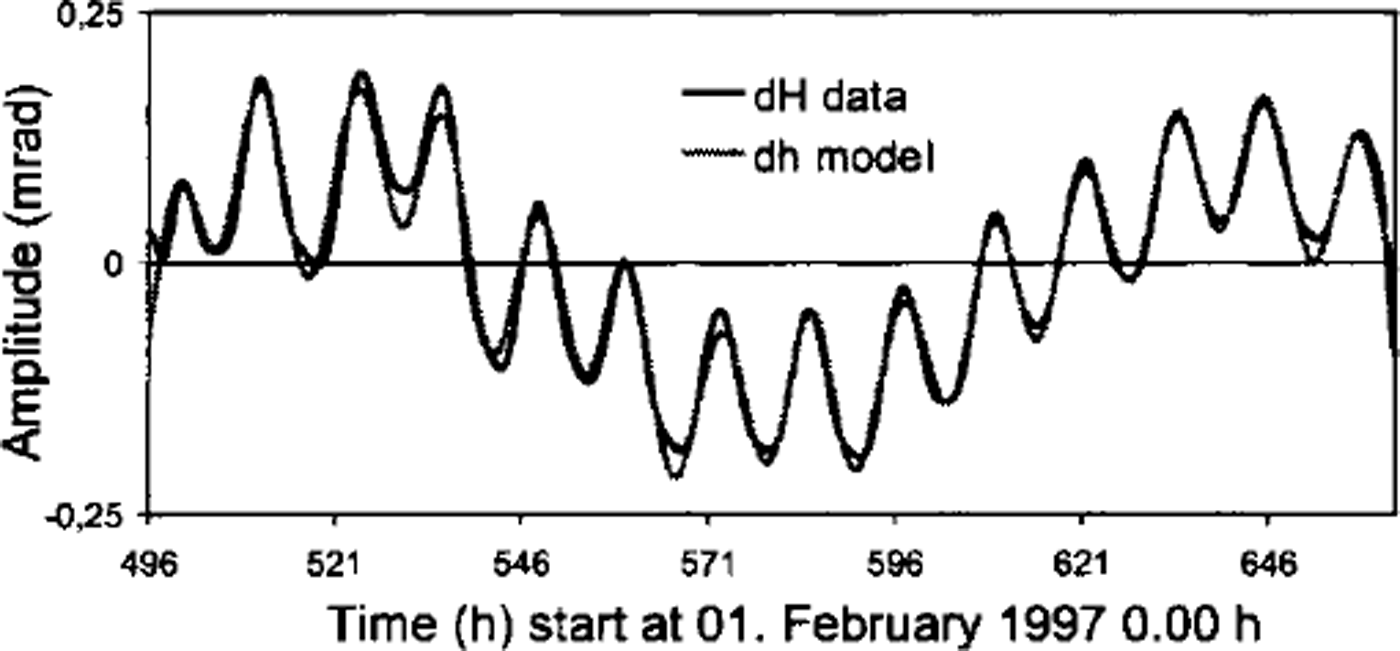
Fig. 8. Differences between modelled and observed tiltmeter data.
Conclusion and Outlook
The present study shows that it is possible to estimate the range of the ocean tides on the ice body and to derive the tidal deflection. This is also true for grounded ice. Using this information and other collected data, such as ice thickness and surface elevation, it is possible to build up an elasto-mechanical finite-element model for the Ekstromisen grounding zone. The combination of the time series of tidal amplitudes, the tilt values and the GPS positions results in a varying geometry of the ice body, i.e. the geometry vector. This derived geometry vector comprises the main input parameter for mechanical modelling using a finite-element method.
Further investigations need to be carried out with the aim of studying variations of Young’s modulus in relation to the ice thickness, ice-surface topography and tidal deflections.
Acknowledgements
The authors wish to express their gratitude to the Deutsche Forschungsgemeinschaft for financial support through grant Ri 766/2. We thank L. Erofeeva and L. Padman for the prediction of ocean tidal data for Ekstromisen, and an anonymous reviewer and K. Keller for their comments and suggestions which improved the manuscript.


