


Introduction
Cryoconite is an aggregate particle composed of inorganic debris cemented by biogenic material. Autotrophs (microalgae and cyanobacteria) dominate grain surfaces whereas heterotrophs favour the interior (e.g. Reference Takeuchi, Kohshima, Shiraiwa and KubotaTakeuchi and others, 2001a,Reference Takeuchi, Kohshima and Sekob; Reference HodsonHodson and others, 2010b). Light can penetrate a thin subsurface layer of cryoconite aggregates due to the translucence of quartz and certain other mineral particles (Reference HodsonHodson and others, 2010b). Photosynthetic biomass growth can therefore occur at and near the surface of each grain. This biomass growth directly influences the cohesion of inorganic material, thereby influencing the size, density and composition of cryoconite grains.
Since photosynthesis is restricted to a near-surface layer, the viable photosynthetic area will reduce drastically in accumulations of multiple grains due to the shielding of individual grains from incoming photosynthetically active radiation (PAR). However, heterotrophic activity can occur anywhere in the structure of a cryoconite grain. Therefore, layers of cryoconite with a thickness of several grains most likely favour net heterotrophy (Reference HodsonHodson and others, 2008). However, the potential for photosynthesis is increased in thinner layers of cryoconite due to a greater surface area being exposed to direct and scattered solar radiation. This could result in net autotrophy, especially in the case of small grains with a large surface-area:volume ratio.
The sediment arrangement in cryoconite holes may therefore be crucial in determining the net ecosystem productivity (NEP) within them. This relationship is poorly understood, a major oversight given that globally significant carbon transfers might be attributable to photosynthesis by cryoconite ecosystems (Reference Anesio, Hodson, Fritz, Psenner and SattlerAnesio and others, 2009). This may be the result of the common but misleading practice of normalizing carbon fluxes for sediment mass alone (e.g. Reference HodsonHodson and others, 2007, Reference Hodson2010b). Owing to self-shading effects, changes in the thickness of the sediment layer mean that the carbon flux of a cryoconite hole can change drastically, even when the mass of sediment remains constant.
In order to better estimate supraglacial carbon fluxes it is vital to understand the distribution of sediment depths across glacier and ice-sheet surfaces. This paper therefore aims to extend our limited knowledge of the regulation of sediment depths in cryoconite holes and to improve our understanding of the relationship between NEP and cryoconite area found within open cryoconite holes of the Arctic.
Field Site and Methodology
Fieldwork was undertaken on Feiringbreen and Vestre Brøggerbreen, Svalbard, in July 2006, the margins of the Greenland ice sheet near Kangerlussuaq in 2008 and 2010 and on Austre Brøggerbreen, Svalbard, in 2009. All the Svalbard sites were valley glaciers in the vicinity of Ny-Alesund, Kongsfjord (Reference Hagen, Liestøl, Roland and JørgensenHagen and others, 1993). Here individual, isolated cryoconite holes were studied in ablation areas at elevations between 100 and 300 m. At Kangerlussuaq in 2008, cryoconite holes were sampled at ∼560m during a field campaign described by Reference HodsonHodson and others (2010a) and Reference Irvine-Fynn, Bridge and HodsonIrvine-Fynn and others (2010). At Kangerlussuaq in 2010, samples were taken ∼ 2 km from the ice margin near Point 660 (67°09’05’’ N, 98°01’16’’ W). In all cases, well-developed holes with relatively uniform circular planforms were sampled during mid- to late summer, with the purpose of establishing their debris mass-area relationships. Sampling involved estimation of hole area using either a rule (circular holes) or image-processing methods (noncircular holes; see Reference Irvine-Fynn, Bridge and HodsonIrvine-Fynn and others, 2010) and evacuation of the entire cryoconite deposit for weighing after drying at 40°C (further details in Reference HodsonHodson and others, 2007). These data were combined with those from Reference HodsonHodson and others (2007) and Reference Bøggild, Brandt, Brown and WarrenBøggild and others (2010) to provide a more comprehensive debris mass-area dataset for discussion later in this paper.
Sediment-layer perturbations
In order to better understand the regulation of cryoconite thickness, two cryoconite holes on Austre Brøggerbreen were perturbed by injecting cryoconite sediment to approximately double the original volume (40 cm3 for hole 1, 80 cm3 for hole 2). Similarly four holes at Kangerlussuaq in 2010 were perturbed by injecting a range of sediment volumes. The response in the cryoconite hole dimensions was then monitored daily using calipers and a rule and without disturbing the sediment. The sediment thickness was also measured daily using the same rule, with minimal disturbance of the sediment layer. The resolution of the ruler is 1 mm. Since measurements were taken at the bottom of cryoconite holes, measurements can only be estimated to ± 1 mm error. Control holes were also measured at both locations, for which no additional sediment was added.
Net ecosystem carbon balance
The light incubation method was used to demonstrate the impact of sediment thickness upon net ecosystem carbon balance. The precise details are given by Reference TellingTelling and others (2010). Briefly, cryoconite was collected from holes upon Austre Brøggerbreen (2009) and Kangerlussuaq (2010) and added to 60 mL Wheaton glass bottles to give 1–8 mm sediment depths. All bottles were filled completely with in situ supraglacial water to give approximate sediment:water ratios of 1 :60. The bottles were left to be illuminated by ambient light for 24 ± 2 hours. Changes in the dissolved inorganic carbon (DIC) were then attributed to net ecosystem production (i.e. the difference between primary production via photosynthesis and respiration) after correcting for carbonate dissolution following the procedure of Reference HodsonHodson and others (2010b). The DIC of the solutions was estimated immediately using the headspace method described in Reference HodsonHodson and others (2010b). Net ecosystem production was derived from the decrease in CO2.
Results
Figure 1 shows the debris dry-mass-area relationships for cryoconite holes at seven sites distributed across Svalbard and Greenland, including new and previously published data. A linear relationship between cryoconite mass and hole area clearly existed at each of these sites, although its gradient varied strongly from 0.036gcm−2 at one site in Kangerlussuaq (from 2010) to 0.21 gcm−2 at another Kangerlussuaq site (in 2008) (Table 1; Fig. 1).
Table 1. Linear trend line gradients and coefficients of determination for each of the datasets in Figure 1 . Site names are described in the caption for Figure 1

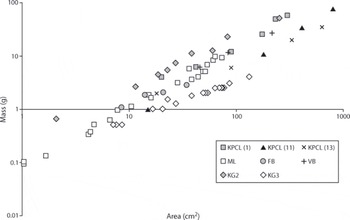
Fig. 1. Cryoconite debris mass–area relationships in holes. Lines represent linear regression models, the slopes of which are shown in Table 1 . The sites are Feiringbreen (FB: six holes), Midtre Lovénbreen (ML: 34 holes described by Reference HodsonHodson and others, 2007) and Vestre Brøggerbreen (VB: three holes) in Svalbard, and Kangerlussuaq blue-ice zone (KG2: 11 holes; KG3: 19 holes) and Kronprins Christians Land (KPCL stakes 1 , 11 and 13: 13 holes described by Reference Bøggild, Brandt, Brown and WarrenBøggild and others, 2010) on the Greenland ice sheet. A log–log scale has been used to show the full range of the data, not to linearize the relationship between the two variables.
Figure 2 shows the effects of sediment addition to two cryoconite holes on Austre Brøggerbreen. A control (hole 3) is included which was not perturbed artificially. The perturbed holes expanded immediately and rapidly following sediment perturbation, with hole 1 (smaller cryoconite volume) attaining a new equilibrium state after only 4 days. This state approximated a single layer of cryoconite aggregates, so no further widening was possible. Owing to meltwater stream invasion of hole 2, which had a higher cryoconite volume, measurements ceased before a new equilibrium radius could be achieved. However, the radius of both holes approximately doubled following an approximate doubling of sediment volume. In Kangerlussuaq (2010), sediment was added following the same methodology as for Svalbard, and a resultant lateral expansion was again observed (Fig. 3). Again, expansion immediately followed sediment addition, and severe undercutting was noticed in the vertical profile of the cryoconite hole (Fig. 4). The sediment-layer thickness also decreased simultaneously with the widening of the cryoconite hole, reaching minimum values of ∼1 mm (Fig. 5).

Fig. 2. The effect of sediment perturbation on cryoconite hole diameter upon Austre Brøggerbreen, Svalbard.

Fig. 3. The effect of sediment perturbation on cryoconite hole diameter upon the Greenland ice sheet, 2 km from the ice margin, near Kangerlussuaq.

Fig. 4. Undercutting of the vertical profile of cryoconite holes following sediment injection. (a) Photograph showing undercutting on far side at base; (b) two-dimensional schematic of the hole photographed in (a), showing an expanded hole width following sediment injection (1) and the relict pre-perturbation profile which is soon to be removed by surface ablation (2).

Fig. 5. Daily measurements of sediment-layer thickness for the perturbed holes upon the Greenland ice sheet near Kangerlussuaq (2010). Note that these measurements are estimated to within ±1 mm.
Figure 6a-c show the net ecosystem carbon balance of the different cryoconite debris thicknesses at austre Brøggerbreen and for two sites at Kangerlussuaq. There is a clear change from net heterotrophy (i.e. negative values representing carbon flux out of the system due to community respiration) to net autotrophy (positive values representing carbon flux into the system due to carbon fixation by photosynthesis) at debris thicknesses less than 3 mm for Austre Brøggerbreen and one site at Kangerlussuaq and 2 mm for the second Kangerlussuaq site. There is some indication that net heterotrophy is greatest at intermediate sediment thicknesses for one Kangerlussuaq site (Fig. 6b), but this pattern did not occur at Austre Brøggerbreen (Fig. 6a) and is unclear for the second Kangerlussuaq site (Fig. 6c). However, all three datasets show that the relationship between net ecosystem production and sediment thickness is certainly nonlinear.

Fig. 6. Total DIC changes in cryoconite samples of different thicknesses incubated in light flasks for (a) one site on Austre Brøggerbreen and (b, c) two sites near Kangerlussuaq. Positive values indicate net photosynthesis, whilst negative changes indicate net respiration. The incubations involved cryoconite samples from Vestre Brøggerbreen and were conducted with a supraglacial meltwater medium over the course of 2days upon the glacier surface. Full details of this procedure and the total DIC used to assess the carbon changes are given by Reference TellingTelling and others (2010) and Reference HodsonHodson and others (2010b).
Discussion
Table 1 shows that strong linear relationships between cryoconite area and mass were typical upon Svalbard glaciers and the Greenland ice sheet. This observation implies that near-uniform cryoconite layer thicknesses exist within well-developed cryoconite holes (Fig. 1). Similarly, our sediment-thickness perturbation experiments (Figs 2 and 3) ended when an artificially thickened layer of sediment in an existing cryoconite hole widened to approximate a uniform single grain layer. Therefore, some mechanism of expansion must act to establish a constant sediment-layer thickness following the addition of new cryoconite. The undercutting of the vertical wall profile in the holes (Fig. 4) almost certainly indicates that lateral thermal conduction was responsible for the widening of the hole. Therefore, like the depth equilibration described by Reference GribbonGribbon (1979), wherein holes melt into the ice until the melt rates of the hole base and its surrounding ice are equal, there is also a width equilibration process operating concurrently. This process is most likely triggered by the arrival of new sediment into a cryoconite deposit and its impact upon the absorption of solar radiation within the hole. Field observations suggest that the release of air bubbles from newly melted ice beneath the sediment layer may provide a mechanism for sediment rearrangement, such that cryoconite is redistributed continuously to fill the available floor space. In Kangerlussuaq, holes were perturbed with larger sediment volumes; however, the increase in hole diameter was not in proportion to the volume of sediment. This may be due to the weight of the sediment preventing rapid redistribution via escaping air bubbles, possibly forcing more air through thinner areas of sediment and leading to a less uniform single grain approximation. Alternatively, more time may simply have been required for the larger volumes of sediment to properly redistribute. It is also possible that the identification of a single grain layer was less accurate in Kangerlussuaq due to greater hole depths. The widening of cryoconite holes that we report here also suggests that treatment of the thermodynamic equilibration process as a three-dimensional problem (rather than in two dimensions, as described by Reference GribbonGribbon’s (1979) pioneering work) might be most appropriate for understanding how abiotic conditions influence the propagation of PAR to the debris surface.
Inter-site variability
Table 1 reveals significant site-to-site variations in the slope of the mass-area relationship depicted by Figure 1. Increasing the mass of cryoconite present in a cryoconite hole leads to a linear increase in cryoconite hole area; therefore, the thickness of the sediment within the hole appears constant. Owing to the tendency for this constant thickness to be a single grain layer arrangement formed by hole equilibration, variations in the slope of mass-area relationships must be controlled by grain size and/or density at each specific site. For example, by applying a typical value for cryoconite dry density of 1.5 gcm−3 to the data in Table 1, a sediment-layer thickness can be calculated for the massarea relationship of each site. This provides sediment-layer thicknesses of 0.4–4.0 mm, a range that is consistent with the few measurements of grain sizes that are available. For example, grain diameters measured across a 70 km transect of the Greenland ice sheet were 2.59 ± 1 . 5 4 mm (J. Cook, unpublished data), whilst Reference Takeuchi, Nishiyama and LiTakeuchi and others (2010) report a range 0.27–3.5 mm on Urumqi glacier No. 1, China. Additionally, organic matter content can reduce the density of cryoconite aggregates and thus influence the mass-area ratio. However, loss-on-ignition analyses of cryoconite samples indicate that values vary from 5% to 16% (e.g. Reference HodsonHodson and others, 2010a), a range that is far less significant than that of the grain size. As a result of this limited range, no significant correlation between the slope values in Table 1 and the average per cent organic matter was found. Aggregate grain-size distribution is therefore the most likely first-order control upon the slope of the different relationships depicted in Figure 1. However, aggregate grain size and organic matter might be intricately linked, because biological processes are critical for ‘gluing’ the constituent particles together (Reference HodsonHodson and others, 2010b; Reference Takeuchi, Nishiyama and LiTakeuchi and others, 2010).
Promoting primary production
It has been postulated that cryoconite holes provide habitats for complex ecosystems underpinned by rates of photosynthesis that contribute significantly to the global carbon cycle (Reference Anesio, Hodson, Fritz, Psenner and SattlerAnesio and others, 2009). Autotrophy in cryoconite holes is dominated by the photosynthesis of algae and cyanobacteria, which occurs around the surface of the cryoconite grains (Reference HodsonHodson and others, 2010b). Photosynthesis requires PAR receipt from insolation, so an increase in cryoconite hole width maximizes the radiation receipt at the hole bottom and therefore promotes primary production. A single grain layer represents the maximum feasible surface area for PAR receipt within the hole and a minimum state for self-shading by overlapping grains. Figure 6a–c demonstrate that such a layer is very likely to maximize the capacity of the cryoconite hole to fix CO2 following photosynthesis. The arrival of debris into a pre-existing cryoconite hole is therefore expected to result in a shift in favour of net heterotrophy and a destabilization of the sediment arrangement. Sufficient sediment-layer widening/thinning will re-equilibrate both the sediment arrangement and ecosystem productivity, shifting the ecosystem back toward net autotrophy. Whether net heterotrophy is actually attained depends upon the light regime and the diameter of the aggregates involved. Similarly, newly formed cryoconite holes which may have developed from thick stream deposits (e.g. on Midtre Lovénbreen; Reference HodsonHodson and others, 2007) are likely to exhibit net heterotrophy until lateral expansion re-equilibrates their net ecosystem productivity.
It appears that the attainment of an equilibrium state results in the maximization of primary production via photosynthesis and thus the acquisition of new biomass upon the glacier. It is therefore interesting to speculate whether this biomass growth increases the volume :area ratio of the grain, resulting in older larger cryoconite granules that become net heterotrophic as respiration in their dark interior exceeds photosynthesis upon their surface.
Conclusions
This study has demonstrated the existence of a linear relationship between cryoconite debris mass and hole area upon melting glacier surfaces, indicating a constant sediment-layer thickness for each site. We found that this is best explained by the equilibration of cryoconite holes due to lateral heat conduction. The result is the eventual thinning of the debris layer to a single grain layer the thickness of which is governed largely by the grain sizes within the hole. However, these grains are composites of organic and inorganic debris, so it is important to assess how biological processes control grain size. Light incubations show that the thinner debris layers are characterized by significant rates of photosynthesis, acquiring new biomass and therefore increasing the grain size. Further, the photosynthesis is actively promoted by the width equilibration process, because as the debris layer thins, there is less self-shading by the autotrophs and a lower volume of dark sediments within the grains that promote heterotrophic carbon production during respiration. The carbon balance of supraglacial ecosystems is therefore intricately linked to debris supply and its influence upon thermodynamic equilibrium when debris deposits of different thickness are created.
Acknowledgements
J. Cook acknowledges his UK National Environment Research Council (NERC) Doctoral Training Grant (No. NE/G524152/1), A. Hodson his Leverhulme Trust Research Fellowship (No. RF/4/RFG/2007/0398), a Royal Geographical Society Peter Fleming Award and funding from the UK National Geographic Committee for Research and Exploration. All authors acknowledge NERC grant NE/G006253/1 (to A. Anesio).


