


Introduction
Annual or periodic changes in temperature and precipitation in glacial regions can be detected from mass-balance and snowline measurements. If there is a change in regional climate trend, evidence from glaciers may directly reflect adaptations to such climate changes. Previous research has shown that small glaciers are not only sensitive to climate change but are also easy to observe and study. Ürümqi glacier No. 1 (UG1) is located in the headwaters of the Ürümqi river (43˚05’ N, 86˚49’ E), Tien Shan, about 120 km southeast of Ürümqi, China (Fig. 1). It has the longest monitoring record of any glacier in China, covering the period 1958–2003. It is a small valley glacier with two branches, east and west. Due to glacier retreat, these two branches became separated into two small independent glaciers in 1993. The length and area of the glacier have respectively decreased from 2.40 and 1.95 km2 in 1962 to 2.20 and 1.72 km2 in 2003, with an elevation of 3740– 4486 m a.s.l. The average ice thickness determined from the radar measurement in the early 1980s is about 55 m (Reference Zhang, Zhu, Qian, Chen and ShenZhang and others, 1985). Meteorological data have been collected since 1958 at the Daxigou meteorological station, located at 3540ma.s.l., about 2 km downstream of UG1 (Fig. 1). The mean annual temperature and precipitation are –5.1˚C and 450 mm, respectively. The Tien Shan glaciological station has recorded glaciological observations from 1958 to the present day. UG1 has shown obvious changes in mass balance, equilibrium-line altitude (ELA), glacier dimensions (length, thickness, area and volume), flow speed etc., reflecting the response of this and other glaciers in the Tien Shan to climate change during the past 45 years.

Fig. 1. Location of Ürümqi glacier No. 1 (UG1) and Daxigou meteorological station.
Recent Variation of Ürümqi Glacier No. 1
Glacier mass balance is an important index of a glacier’s response to climate change. Climate change can lead to changes of glacial accumulation and ablation, and potentially influence the advance or retreat of the glacier terminus. Glacier mass balance has been calculated using contour maps of accumulation and ablation, data measured at a permanent stake network (about 50−80 stakes in nine to ten rows on the glacier) and additional snow pits (You and others, 1998; Reference Li, Han, Jing, Yang and JiaoLi and others, 2003). The annual net accumulation, ablation and ELA have also been determined. The mass-balance data are available from 1959 to 2003. The glacier length and area have been determined using glacier maps from 1962, 1964, 1973, 1980, 1986, 1992, 1994, 2000 and 2002. The retreat of the glacier terminus is directly measured every year. The glacier ice thickness or glacier bed altitude was measured by radar and verified by borehole data in 1981 (Reference Zhang, Zhu, Qian, Chen and ShenZhang and others, 1985). Annual mass balance varies between 375 and 860 mm during the period 1958–2003 (Reference Xie and GeXie and Ge, 1965; Reference ZhangZhang, 1981; Reference Jiao, Wang and HanJiao and others, 2000; Tien Shan glaciological station, 2002; Reference Li, Han, Jing, Yang and JiaoLi and others, 2003). Glacier mass balance has decreased in the last 45 years, especially in the most recent 25 years (Fig. 2). During the last 45 years, a negative mass balance has existed in 30 years and a positive mass balance in 15 years. During the 25 year period 1978–2003, a positive mass balance appears in only 5 years, and the mass loss of UG1 represents 86% of the total over the past 45 years, with 52% of this loss occurring in the last decade. The five years of most negative mass balance (>790 mm) all occurred after 1997. The cumulative mass balance reached –10 032mm over the study period, equivalent to a glacier thinning of 11.1 m (20% of average glacier thickness).
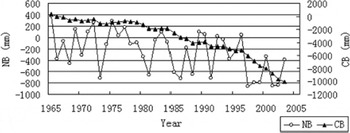
Fig. 2. Annual net mass balance (NB) and cumulative mass balance (CB) of UG1.
The flow speed of the glacier has been measured since 1959. Triangular surveying was done with a theodolite before 1985, a range finder during the period 1986–95 and the global positioning system (GPS) from 1996. Data were also measured at the permanent stake network, enabling mass-balance calculations. The flow speed for 1960, 1961 and 1962 was 21.30, 29.23 and 31.48 ma−1 , respectively (Reference ZhangZhang, 1965). From August and September 1973 the flow speed of the glacier was measured (Reference Wang, Liu, Luo and YouWang and others, 1976) and it was calculated to be 5.48 and 10.32 ma−1 for the east and west branches respectively (Reference Huang and SunHuang and Sun, 1982). Since 1980, continuous and systematic observations of glacier flow speed have been performed. Due to the terrain and surface slope of the glacier, the west branch has a larger flow speed than the east branch (Fig. 3), and due to continued glacier shrinkage these two branches became separated into two small independent glaciers with a consequent sudden increase in flow speed in 1993. The speed of glacier flow is otherwise shown to be gradually decreasing, especially since 1994. The flow speed of the east and west branches of the glacier has decreased over the period 1980–2003 by about 2 1% and 43%, respectively. Such trends are completely consistent with trends in glacier mass balance. During the period 1958–2003, the mean glacier thickness decreased by 11.1 m (20% of average glacier thickness). As we know, the flow speed of the ice surface is directly proportional to the glacier thickness, and a change in thickness will have a strong influence upon flow speed, so we can expect a corresponding decrease in glacier flow speed.

Fig. 3. Flow speed of UG1.
Since the 1960s, UG1 has been mapped nine times using large-scale cartography, table topography (1962), ground photography (1973, 1980, 1986 and 1994), air photography (1964 and 1992; Reference Chen, Liu and JinChen and others, 1996) and GPS (2000, 2002). Additionally, since 1980 the location of the glacier terminus has been measured every year, providing reliable proof of dimensional changes in the glacier. During the period 1962–2003 the glacier terminus retreated by 180.3m (7.5%), with a mean retreat of 4.4 m a−1 (Fig. 4). The retreat speed was 5.96ma−1 in 1963, 3.33ma−1 in the 1970s, 3.73ma−1 in the 1980s, and 4.61ma−1 in the 1990s. Figure 4 shows that the glacier has always been in retreat and that the retreat speed increased in the 1980s and 1990s. Due to the retreat of the glacier terminus, the east and west branches of the glacier separated completely to become two small glaciers in 1993. The retreat speed of the west branch terminus apparently quickens more than that of the east branch, for the following reasons: (1) the west branch is of smaller dimensions than the east branch, and so is more sensitive to climate change; (2) the area of the firn basin (accumulation area) of the west branch is smaller, i.e. the glacier accumulation is less; and (3) the underlying topography of the west branch terminus is an abrupt ice ridge, which causes the ice not only to thin, but also to break up more easily. Changes in glacier area can be calculated using a series of large-scale maps of UG1 (Fig. 5). The area of the glacier decreased by 0.23 km2 (11.8% of the area in 1962) from 1962 to 2002. Furthermore, the mean ELA of the glacier is about 4056 m a.s.l. over the period 1958–2003. The ELA has moved up 37m due to climate warming. This rise is most noticeable since 1997, when it is above 4050 m a.s.l., with a mean of 4110 m a.s.l.

Fig. 4. Rate of retreat of the UG1 terminus.

Fig. 5. Variation in area of UG1.
The seasonal regime of monthly temperature and precipitation is shown in Figure 6 for the period 1958–2003. Monthly mean temperatures are –13 to –16˚C in winter months (December–February) and 3–5˚C in summer months (June–August). Trends in monthly temperature from February to May show an increase, and the warming trend in June, July, September and November is statistically significant at the 95% confidence level. However, March and April became slightly cooler by about 0.3–0.9˚C over the study period. As a result of the warming in most months, annual mean temperature has increased by about 0.8˚C over the last five decades. Temperature changes are particularly strong since 1997. For example, summer (June–August) mean temperatures are 3.0–4.6˚C during the period 1958–96, and 4.4–5.8˚C since 1997, indicating a step increase of 1.0˚C since 1997 (Fig. 7). This corresponds with a cumulative mass-balance increase of >400 mm since 1997 (Fig. 2), indicating that the glacier mass balance is sensitive to temperature change.

Fig. 6. Mean monthly temperature and precipitation at Daxigou station, 1958–2003.

Fig. 7. Annual and summer air temperature at Daxigou station, 1958–2003.
The monthly precipitation regime is also depicted in Figure 6. It shows that the monthly precipitation varies from 2 to 50 mm during the winter half of the year (September– May), whereas the summer months are relatively wet, with precipitation peaks of 97 and 118 mm in July and August, respectively. Snowfall dominates the type of precipitation, with only 17% of precipitation in the warmest month of July being rainfall. Statistically, annual total precipitation has increased significantly by 19% (87 mm) over the last few decades. Annual precipitation has increased since 1987, along with the year-to-year variability. The difference in mean annual precipitation between the periods 1959–87 and 1988–2003 is 76 mm, or 17% of the entire record (Fig. 8). Summer precipitation is negatively correlated with mass balance and positively associated with runoff. These relationships, although very weak statistically, are reasonable, as higher precipitation leads to higher runoff and lower glacier melt (Reference Yang, Jian, Zhang and KangYang and others, 1988; Reference Liu, Xie and DyurgerovLiu and others, 1998). Similarly, summer temperature is negatively correlated with mass balance and positively associated with runoff, as higher temperatures lead to higher glacier melt and thus higher runoff.

Fig. 8. Annual precipitation at Daxigou station, starting in 1960.
Conclusion
This study has analyzed long-term climate and glacier records to determine glacier response to climate change over the past 45 years in the Ürümqi river. The cumulative mass balance is –10 032 mm, equivalent to 11.1 m of glacier ice, or 20% of the glacier volume. The mass balance of UG1 has been shown to be sensitive to temperature change. The glacier flow speed has gradually decreased, especially since the 1980s. The flow speed of the east and west branches of the glacier decreased by about 21% and 43%, respectively, from 1980 to 2003. The glacier continuously retreated from 1962 to 2003. Its length and area have decreased by about 180 m (7.5%) and 0.23 km2 (11.8%), respectively.
Summer precipitation is negatively correlated with mass balance and positively associated with runoff. These relationships are reasonable, as higher precipitation leads to higher runoff and lower glacier melt. On the other hand, summer temperature is negatively correlated with mass balance and positively associated with runoff, as higher temperatures lead to higher glacier melt and thus higher runoff. The summer temperature controls glacier mass-balance variation. It is important to note that, over the past 45 years, the negative mass balance, caused by higher ablation than accumulation, is associated with both a precipitation increase and temperature warming over the study area.
Acknowledgements
This research is supported by the Centurial Program (2004401) and the National Nature Science Foundation of China (90202013), the Innovation Research Project (KZCX3-SW-339–3) of the Chinese Academy of Sciences, and the National Basic Research Program of China (2005CB422003). The manuscript was improved by suggestions from two anonymous reviewers. We thank P. Mayes for improving the English.


