


Introduction
To test the behaviour of alpine snow under shear is one of the key experiments to understand slab-avalanche formation. Of particular interest are the failure characteristics in relation to snow type, rate of loading and snow temperature. This study investigates the effect of the latter two above parameters on strength, toughness and stiffness of natural alpine snow samples tested with a direct simple-shear apparatus in a cold laboratory.
Previous testing in shear under laboratory conditions has been done by Reference FuchsFuchs (1949), Reference Ballard, Feldt and TothBallard and others (1965), Reference McClungMcClung (1977), Reference De Montmollinde Montmollin (1982) and Reference Fukuzawa, Narita. and Armstrong.Fukuzawa and Narita (1993). Reference McClungMcClung (1977) and dc Montmollin (1982) used natural samples from an alpine snowpack. Reference McClungMcClung (1977) studied the effects of snow type, loading rate and normal load using a direct simple-shear apparatus. In particular, he observed strain-softening; strain rates were rather low between 1.5 × 10⁻⁴ s−1 and 2.1 × 10⁻⁶ s−1. Reference De MontmollinDe Montmollin (1982) performed tests for a wider range of shear rates, including fast tests leading to sudden fracture (brittle failure); he concentrated on the explanation of the stress-strain behaviour by fast metamorphism of the bond system (age-hardening) during the tests. Reference Fukuzawa, Narita. and Armstrong.Fukuzawa and Narita (1993) showed that snow behaves similarly in shear as in tension, as shown by the pioneering work of Reference NaritaNarita (1980). In addition, they also prepared layered samples to study the performance of a so-called weak layer. From these studies (and others in tension or compression), it is known that snow strength is in general highly rate-dependent; strength substantially decreases with increasing strain rate and the failure mode changes from ductile to brittle.
In addition to laboratory testing, substantial work has been done to test snow layers in situ (Reference RochRoch, 1966; Reference PerlaPerla, 1977; Reference FöhnFöhn, 1987; Reference Brun and Rey.Brun and Rey, 1987; Reference JamiesonJamieson, 1995). Shear frames of different sizes were mainly used for the field tests involving rapid but less-controlled loading. Recently Reference Föhn and Camponovo.Föhn and Camponovo (1997) instrumented a shear frame, measured the displacement during tests and calculated the strain rates. Field tests (rapid loading) in general reveal low strength values of the order of 1 kPa or even less. These fast tests seem to correspond well to the fast loading processes during artificial triggering, e.g. by skiers (Reference Schweizer, Camponovo., Fierz, Föhn. and Sivar-dièreSchweizer and others, 1995).
The temperature effect on hardness, sintering, compressive and tensile strength of snow has been studied by, e.g. Reference BucherBucher (1948), Reference Mellor and Smith.Mellor and Smith (1966), Reference Ramseier and Sander.Ramseier and Sander (1966), Reference RochRoch (1966), Reference GowGow (1975), Reference TusimaTusima (1975), Reference SalmSalm (1971), Reference HaynesHaynes (1978) and Reference NaritaNarita (1983). Most work shows that the mechanical properties of dry snow are in general sensitive to temperature and that hardness and strength decrease with increasing temperature. However, the amount of change for the temperature range relevant for slab-avalanche release (the time-scale has also to be considered) seems to be controversial (Reference McClungMcClung, 1996).
Methods
Test Apparatus
Shear tests were performed in the cold laboratory at Rogers Pass (British Columbia, Canada) with the refurbished Norwegian direct simple-shear apparatus (Reference Bjerrum and Landva.Bjerrum and Landva, 1966) that was previously used by Reference McClungMcClung (1977) (Figs 1 and 2). The snow samples (115 mm in diameter, 16–18 mm in height) are held between two plastic caps with rough surfaces to prevent slip, surrounded by a wire-reinforced rubber membrane. The membrane prevents any diameter change but allows thickness changes of the sample during the test. This set-up gives plane-strain conditions. However, the stress state is not completely known and the membrane impedes detailed observation of the sample during the test. The top cap is fixed horizontally but can move vertically and takes the normal load which is applied by a weight. The bottom cap is completely fixed to a sledge that is moved horizontally by a motor to induce the shear deformation. The exchangeable motor fixed to the gear box turns at a constant rate. Six different motors were used (Table 1) covering approximately a range of strain rates between 7 × 10⁻⁶ s−1 and 5 × 10⁻³ s−1. Vertical and horizontal displacement of the sample are measured with two linear-displacement trans-ducers. The applied horizontal force is determined by strain gages measuring the deformation of a calibrated proving ring. Data acquisition is computer-controlled. Due to instrumentation and software limitations, the maximum possible scan frequency was only 10 Hz, which proved to be partly insufficient for the fast tests.

Fig. 1. Schematic of direct simple-shear apparatus: (1) snow sample, (2) caps, (3) membrane. (4) horizontal force, (5) normal force, (6) force gauge. (7) vertical displacement transducer, (8) horizontal displacement transducer, (9) gear box (direct drive), (10) exchangeable motor.

Fig. 2. Direct simple-shear apparatus in the cold laboratory at Rogers Pass: mounting of sample.
Table 1. Displacement or shear rates produced by different motors and corresponding average strain rates

Snow Sampling
Snow samples (115 mm in diameter, 16–18 mm in height) were prepared from snow blocks that had been taken from a so-called homogeneous natural layer of fine-grained snow (about 50 cm below the surface) in the study plot at Rogers Pass (1315 m a.s.l.). The layer originated from a major snowstorm at the beginning of January 1996. Layering was parallel to the sample plane. Snow temperature in situ was between −3°C and −6°C. Sampling was done periodically prior to a series of experiments. Natural storage was preferred to storage in the laboratory which would have been impossible anyway due to limited facilities. The layer naturally densified during the course of the winter. Therefore, sample density and hardness increased slightly in the course of the tests. Foreach sample, grain type and size, hand hardness and density were determined. Average density was 290 kg m−3, grains were always characterized as small rounded particles (0.25–0.5 mm), hand-hardness index was 3 (one finger) to 4 (pencil). Towards the spring season, it became difficult to obtain good samples. Therefore, the results of the last series of experiments conducted at slowest motor rate ( Table 1), towards the end of the winter, are difficult to compare with the other experiments. For all other experiments, snow type was similar and results can be compared. Scatter is still considerable even for samples prepared from the same block of so-called homogeneous snow.
The scatter is similar to that found in field measurements (Reference FöhnFöhn, 1989, Reference Föhn and Armstrong1993). Figure 3 illustrates reproducibility or scatter found in laboratory experiments; typical values are about 25%.

Fig. 3. Stress strain curves for six samples of the same snow type tested under identical conditions (average strain rate: 2.9 × 10⁻⁴ s−1, temperature: −10°C) revealing natural inherent variability to be considered in snow testing of alpine snow.
Test Procedure
Three to seven experiments were performed for each of the six different displacement rates at test temperatures of −5°C, −10°C and −15°C, resulting in a total of 112 experiments that could be analysed. Usually, samples were tested at a certain displacement rate on three consecutive days at the three test temperatures. Accordingly, samples were stored typically between 1 and 5 days.
The normal load applied was 4.9 N, which corresponds to a stress of 470 Pa, and was the same for all experiments.
Definitions
Before analysing the stress-strain curves, it is useful to describe the terms failure, peak and fracture, as well as stiffness and toughness. Failure, peak and fracture refer to three designated points on the stress-strain curve that may or may not be obvious, depending on strain rate (Fig. 4). For the fast tests, the three points coincide, whereas for the very slow tests often only the peak value can be identified. If the stress drops after the peak and the strain increases, the sample shows strain-softening. If samples are sheared at the slow or very slow rate (Table 1), the stress continues to decrease and finally levels off: so-called residual strength. The stiffness is the initial tangent to the stress-strain curve, also called the initial tangent modulus or shear modulus. It is an effective modulus that might include different contributions of the deformation process. It is not an elastic modulus, except probably for the fast experiments. The initial tangent is determined by a linear regression for the data points at the beginning of the stress-strain curve that show linear behaviour which is, in general, the case below 2 kPa. Integrating the stress over strain up to the peak reveals the toughness, which is a measure for the fracture propagation potential, or represents the work needed to reach a peak on the stress-strain curve. The toughness corresponds to the area below t he stress-strain curve. Stiffness and toughness are analysed in the light of the slab-release model described by Reference McClungMcClung (1996).

Fig. 4. Stress-strain curve with definitions of failure, peak and fracture (test #93, strain rate: 2.7 × 10⁻⁴ s−1, temperature: −10°C). Question mark indicates an additional kink in the curve of unknown origin, maybe a very first failure.
The results given below are usually for the failure point, since these values of stress and strain show less scatter than the peak values. This results from the fact that, due to ongoing damage after the failure point, deformation behaviour changes and becomes more random.
The shear strain is calculated from horizontal displacement and initial sample height, assuming that the whole sample is homogeneously sheared. The strain rate is the ratio of failure strain to time at failure. It is therefore an average value for the test duration from beginning to failure. The strain rate is generally not constant during a test. It increases in particular after the failure point.
Results
Effect of Strain Rate
Typical stress-strain curves for three different strain rates are shown in Figure 5. Curve (a) shows the response of the stressed snow sample for a strain rate of 7.0 × 10⁻⁵ s−1; test duration was 3 min 20 s. The curve shows typical strain-softening behaviour with a ductile type of failure characterized by large deformation and high toughness or energy-absorption capability as evidenced by the area under the stress-strain curve. Curve (b) is typical for the tests performed with strain rates of about 10−4 s−1 and is believed to be typical for the intermediate range between the purely ductile and brittle behaviour. The curve shows that ductile failures, causing microstructural damage, are going on (as in the slow tests) but the sample finally fails catastrophically after a certain amount of deformation (see also Figs 3 and 4). The test duration is typically about 45 s. Curve (c) shows the result of a fast test (strain rate 6.6 × 10⁻³ s−1). The type of failure is brittle; the sample breaks after very little deformation within fractions of seconds and exhibits minimal toughness. All three samples have been tested at −15°C. The faster the shear rate, the larger the initial slope of the stress-strain curve.

Fig. 5. Typical stress-strain curves for three different strain rates, (a) 7.0 × 10⁻⁵ s−1, (b) 2.7 × 10⁻⁴ s−1, (c) 6.6 × 10⁻³ s−1; insert shows details at the beginning, test temperature −15°C
The strain to failure decreases with increasing strain rate in the ductile range and seems to be independent of shearing rate in the brittle range. This feature is independent of temperature. Figure 6 shows the values of failure strain for the samples tested at −10°C. The ductile-to-brittle transition is at a strain-rate value of about 1 × 10⁻³ s−1. Typical values for the failure strain are 3–4% for the very slow shear rates, 1–2% in the intermediate ductile range and 0.1–0.3% in the brittle range.

Fig. 6. Failure strain vs strain rate for samples tested at −10°C.
Failure stress (Fig. 7) strongly decreases with increasing strain rate for the whole range of strain rates. Stress values decrease by about a factor 10 from slow to fast loading. Values in the brittle range coincide well with field tests (Reference RochRoch, 1966).

Fig. 7. Failure stress vs strain rate for samples tested at −10°C.
Stiffness or initial tangent modulus increases with increasing strain rate (Fig. 8). This is due to the fact that the effective modulus is considered. The overall deformation is the sum of different components of strain, some of which are time-dependent (viscous part). Hence, in the slower tests, deformation is larger resulting in lower stiffness values. Shear-modulus values of the order of 1 MPa are compatible with previous results (Reference MellorMellor, 1975).

Fig. 8. Stiffness or initial tangent modulus vs strain rate for samples tested at −10°C
The dependence of peak toughness on strain rate shows a similar feature as the failure strain: decreasing with increasing strain rate in the ductile range and independent of strain rate in the brittle range (Fig. 9). Toughness values decrease about a factor 100 from slow (8 × 10⁻⁵ s−1) to fast loading (5 × 10⁻³ s−1).

Fig. 9. Failure toughness vs strain rate for samples tested at −10°C.
Effect of Temperature
Figure 10 shows how temperature affects some of the mechanical parameters. Strength and stiffness increase and failure strain decreases with decreasing temperature.

Fig. 10. Typical stress-strain curves for three test temperatures −5°C, −10°C and −15°C.
To analyse the effect of temperature statistically the data-set was reduced to the experiments performed with slow and intermediate shear rate (Table 1). The tests done with the slowest motor (strain rate 7 × 10⁻⁶ s−1) were not considered, because the snow type of the samples was different for that series of experiments. Also, the fast tests (strain rate 5 × 10⁻³ s−1) were not included in the statistical data evaluation, since the results of tests in the brittle range in general show much more scatter than in the ductile range. As cracking dominates, results become more random. In addition, the scan frequency was too low during the fast tests, so that some of the peaks probably have been missed.
A multiple regression with Celsius temperature t and strain rate ![]() as independent variables was performed for failure strain εf, failure stress τf, stilfness G and toughness K. Results of the statistical analysis are shown in Figures 11 to 14. The multiple regression is given as a line assuming an intermediate strain rate of 3 × 10⁻⁴ s−1. In addition, the number of cases N, the coefficient of multiple correlation R, the standard error of estimate SE and the significance level pt
for the temperature are given. For the other independent variable, the strain rate, the level of significance was always very small (p < 0.0001, i.e. highly significant). Based on the multiple-regression analysis. Table 2 summarizes the effect of a temperature decrease from −5°C to −15°C assuming an intermediate strain rate of 3 × 10⁻⁴ s−1.
as independent variables was performed for failure strain εf, failure stress τf, stilfness G and toughness K. Results of the statistical analysis are shown in Figures 11 to 14. The multiple regression is given as a line assuming an intermediate strain rate of 3 × 10⁻⁴ s−1. In addition, the number of cases N, the coefficient of multiple correlation R, the standard error of estimate SE and the significance level pt
for the temperature are given. For the other independent variable, the strain rate, the level of significance was always very small (p < 0.0001, i.e. highly significant). Based on the multiple-regression analysis. Table 2 summarizes the effect of a temperature decrease from −5°C to −15°C assuming an intermediate strain rate of 3 × 10⁻⁴ s−1.
Table 2. Temperature effect on some mechanical properties for a temperature decrease from −5°C to −15°C, assuming an intermediate strain rate of 3 × 10⁻⁴ s−1

The most significant effect of temperature is found for the stiffness or initial tangent modulus (Fig. 11). The modulus strongly increases with decreasing temperature, almost doubling from −5°C to −15°C for the snow samples tested.

Fig. 11. Stiffness or initial tangent modulus as a function of temperature, together with results of the multiple-regression analysis.
The failure stress only slightly increases with decreasing temperature (Fig. 12). As the change in failure stress is of a similar order of magnitude as the scatter in the stress data, there remains some doubt about this result. However, the correlation is close to statistically significant (p level: 0.018) and the order of magnitude is the same as that reported by Reference SalmSalm (1971) for the compressive strength and by Reference NaritaNarita (1983) for the tensile strength.

Fig. 12. Failure stress as a junction of temperature, together with results of the multiple-regression analysis.
The effect of temperature on failure strain (Fig. 13) is significant but less pronounced than on stillness and of opposite sign compared to stiffness and failure stress. The failure strain decreases for decreasing temperature (i.e. less deformation is needed to start failure for colder snow). This follows directly from the effect on stiffness. The slightly higher stress values and, accordingly larger strain values that are reached before failure starts, do not compensate for the effect on stiffness. The data do not show a significant dependence of the critical strain rate (transition ductile-to-brittle) on temperature.
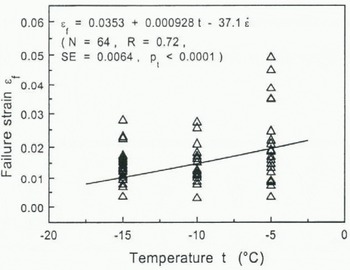
Fig. 13. Failure strain as a function of temperature, together with results of the multiple-regression analysis.
Finally, the toughness also decreases with decreasing temperature (Fig. 14). This result seems to follow from the definition of toughness and the fact that strain decreases but stress only slightly increases with decreasing temperature. It should mean that the colder the snow the lower the energy-absorption capability. Decreasing toughness with decreasing temperature is known from other materials such as steel (Reference Boresi, Schmidt and Sidebottom.Boresi and others, 1993).
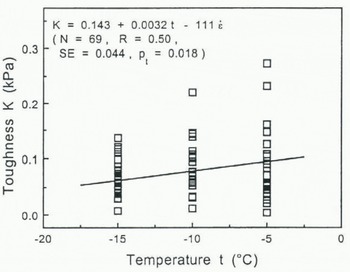
Fig. 14. Toughness as a function of temperature, together with results of the multiple-regression analysis.
Conclusions
The results gained with direct simple-shear experiments, varying shear rate and temperature are in general limited to the type of snow, the range of strain rates and temperatures tested. However, general features are probably valid in spite of snow type. In addition, the snow type studied, fine-grained, relatively hard and dense snow is important for slab-avalanche release, since it often forms the slab. As has been shown by theoretical studies (Reference McClungMcClung, 1987, Reference McClung1996) and experimental work (Reference Camponovo and Schweizer.Camponovo and Schweizer, 1997), the slab properties are as crucial as the weak-layer properties for assessing snow stability.
Most mechanical properties of snow are shown to be rate-dependent. Tests have been performed for a range of strain rates from 7 × 10⁻⁶ s−1 to 5 × 10⁻³ s−1. Failure stress decreases with increasing strain rate. The same is true for the failure strain but, if the samples suddenly break after very limited deformation (brittle failure), the strain seems to become independent of strain rate. For the snow type tested, the transition between the ductile and the brittle state was at a strain rate of about 1 × 10⁻³ s−1. The toughness depends similarly on strain rate as failure strain. The stiffness or initial tangent modulus increases with increasing strain rate, probably due to different contributions of the deformation components, some of which are time-dependent.
Stiffness proved to be highly temperature dependent, it roughly doubles from −5°C to −15°C. It seems to be the most relevant mechanical property of alpine snow in the study of temperature effect on dry slab-avalanche release (Reference McClungMcClung, 1996). Failure strain, the amount of deformation needed before failure starts, and toughness are also significantly temperature-dependent. However, they decrease with decreasing temperature. Failure stress or strength seems to depend only slightly on temperature. It increases about 20% from −5°C to −15°C. The temperature dependence might partly be hidden by the scatter in stress data due to variations inherent in sampling and testing.
Acknowledgements
This study was performed when the author was on leave at the Department of Civil Engineering, University of Calgary, Canada. The advice from D. McClung (University of British Columbia) and T. Berre (Norwegian Geotechnical Institute) is gratefully acknowledged. C.Johnston (University of Calgary) provided technical support and reviewed a previous version of the manuscript. Thanks for logistical support at Rogers Pass are due to R. Beardmore (Mount Revelstoke and Glacier National Parks). Finally, it is a pleasure to thank B. Jamieson (University of Calgary) for many stimulating discussions. During his visit to Canada, the author was supported in part by the Natural Sciences and Engineering Research Council of Canada through a Canada International Fellowship.


