


1. Introduction
When sea-water freezes, salt is rejected at the ice/water interface and diffuses into the liquid more slowly than the diffusion of heat to the interface. This causes the brine immediately ahead of the interface to be at a temperature below its equilibrium freezing temperature, a state which is called constitutional supercooling. Thus, any protrusion on the interface will find itself in supercooled brine and a regular array of elongated cells will develop. The spacing between the tips of these cells is a function of the growth parameters and is typically of the order of 0.5 mm, while the depth of the groove between the cells is one or two orders of magnitude greater. At the root of the intercellular groove, pockets of brine form and the resulting sea ice is a laminate of pure ice platelets separated by pockets of brine (see Fig.6.(a)).
The shape of the cells is crystallographically controlled, the c-axis being normal to the direction of elongation. In addition, it has been observed that, over areas of hundreds of square kilometres, the c-axes of the grains not only lie in the horizontal plane, but also align in a particular direction in that plane (Reference SchwarzacherPeyton 1966, Reference DelvesCherepanov 1971, Weeks and Gow 1978, 1980), This means that there will be a regular inclusion of the liquid phase in sea ice and the physical properties will therefore be anisotropie. Reference SchwarzacherPeyton (1966), for example, found that the compressive strength of this aligned ice was dependent on the angle between the mean c-axis direction and the axis of compression. Furthermore, impulse radar studies (Campbell and Orange 1974, Kovacs and Morey 1979, Golden and Ackley 1980) have shown that there is an anisotropy in the dielectric properties of sea ice which is also related to the mean c-axis direction. It is therefore of interest to discover the mechanism which aligns the rows of brine pockets and hence the crystallographic c-axes. Suggestions have included small horizontal temperature gradients, tilting of floes (Reference Weeks and GowSchwarzacher 1959), horizontally-oriented deviatone stresses (Reference PeytonPaige 1966, Reference SchwarzacherPeyton 1966), alignment in the surface skim of ice (Reference CherepanovCherepanov 1964), the Earth’s magnetic field (Reference DelvesCherepanov 1971), and oceanic currents close to the ice/water interface (Gow and Weeks 1977, Kovacs and Morey 1973, Weeks and Gow 1970, 1980). The purpose of this paper is to investigate, by laboratory experiment, which of these mechanisms is responsible for the alignment of c-axes. Evidence from field studies has indicated that currents are the most probable mechanism. Weeks and Gow (1978) explain this by suggesting that mixing in the fluid is enhanced by the “rougher” appearance of the interface when the flow is parallel to the c-axis direction. The growth-inhibiting solute is then removed more rapidly from the region of the interface and grains with the c-axis and current vector aligned may grow at the expense of the others. The experiments reported here were therefore designed principally to simulate sea-ice growth in a current, although other hypotheses were also considered.
2. Design of Laboratory Apparatus
An early version of the laboratory apparatus has been described in Reference LangnorneLanghorne (1980). The equipment is shown in Figure 1 and has been described in detail in Langhorne (unpublished). The 1.2 × 0.6 m slab of sea ice for fabric analysis formed in tank B, which was located within the larger tank A. The under-ice current was produced by pumping NaC1 solution from tank B up into tank C. Here the heat introduced by the pump was dissipated and, by injecting the fluid returning to tank A below the waterline, turbulence and splashing in tank A were minimized. Honeycombs at the entrance of tank B ensured that the current under the test slab was within a few degrees of the x-direction (the long axis of tank B (Fig.l)). The size of the apparatus was limited by the cold room in which the experiments were conducted, making it impossible to entirely exclude lateral heat flow. Because large horizontal temperature gradients are known to orient grains in sea ice, the magnitude and direction of this gradient were deduced from the vertical temperature gradient and from the slope of the ice/water interface at the completion of the experiment. The deduced horizontal temperature gradient was within 20% of the measured value at single locations in two experiments. The major experimental obstacle was the production of unidirectional, columnar sea-ice growth in the test section, while simultaneously preventing ice formation in the pipes and pump.

Fig. 1. Schematic diagram of laboratory apparatus to grow sea ice in a current.
The current speed was chosen to match under-ice field measurements (Weeks and Gow 1980). [t was kept constant by adding cooled brine to raise the test slab upwards, thereby maintaining a constant depth of fluid beneath the ice. Vertical current profiles were measured and the fluid motion was found to be laminar with buoyant fluctuations in velocity and temperature close to the ice/water boundary.
Throughout the experiments, tilting of the slab of NaCl ice was avoided since this can produce an alignment of c-axes. No evidence of horizontal stresses was observed and no alignment was found in the surface skim of ice. If the Earth’s magnetic field was important, the resulting mean c-axis direction should be the same for all experiments performed.
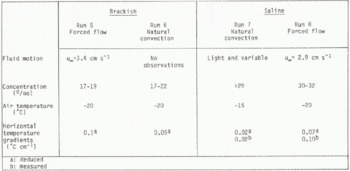
It has been suggested that a crucial test of the ideas of Weeks and Gow (1978) lies in the texture of freshwater ice grown in a current, since the planar interface of pure ice has no means of interacting ani-sotropically with the current. Thus, the c-axes of pure ice grains would not be expected to align with the current. However other properties, such as thermal conductivity, which are virtually isotropie for pure ice are anisotropie for saline ice. Hence the hypothesis that the c-axes of sea-ice grains are aligned by a current cannot be proved by comparison of flow-induced fabrics of pure and saline ice alone. Instead it is necessary to perform a control experiment with no flow for each experiment with unidirectional fluid motion. Two of these sets were carried out, the first with brackish solution (-20°/00) and the second with saline solution (-30°/00) and the effect of the increase in salinity was noted. The conditions during these experiments are given in Table I where u∞ is the velocity outside the boundary layer approximately 40 cm from the entrance of tank B. The experiments are numbered in the order in which they were performed.
Table 1. Summary Of Experiments
3. Results of Fabric Analysis
When the slab of NaCl ice was approximately 20 cm thick, the experiment was terminated. The ice was divided into blocks, and labelled from 1 to 6 in the positive x-direction and A to D across the slab. C-axis measurements were made at -25°C using a universal stage and following methods described in Lanyway (1958). The strength of the alignment was quantified following Mardia (1972: 222). As described in Langhorne (unpublished), this yields a concentration parameter which is the ratio of the grouping of the axes about the mean direction to the grouping about the direction normal to this mean. Thus, large values of the concentration parameter indicate tightly grouped data. Since the c-axes in sea ice generally lie close to the horizontal, the mean direction and its normal are also approximately in this plane.
Figure 2(a) to (d) shows the direction and strength of the alignment as a function of depth beneath the ice surface for each of the four experiments. The location of each sample in the slab is also given.
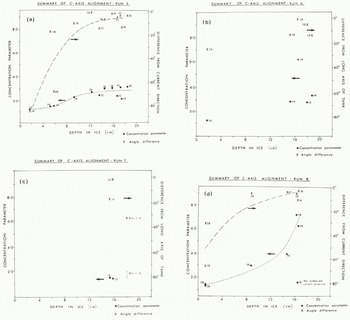
Fig. 2. Diagrams of the concentration parameter (shown by dots) as a function of depth in the ice for the experiments. The difference between the mean c-axis direction and the current or x-direction is also given (shown by crosses). Dotted lines indicate trends in data.
3.1 Brackish experiments
Run 5: forced flow
As the ice thickens (see Fig.2.(a)) direction of the distribution of c-a the x-direction which, for this experiment, was also approximately the current direction. ured current direction and the mean base of the ice are compared (Fig.3. difference is 7°.On the other hand orientation was controlled by heat f c-axis of the distribution would be direction of the horizontal tempérât ever, Figure 4(a) shows that there i relationship between the mean c-axis the c-axis direction predicted from temperature gradient. Similarly, the the concentration parameter and the erature gradient are unrelated (see Fig.4.(b)).
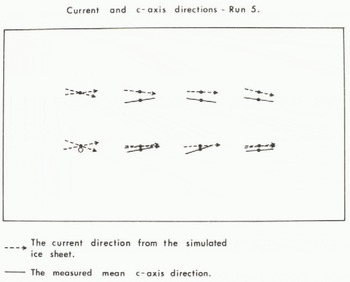
Fig. 3. Measured current direction in tank B and mean c-axis directions at the base of the NaCl ice slab. The open circle denotes a random c-axis distribution.

Fig. 4a. Diagram of the measured mean c-axis direction versus the c-axis directions predicted from the horizontal temperature gradients. If there was significant correlation between these, the data would lie on a straight line of slope 1 (shown in bold). Measured and predicted quantities can differ by up to 90° and the shaded region is thus prohibited. Legend shown in Figure 4(b).
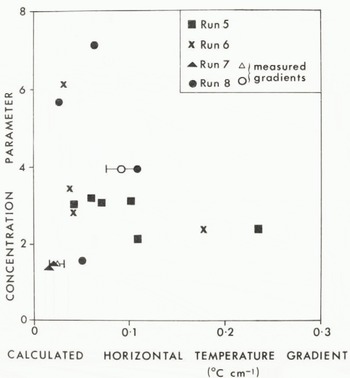
Fig. 4b. Diagram of concentration parameter versus the calculated horizontal temperature gradients. Note that the two measured gradients are plotted, with errors, and the corresponding calculated gradients are within this error.
From Figure 2(a), it can be seen strength of the alignment, which ini with depth, becomes constant from 11 this depth, the salinity profiles indicate that there was a transition from the characteristic cellular interface of sea ice to the smooth, planar interface of pure ice. Such a transition would be predicted (Langhorne unpublished) by a theory for interface stability in the presence of a laminar boundary layer (Reference FlemingsDelves 1971). This behaviour adds further weight to the argument that the current is controlling the orientation of the c-axes, since after the transition the current can no longer interact aniso-tropically with the salinity boundary layer. Run 6: natural convection.
It is impossible to avoid natural convective flow during the downward freezing of sea-water. It is therefore essential to ensure that buoyancy-driven convection is not forced into a directional motion by the pattern of freezing or the geometry of the apparatus. At first sight, the results of run 6 are inconsistent with those from other experiments, since in samples from some locations the c-axes show a preferred orientation, but there is no systematic increase in alignment strength with depth {see Fig. 2(b)). This lack of depth dependence in the concentration parameter and angular difference from the x-direction (see Fig.2.(b)) suggested that these quantities might rather be a function of the downtank coordinate x. Figure 5 shows that this is the case, In addition, there is no reason to suspect that the observed alignment is due to heat flow (see Fig.4.). A more reasonable explanation for the pattern of alignment in Figure 5 is that the unusual freezing conditions during the initial stages of this experiment induced a buoyancy-driven flow which was strongest at the open end.of the test section (small values length of sheet of ice sealed end. Thus it appears that natural convection has caused the preferred orientation of c-axes in this case.
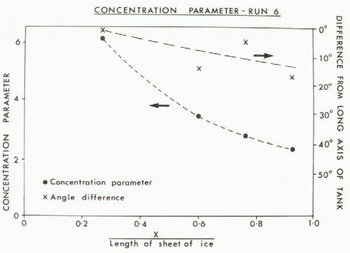
Fig. 5. Diagram of the concentration parameter as a function of the dimensionless distance from the honeycombs for run 6. Dotted lines indicate the trend in the data.
3.2 Saline experiments Run
7: natural convection
Buoyancy-driven convection was carefully controlled and observed during this experiment, in the light of the experience gained during run 6. There was no unidirectional fluid motion and, although the appearance of the grains is still typical of sea ice (see Fig.6.(a)), the resulting fabric is quite different to that found in the previous two experiments. After 15 cm of sea-ice growth the c-axes still form a symmetric girdle distribution (Fig.6.(b)). This is reflected in the low value of the concentration parameter in Figure 2(c). Again there is no systematic relationship between the magnitude and direction of the horizontal temperature gradient and the mean distribution of c-axes. Run 8: forced flow
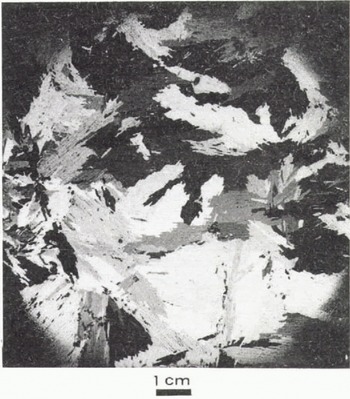
Fig. 6a. Horizontal thin section from run 7 (saline-no forced flow) taken 15 cm below the ice surface. Note the well-defined platelets.
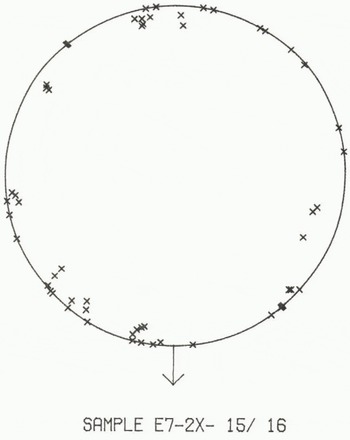
Fig. 6b. Equal area projection diagram for run 7, taken 15 cm from the ice surface. The long axis of tank B is shown by the arrow on this figure. Sixty-four measurements were made.
In contrast to the girdle distribution of run 7, Figure 7(a), (b), (c) maps the development of the preferred orientation of c-axes during this experiment. Figure 2(d) also shows this rapid increase in the concentration parameter with depth, the axis of alignment being the current direction. The anomalous data point, from location IB, was purposely taken close to the entrance of tank B where the effect of the leading edge mixed the fluid, preventing a well-defined direction of flow. Therefore the low value of the concentration parameter for this location confirms the hypothesis that the current controls the grain orientation, comparison of Figure 7(d) with Figure 6(a), its counterpart from run 7, illustrates that, although the current has an ordering effect on the distribution of c-axes, the appearance of the thin section is more chaotic in the presence of fluid motion. This apparent chaos is due to the small angle differences between platelets comprising a grain.
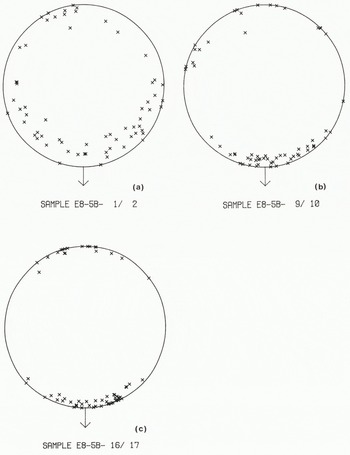
Fig. 7. a,b,c, Equal area projection diagrams for run 8, from 2, 10, and 17 cm from the ice surface, respectively. The arrow shows the approximate current direction. In each case, 64 measurements were made.
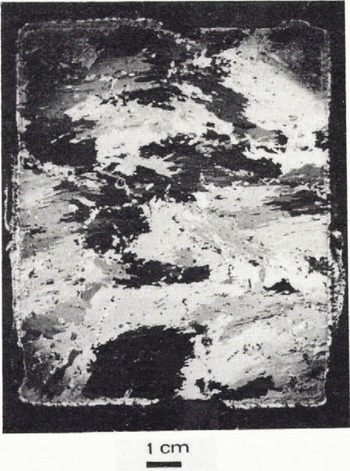
Fig. 7d. Horizontal thin section taken 17 cm below the ice surface. Current direction from top to bottom of photograph.
The most-striking feature of this experiment is shown in Figure 8. The grains consistently grew in a direction opposing the flow, regardless of the slope of the interface. This upstream deflection of the columnar axis has been frequently observed duringthe solidification of metal alloys in a flowing melt (for example, Reference Golden and AckleyFlemings 1974), and has been attributd to the flow-modification if the heat or solute boundary layer. Although such deflection has been noted for pure ice (Reference PaigeMiksch 1969), it has not been previously reported for sea ice in the field or the labortory. Examination of Figure 7© shows that this upstream tilting is accopained by a grouping of the upstream tilting c-axes about the downstream pole; indicating that the c-axes maintain their orientation normal to the columnar axis. A more detailed discussion is given in Langhorne (unpublished).
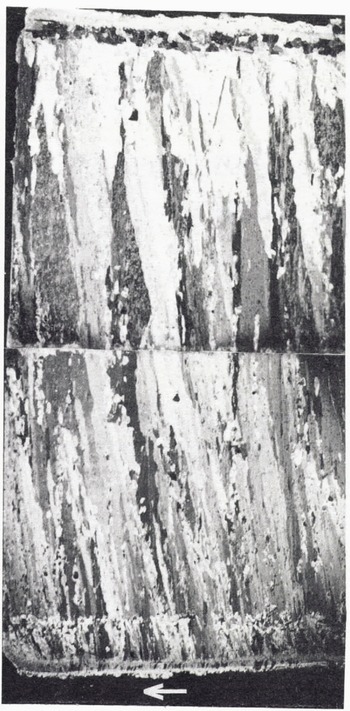
Fig. 8. Vertical thin section in the x-plane from run 8. Columnar growth extends from the ice surface to the base of the ice. There is a deflection of the grains upstream into the current, the direction of which is shown by the arrow.
4. Conclusions
The most important conclusions of this study are listed below.
-
(1) In the absence of horizontal deviatone stresses and tilting of the sea-ice sheet, a preferred orientation of c-axes develops when sea ice forms in a laminar current, the mean of the distribution coinciding with the current direction. The strength of this alignment increases rapidly with depth beneath the ice surface. When there is no unidirectional fluid motion there is a substantial reduction in alignment.
-
(2) Weak, buoyancy-driven flow appears to be sufficient to produce a preferred orientation of c-axes.
-
(3) Despite unnaturally large horizontal temperature gradients, no correlation was found between the strength of alignment or the mean direction of the distribution of c-axes and the magnitude or direction of these gradients.
-
(4) During the brackish experiment with forced flow, a cellular to planar transition took place at the ice/ water interface and the increase in the strength of alignment with depth was simultaneously halted. This ideal circumstance indicates the importance of the cellular interface in the process of c-axis alignment and points to the interaction between the roughness of the interface and the fluid motion as the important physical mechanism.
-
(5) The importance of the fluid motion in controlling the geometric selection of grains by the rate of transport of solute from the interface is also suggested by the upstream deflection of the columnar axis of grains growing in a current. This tilting resolves the 180° ambiguity in the current direction.
Acknowledgements
This study was carried out while in receipt of a studentship from the Natural Environment Research Council, and 1 would like to express my gratitude to my supervisors, Dr G de Q Robin and [)r P Wadhams. The work was extended due to a grant from the US Office of Naval Research. I particularly wish to thank Dr W Robinson and Mr S Moore for their input into this project.


