


1. Introduction
Arctic sea-ice cover has drastically decreased in recent years. A particularly large decrease occurred in summer 2007, when sea-ice extent plunged to its lowest level since satellite observations of sea ice began in the 1970s (Reference Zhang, Lindsay, Steele and SchweigerZhang and others, 2008). The next lowest levels occurred in the summers of 2008 and 2010 (Fig. 1). In particular, ice decreased in the East Siberian Sea during summer 2007 (Fig. 2a) and on both sides of the Arctic Ocean in the Beaufort and East Siberian Seas during the summers of 2008, 2009 and 2010 (Fig. 2b–d). The decrease in sea ice offers opportunities for the development of transportation routes and oilfields. Undiscovered conventional oil and gas resources in the Arctic are estimated to comprise ~90×109 billion barrels of oil, 1669×1012 ft3 of natural gas, and 44×109 barrels of natural gas liquids (Circum-Arctic Resource Appraisal Assessment Team, http://pubs.usgs.gov.fs/2008/3049/fs2008-3049.pdf). Furthermore, the opening of the Northern Sea Route (NSR) would decrease the shipping distance between Asia and the Atlantic coasts of Europe and North America by as much as 40% (Reference Kitagawa, Izumiyama, Kamesaki, Yamaguchi and OnoKitagawa and others, 2001). However, for effective use, the NSR and Northwest Passage (NWP), defined collectively as the Arctic Sea Route (ASR) by Laulajainen (2009), must be open for sufficiently long periods. Previous studies have defined the relationship between ice thickness and the requirements of ice-strengthened ships or icebreakers (Reference Kitagawa, Izumiyama, Kamesaki, Yamaguchi and OnoKitagawa and others, 2001; IMO, 2002). In addition, in Canada, the Arctic Ice Regime Shipping System (AIRSS) evaluates navigation safety using ice concentration, ice class of the ship, and ice type to calculate an index called the Ice Numeral (Reference Timco, Kubat and JohnstonTimco and others, 2005), which showed that from 1969 to 2002 the NWP was not yet a practical shipping route (Reference Howell and YackelHowell and Yackel, 2004).

Fig. 1. Sea-ice extent in the Northern Hemisphere from 1978 through 2010 (calculated using ice concentration data provided by the US National Snow and Ice Data Center.

Fig. 2. Minimum area of Arctic Sea ice from 2007 to 2010 (provided by IJIS). (a) 15 September 2007, (b) 9 September 2008, (c) 7 September 2009 and (d) 19 September 2010. White shows sea ice, black shows land and gray shows open water.
This study examined ice concentration, one index of the state of sea ice. Examining the percentage of sea surface covered by ice in a given area is an effective way to evaluate the state of sea ice since the ratio of sea ice to open water is one of the first criteria for a sea route in the Arctic Ocean. This research examined the number of navigable days on the ASR, with the objective of understanding its ice conditions. A similar evaluation was made in the Arctic Climate Impact Assessment (ACIA) conducted by the Arctic Council and International Arctic Science Committee (ACIA, 2005). The contribution of the present study is an assessment of ship navigability based on ice concentration data gathered by satellites over the past 30 years, whereas the ACIA assessment used data calculated by global climate-change prediction models.
2. Data and Methods
This study used ice concentration information based on brightness temperature data obtained from the Scanning Multichannel Microwave Radiometer (SMMR) on the Nimbus-7 satellite, Special Sensor Microwave Imagers (SSM/I) on the US Defense Meteorological Satellite Program’s (DMSP) F8, F11 and F13 satellites, and data from the Advanced Microwave Scanning Radiometer (AMSR-E) installed on the NASA Earth Observing System (EOS) Aqua satellite. Satellite observations using microwaves are not affected by clouds or darkness. We used ice concentration data derived from the SMMR and SSM/I data currently released by the US National Snow and Ice Data Center (NSIDC) and the AMSR-E data released by the International Arctic Research Center and Japan Aerospace Exploration Agency (IARC–JAXA) Information System (IJIS). Ice concentration data were derived from the SMMR between October 1978 and June 1987, from the SSM/I between February 1978 and the present, and from the AMSR-E between June 2002 and the present. Analysis of the AMSR-E data alone cannot fully show annual change because of the relatively short record length; trend analyses of the AMSR-E data have limited climatological usefulness. In this study, however, we were able to conduct trend analyses, because SMMR and SSM/I data were also used. The SMMR and SSM/I have a spatial resolution of 25 km×25 km, and the AMSR-E has a spatial resolution of 10km×10 km. Thus, the spatial resolution of ice concentration data derived from AMSR-E data was 6.25 times higher than that from SMMR and SSM/I data. Ice concentrations were derived from the SMMR and SSM/I data using the SSM/I Bootstrap algorithm (SBA) and the NASA Team algorithm (NT) (Reference Cavalieri, Gloersen and CampbellCavalieri and others, 1984), and from the AMSR-E data using the AMSR-E Bootstrap algorithm (ABA). Ice concentration data derived from the AMSR-E enable more accurate analysis, whereas data from the SMMR and SSM/I allow for analysis of interannual changes. The ABA producer reported errors of approximately 4–10% in the inner zone under dry conditions and 10–15% and ≥15% during the melt-pond season (Reference ComisoComiso, 2009). However, other researchers have shown that satellite data underestimate sea-ice concentrations in summer melt ponds by an average of 7.0±4.8% (Reference Inoue, Curry and MaslanikInoue and others, 2008).
Although IMO ice classification is based on ice thickness and ice age, we used the ice capability of ships to create a classification scheme based on a ship’s ability to navigate an area with a given concentration of ice. It is appropriate to consider ice concentration since satellite observations of sea ice generally report this parameter. For this research, we defined navigation difficulties corresponding to ice concentration (IC). Four levels of sailing difficulty are set: IC20, IC30, IC40 and IC50. For example, IC20 signifies a ship that can sail an area with ice concentration of 20% or less.
The analysis was based on the number of navigable days on the ASR between 1978 and 2009. Note that the number of days was underestimated using the AMSR-E in 2002, as the AMSR-E summer season data were not available for that year, when various operational restrictions led to missing data. In addition, the SMMR and SSM/I data are provided every other day.
The criteria for judging the opening of a route for transit take account of the IC by changing it from 20% to 50% with a 10% interval as determined on a pixel-by-pixel basis. We assumed that searching movement could be up, down, left or right, but not diagonal, from the current pixel. We also discuss the seasonal navigable periods along the ASR, based on IC. We defined ‘navigable days’ as days when all the pixels on the ASR became open water or navigable IC areas. Ships are expected to be ice-strengthened to navigate in the Arctic ice-covered waters. In addition, note that ice concentration data were derived from the SMMR and SSM/ I data, but some navigable areas of the Arctic Archipelago were hidden by a land mask. Therefore, we set a partial land mask to show open water (Fig. 3).

Fig. 3. The NWP analysis problem, (a) before correction and (b) {http://books.google.nl/books?id=GAKrjq9xh2oC&pg=RA1-
3. The Arctic Sea Route
The ASR comprises two main routes that connect the Pacific and Atlantic Oceans. The NSR follows the Siberian coast, and the NWP follows the northern coast of North America. The sea routes selected for analysis are shown in Figure 4. Determining a ship route involves considering various factors (e.g ice conditions, water depth, and land and sea infrastructure). In the Arctic, the ice condition is very important. On the Siberian coast, ship routes normally differ by ship type (Reference Kitagawa, Izumiyama, Kamesaki, Yamaguchi and OnoKitagawa and others, 2001). Smaller ships normally take routes along the continental coast (NSR1), while larger ships take offshore routes (NSR2). Figure 5 shows water depths along the NSR. The NWP is considered to include two routes (Fig. 4): the NWP1 is a northerly route; the NWP2 branches off at Larsen Sound, then passes between Somerset Island and Prince of Wales Island. We selected these because of their navigation widths: straits in the NWP1 and NWP2 are wider than other NWP routes observed by satellite microwave sensors.

Fig. 4. Map of the the Arctic Sea Route. NSR1, NSR2: the Northern Sea Route; NWP1, NWP2: the Northwest Passage.

Fig. 5. Differences in depth among the routes selected by the Central Marine Research and Design Institute (CNIIMF): (a) south route (NSR1) and (b) north route (NSR2).
4. NSR Navigable Days
The navigable days on all NSR routes and the two main routes, the NSR1 and NSR2, were analyzed by differences in IC as shown in Tables 1–3. These tables show the number of navigable days for NSR1 and NSR2. In addition, the number of navigable days when NSR1 or NSR2 opens is indicated in the leftmost NSR column in Tables 1–3. The number of navigable days derived by SBA for the NSR between 1979 and 2007 is shown in Table 1. It is remarkably large after 1995. For IC50, the results showed 70 navigable days in 1995, 26 days in 1999, 42 days in 2002, and 53 days in 2005. For IC20, there were 38 navigable days in 1995. Most years except 1995 hardly had openings of 10 days. Table 1 also shows years with significant numbers of navigable days and those with none. NSR2 has fewer navigable days than NSR1, because NSR2 is a more northerly route.
Table 1. Number of navigable days for all NSR routes according to ship class by ice concentration using SMMR and SSM/I data, calculated by SBA according to ice concentration (IC) for 1979–2007

Table 2. Number of navigable days for all NSR routes according to ship class by ice concentration using SMMR and SSM/I data, calculated by NT according to ice concentration (IC) for 1979–2009

Table 3. Number of navigable days for all NSR routes according to ship class by ice concentration using the AMSR-E data, calculated by ABA according to ice concentration (IC) for 2002–09
Table 2 presents the NT-derived number of navigable days for the NSR based on SMMR and SSM/I data from 1979 to 2009. This route showed many navigable days after 1995. More than 40 were found after 2005 for IC50. The decrease in sea ice across the entire Arctic Ocean resulted in decreased sea ice along the ASR, allowing for easier navigation through the Arctic Ocean. Decreases in sea ice in specific areas were also important in opening navigation routes. The 1995 analysis provides an example of local decreases in sea ice (Fig. 6). In 1995, a remarkable decrease in sea ice occurred in the East Siberian Sea. NSR2 in 1995 and 2005 shows many navigable days, and many are also shown for two recent years, 2008 and 2009. Because Arctic sea ice has greatly decreased in recent years around Severnaya Zemlya and the Laptev Sea, when sea-ice extent reached its lowest recorded level, in 2007, no days were open for IC20. Thus, not only the overall decrease throughout the Arctic but also the disappearance of sea ice along an Arctic Sea route is important for opening navigation.

Fig. 6. Minimum Arctic Sea ice in 1995. White shows sea ice, black shows land and gray shows open water.
Table 3 shows the number of navigable days for the NSR based on AMSR-E data according to IC class for 2002–09. There were many navigable days in 2002, 2005 and 2008; ~30 days were open even for IC20. IC50 data showed ~30 days or more each year from 2005 to 2009 (except 2007). In 2007, when sea-ice extent dropped to the lowest level recorded since satellite observations began, no days were open for IC20 or IC30 ships. Fewer than 10 navigable days were available for IC50 ships in that year since sea ice remained around Severnaya Zemlya and the Laptev Sea (Fig. 2a). As noted above, the sea-ice decrease in specific regions along the route should be monitored. The number of navigable days for the entire route decreased significantly due to high IC, even though the region is small.
IC50 ships had at least 10 more navigable days in 2005, 2006, 2008 and 2009 than did IC20 ships, whereas in 2002 the number of navigable days for both classes was nearly equal. The numbers of navigable days for IC20, IC30 and IC40 in 2005 were almost the same as those in 2008. Nevertheless, there were 6 more navigable days for IC50 ships in 2005 than in 2008, indicating that there was a wider distribution of 50% IC on the NSR in 2005 than in 2008.
For IC50 ships, open periods lasting at least 50 days in 2005 and 40 days in 2008 and 2009 were observed. Therefore, route planning that permits sailing through areas with high concentrations of sea ice is a key element; if ships can sail safely, navigable days for the NSR increase greatly.
5. NWP Navigable Days
This study indicates that the NWP has open route possibilities. The number of navigable days for all NWP routes and each of the two main routes are shown in Table 4, using the SMMR and SSM/I data calculated by SBA according to ice concentrations from 1979 to 2007. A remarkably large number of navigable days occurred in 1998 and 2007. For IC50 ships, there were 40 days in 1998 and 50 days in 2007. However, such a remarkable opening was not found in any other years. In 2007, all the NWP routes were open (Table 4). For IC50, the NWP2 had sufficient openness for navigation for a long period of 50 days or more.
Table 4. Number of navigable days for all NWP routes according to ship class by ice concentration using SMMR and SSM/I data, calculated by SBA according to ice concentration (IC) for 1979–2007

Table 5 shows the number of navigable days for all the NWP routes and on the NWP1 and NWP2 routes, using the NT-derived SMMR and SSM/I data according to IC from 1979 to 2009. The years 1998, 1999, 2007 and 2008 had many navigable days; 30 or more days were open for IC50. For IC20, the most navigable days were found in 2007. In 1998, while <10 days were open for navigation for IC20 ships, as many as 60 days were navigable for IC50. Hence, to judge the possibility of practical use of the NWP, appropriate IC criteria must be set to accurately assess the opening of navigable routes. NT results differed from SBA results for the NWP routes. Although the NWP1 route showed a remarkably large number of navigable days, the NWP2 was hardly ever open to navigation. Examining the NWP2 using the SMMR and SSM/I data for the Canadian Arctic Archipelago was difficult, due to low resolution. Analysis using the SMMR and SSM/I indicates long-term change in the sea-ice distribution on the ASR.
Table 5. Number of navigable days for all NWP routes according to ship class by ice concentration using SMMR and SSM/I data, calculated by NT according to ice concentration (IC) for 1979–2009

Table 6 presents the number of navigable days for all NWP routes and both main routes during 2002–09, based on ABA-derived AMSR-E data according to IC. Many navigable days occurred between 2006 and 2008. IC50 and IC40 had twice as many navigable days as IC30 and IC20. The only year for which IC30 had more than 30 navigable days was 2007. For IC50, however, at least 50 navigable days were identified in 2006 and 2008, and >60 days in 2007. Therefore, ships traversing the NWP must be prepared to encounter high concentrations of sea ice. In 2007, more navigable days were observed in the NWP than in the NSR, even though the region with the most drastic sea-ice decrease was that surrounding the East Siberian Sea. This is probably because the sea ice around Severnaya Zemlya and the Laptev Sea did not melt enough (Fig. 2a). NWP1 began to open in 2007, influenced by the drastic sea-ice decrease in 2007. The opening of NWP1 requires a large sea-ice decrease, as this route lies north of the other NWP routes. NWP2 also had many navigable days, with at least 20 and 50 days for IC50 ships in each of the last three years. NWP2 can be expected to have more navigable days than NWP1 in this study.
Table 6. Number of navigable days for all NWP routes according to ship class by ice concentration using the AMSR-E data, calculated by ABA according to ice concentration (IC) for 2002–2009
6. Comparison of Sensors and Algorithms
6.1. Comparison of the different microwave sensors
For comparison of results by different sensors, Figures 7 and 8 show the AMSR-E, SMMR and SSM/I data processed by the Bootstrap algorithms (ABA and SBA, respectively) for the NSR and NWP, respectively. In Figure 7, many more days are shown as navigable days by the AMSR-E than by the SMMR and SSM/I data. This result may relate to the lower resolution of the SMMR and SSM/I data compared with the AMSR-E data (Reference Comiso and ParkinsonComiso and Parkinson, 2008). The AMSR-E may be able to retrieve detailed sea routes because of its high resolution. There are also cases where the AMSR-E data show navigable days but the SMMR and SSM/I data do not. In Figure 9, for example, navigable days for the NSR are identified in the AMSR-E analysis (Fig. 9 left), but not the SMMR and SSM/I analysis (Fig. 9 right) for IC20 and IC30. This difference reflects differing abilities to retrieve the detailed sea route. If the criteria for open, navigable days are set to high IC (e.g. IC40 or IC50), the navigable days derived from the SMMR and SSM/I are closer to those from the AMSR-E data.

Fig. 7. Comparison of the AMSR-E and SSM/I data for the NSR processed using the Bootstrap algorithms (ABA and SBA).

Fig. 8. Same as Figure 7 but for the NWP.

Fig. 9. Comparison of the AMSR-E data and SSM/I data from a grid view.
Figure 8 shows that many navigable days were derived from the AMSR-E data, but none from the SMMR and SSM/I data. The spatial resolution of the SMMR and SSM/I data is ~6.25 times lower than that of the AMSR-E data. Although the resolution of the SMMR and SSM/I may not easily find a detailed navigable route, we enable distribution of sea ice in the Canadian Arctic Archipelago. It is important to be able to distinguish narrow corridors within complex geographical features such as those of the Canadian Arctic Archipelago. High resolution is needed to distinguish complicated geographical features.
6.2. Comparison of the different algorithms
Figures 10 and 11 compare the use of the two algorithms, SBA and NT, to process the SMMR and SSM/I data for the NSR and NWP, respectively. The number of navigable days tended to be higher for NT data than SBA data.

Fig. 10. Comparison plots of processing SMMR and SSM/I data by the SBA and NT for the NSR.
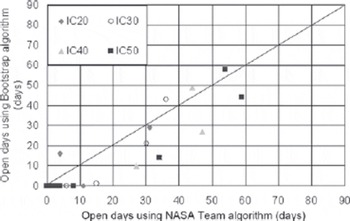
Fig. 11. Same as Figure 10 but for the NWP.
Figure 10 shows that NT tends to generate more navigable days than SBA. In addition, the plots show many cases in which NT results indicated navigable days but SBA results showed no opening. Thus, the NT approach may indicate more navigable days.
Figure 11 shows many cases in which NT data show navigable days along the NSR but SBA data do not. Also, for the NWP, the NT method showed more navigable days than the SBA method.
7. Examination of Navigation Possibilities
The above analysis of seasonal navigable periods along the ASR provides only limited information on the present and future potential of Arctic navigation. As described above, the two NWP routes had different navigable-day characteristics. This raises the possibility of choosing the best route for the time of transit. Figure 12a–d show the navigable days for the ASR calculated by applying ABA to the AMSR-E data (here we used the AMSR-E data for detailed analysis) between 2002 and 2009 according to ice concentrations.

Fig. 12. Navigable days for the ASR during 2002–09 for (a) IC20, (b) IC30, (c) IC40 and (d) IC50. The number of days in 2002 may be underestimated due to missing data. Openings for navigation are denoted by dots for the NSR and crosses for the NWP.
For IC20, openings in the NSR existed from early August to mid-September 2002, from early September to mid-October 2005, from late August to mid-October 2008, and from early September to early October 2009. In the NWP, openings existed in early September 2007. For IC30, consecutive navigable days occurred in the NWP from mid-September to mid-October 2006. Both routes often opened simultaneously to navigation in 2008, a condition that was first observed in 2008. For IC40, the NSR was navigable in August 2006, and the NWP was open in September of the same year. Thus, different routes may be open at different times of the same year. For IC40, on the other hand, both routes were often open for long periods at the same time (e.g. during 2008). Furthermore, long-term consecutive navigable days were found for IC40 in the NWP from mid-August to mid-October 2007. For IC50, almost continuous sailing was possible from August to mid-October during 2005–08.
Thus, consecutive sailing days were available for IC30 and IC20 along the ASR. Navigable days occurred in the NSR only in 2002 and 2005, in both the NSR and the NWP at different times in 2006, only in the NWP in 2007, and on both routes simultaneously in 2008 and 2009. Thus, viable routes of passage in the Arctic Ocean change from year to year. Even so, transit via the ASR may be possible if recent ice conditions are used to select the most appropriate route.
Sections 4 and 5 presented analyses by year. In this section, we examine the frequency of navigable days between 2002 and 2009. Figures 13a–d and 14a–d show opening probability between 2002 and 2009 calculated by applying ABA to the AMSR-E data for the NSR and NWP, respectively. The vertical axes show the frequency of navigable days in the past 8 years, and the horizontal axes show the date.

Fig. 13. Open-route probability for the NSR by date between 2002 and 2009 calculated using the Bootstrap algorithm (ABA) for (a) IC20, (b) IC30, (c) IC40 and (d) IC50. Results for 2002 may be underestimated due to missing data.

Fig. 14. Same as Figure 13 but for the NWP.
For the severest criterion, IC20, it was possible to sail through the NSR four times from 9 to 11 September. Those days were the most open for easy navigation along the NSR. For IC50, many navigable days were found from 30 July to 11 October. Opening also occurred twice, on 8 August and 5 October, and three times between 9 August and 23 September and 25 September and 5 October. Between 2 and 11 September, four navigable-day periods of 10 days or more occurred. Between 28 and 30 September, opening occurred as many as five times over the past 8 years.
For the NWP, for the severest criterion of IC20, sailing was possible from 4 to 15 September. For IC50, consecutive sailing days were available between 6 August and 14 October. Navigable days occurred twice between 10 August and 10 October and three times between 2 and 29 September. Between 5 and 28 September, if four navigable days are concerned, 10 or more consecutive navigable days were observed in the past 8 years.
The sailing frequency for IC20 and IC30 was higher in the NSR than the NWP. If four times navigable days in the past 8 years are concerned, more consecutive navigable days for the NWP in IC50 are shown (Fig. 13d and 14d). A continuous opening of 10 navigable days three times or more in the 8 years 2002–09 was defined as a suitable navigable period; such periods were particularly found in September. Furthermore, the open period for the NSR occurred between 30 July and 11 October, whereas that for the NWP was between 6 August and 14 October. The NSR open routes tended to close early and open early for navigation, compared to the NWP routes.
8. Discussion
The navigability of a route depends on a ship’s ability to navigate the ice conditions. Ships are assumed to be able to maneuver through narrow passages and around ice using current bathymetry. For most regions, however, only limited bathymetric data are available; thus, ships are restricted to certain narrow corridors, even if ice is in their path and ice-free areas exist outside these corridors. Figure 15 shows the difference in navigable days between the NSR1 and NSR2. In many cases, the NSR1 has more frequency of navigable days than the NSR2. The NSR2 opens only when sea ice greatly decreases, as this route is north of the other NSR routes. The NSR2 requires an icebreaker to be an effective deep-water sea route. In the Russian regulations, icebreaker escort is mandatory in some straits on the coastal sea route which is NSR1 in this study. Because icebreakers are still indispensable for Arctic navigation, we plan to highlight areas where practicable navigation of the ASR can be achieved with the aid of icebreakers, based on investigations of severe ice areas. This study of the potential for navigation along the ASR is based on the concentration of sea ice as determined from satellite microwave data. Both the NSR and NWP have many consecutive navigable days, indicating that the Arctic is a possible shipping route. We confirmed that the ASR is easy to navigate because ice conditions and passages change along the ASR. Both the NSR and NWP are easily navigated during summer, although precise predictions of route openings are difficult. Currently, the possibility of navigation without an icebreaker is also difficult to predict. However, as shown in this study, the need for icebreakers is decreasing along some of the routes constituting the ASR.

Fig. 15. Navigable days for the NRS1 and NRS2 for IC during 2002–09.
9. Conclusions
This study examined the number of navigable days along the ASR using ice concentration information based on brightness temperature data obtained from the SMMR, SSM/I and AMSR-E microwave sensors. The SMMR and SSM/I data were analyzed to assess interannual changes in open, navigable days. A remarkably large number of navigable days occurred in the NSR in and after 1995, reflecting the decrease in Arctic sea ice. Although analysis using the SMMR and SSM/I data for the NWP around the Canadian Arctic Archipelago was difficult because of low data resolution, long-term change of the sea-ice condition was indicated. Therefore, the use of AMSR-E data is effective for finding a navigable route.
The AMSR-E results showed a remarkably large number of navigable days in the ASR in 2002 and from 2005 to 2009. The number of navigable days is highly dependent on regional ice variations around Severnaya Zemlya and the Laptev Sea. For example, even though Arctic Sea ice decreased dramatically in summer 2007 (Fig. 2a), few navigable days occurred that year. Many navigable days were observed between 2006 and 2008. IC50 and IC40 had twice as many navigable days as IC30 and IC20; hence, high IC must be taken into account before sailing.
Consecutive navigable days also occurred for IC30 and IC20 on the ASR. This study found navigable days only on the NSR in 2002 and 2005, on both the NSR and the NWP at different times in 2006, on only the NWP in 2007, and on both routes simultaneously in 2008 and 2009. Hence, viable passages through the Arctic Ocean change from year to year. However, transit along the ASR may be possible using recent ice conditions to select the most appropriate route.
Open-route frequency over the past 8 years was calculated, showing opening from 30 July to 11 October for the NSR and 6 August to 14 October for the NWP. In September, sea-ice extent was found to be minimal, allowing for more navigable days.
Although the AMSR-E data have lower spatial resolution than Moderate Resolution Imaging Spectroradiometer (MODIS) or Advanced Very High Resolution Radiometer (AVHRR) data, they are useful for determining open periods of the ASR because of the all-season, all-weather and day-and-night capabilities of the AMSR-E microwave sensors.
Whether the ice pack is old or new is also very important to determine for vessels navigating the ASR (Reference Kubat, Timco, Loeset, Bonnemaire and BjerkasKubat and Timco, 2003). Navigation may be dangerous even in the low-concentration area, as ships may be damaged by thick ice flow. Therefore, in the future we will analyze navigable days on the ASR using the Ice Numeral index.
Acknowledgements
We are grateful to IARC/JAXA and NSIDC for providing the microwave brightness temperature and sea-ice data. We thank the anonymous reviewers for their helpful suggestions and comments.


