


Introduction
The deepest section of the Vostok (Antarctica) ice core (Fig. 1) is known to have characteristic features and to have been intensively investigated (Reference JouzelJouzel and others, 1999). Its three distinct layers are as follows: (i) glacier (meteoric) ice with well-preserved climatic record (down to 3310 m), (ii) ‘shear zone’ (Reference Lipenkov and BarkovLipenkov and Barkov, 1998; Reference SimõesSimões and others, 2002) at the base of the glacier ice (3450–3537 m) within which the climatic record is likely disturbed by ice deformation, and (iii) accreted ice formed by freezing of subglacial Vostok lake waters at the base of the ice sheet (from about 3538m depth to the bottom of the core). To elucidate the deformation and recrystallization processes of the Vostok ice core, both theoretical and experimental studies have been carried out (Reference Lipenkov, Barkov, Duval and PimientaLipenkov and others, 1989; Reference De La Chapelle, Castelnau, Lipenkov and DuvalDe La Chapelle and others, 1998; Reference Duval, Lipenkov, Barkov and De La ChapelleDuval and others, 1998).
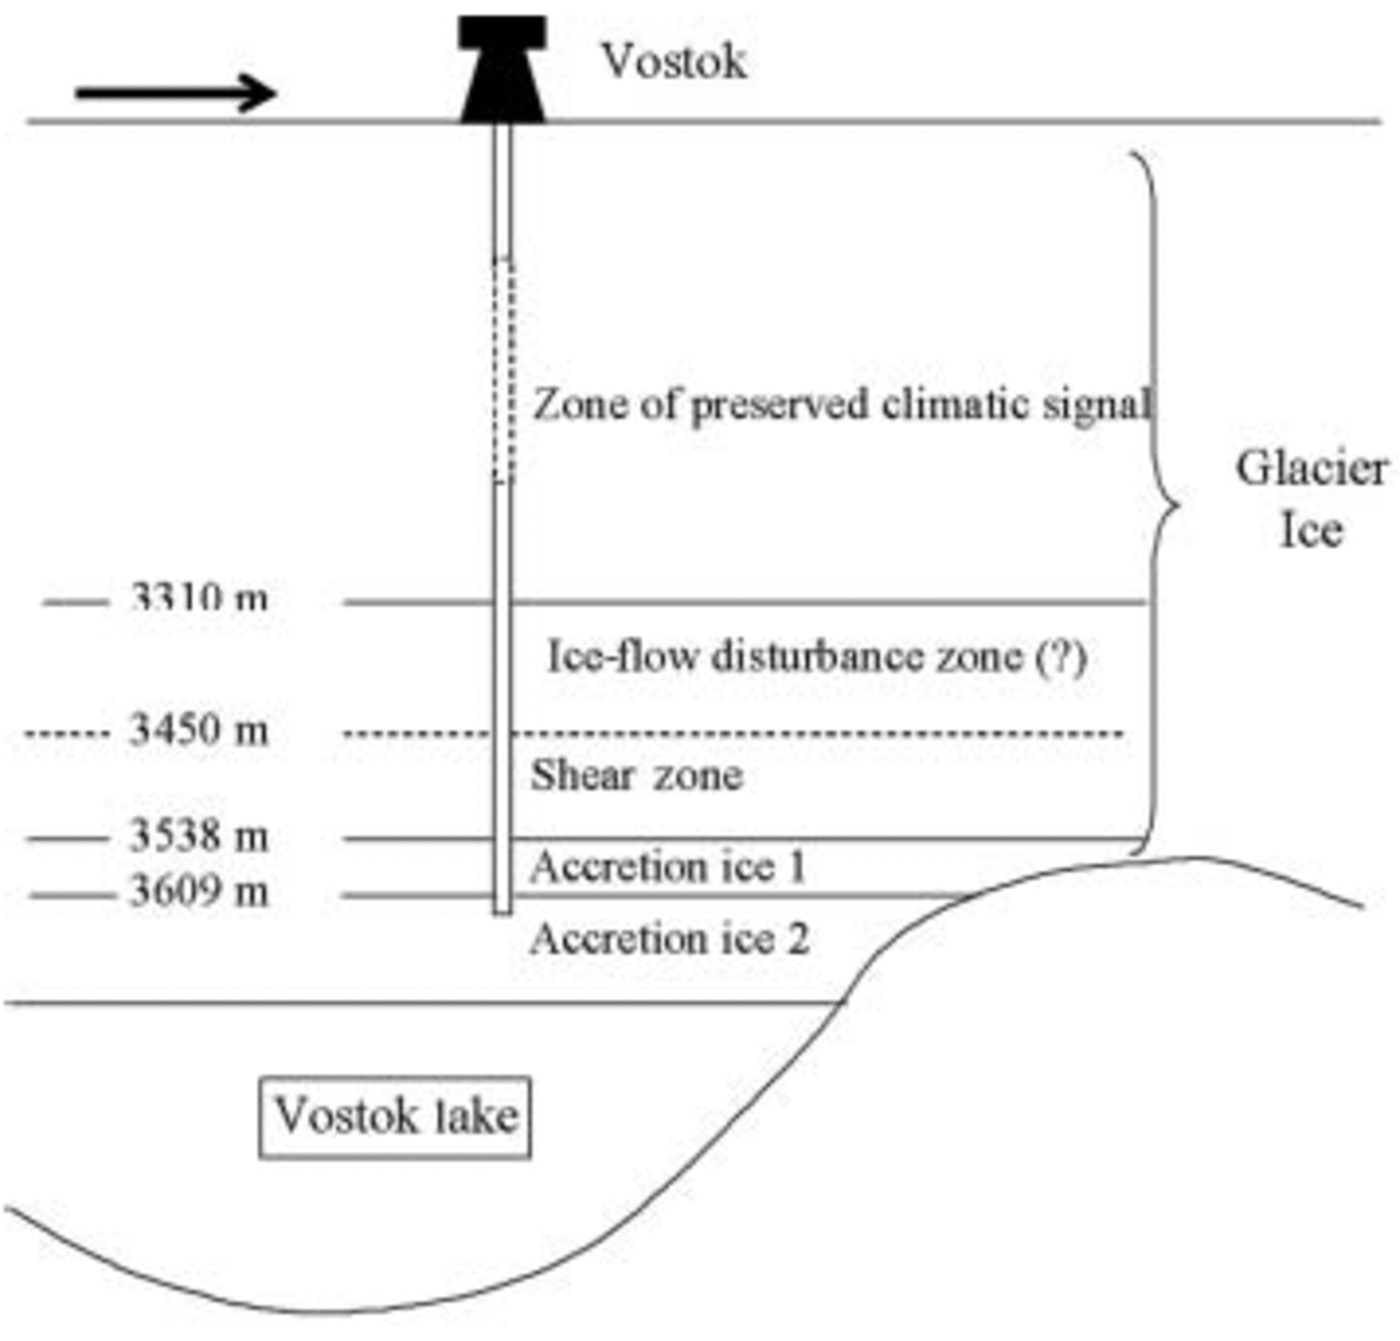
Fig. 1. Sketch of the Vostok ice core and the subglacial lake at the bottom.
The accreted ice has attracted growing attention, and extensive studies have been carried out on the lake ice (Reference Souchez, Petit, Tison, Jouzel and VerbekeSouchez and others, 2000; Reference SimõesSimões and others, 2002). The grain-size of accretion ice is >10cm (Reference JouzelJouzel and others, 1999). Therefore, conventional fabric analyses are not helpful although the orientations of large crystals of accretion ice have been reported (Reference Souchez, Petit, Tison, Jouzel and VerbekeSouchez and others, 2000). Instead, X-ray studies on the samples from a few depth levels were carried out to investigate the crystal quality of this ice (Reference MontagnatMontagnat and others, 2001; Reference Cullen and BakerCullen and Baker, 2002). High crystalline quality, i.e. low dislocation density, of these samples has been reported, but the depth dependence of dislocation density in this ice was not studied.
In the present work, lattice distortion of eight ice-core samples between 3200 and 3611 m was investigated by X-ray diffraction, and the dislocation densities were estimated for these samples. From the depth profile of the dislocation densities, information on the plastic deformation which the accreted ice experienced after its formation was obtained for the first time.
Experimental
All ice samples studied here were transported in cooler boxes kept at a low temperature using dry ice and stored in a cold room at –50˚C after drilling. The samples were cut into thin sections of about 5 mm thickness using a bandsaw and were smoothed using a microtome until the scratches disappeared to eliminate the effect of dislocations which can be introduced during the sample cutting. To prevent sublimation, silicone oil was put on each sample and then its surface was covered with a Mylar film 1.5 μm thick.
The rocking-curve measurements (Reference WarrenWarren, 1990; Reference Bowen and TannerBowen and Tanner, 1998) were carried out using an X-ray diffractometer (Rigaku, SLX2000) set in a cold room at –20˚C, whose goniometer had an accuracy of 0.0001˚. A schematic diagram of the X-ray diffractometer is shown in Figure 2. The ![]() reflections of ice were observed using Cu Kα radiation (1.54Å) through the slit of 0.05 mm width and 0.5 mm height in front of the sample. For some constraints of experiments and analyses to obtain dislocation density, we measured the
reflections of ice were observed using Cu Kα radiation (1.54Å) through the slit of 0.05 mm width and 0.5 mm height in front of the sample. For some constraints of experiments and analyses to obtain dislocation density, we measured the ![]() reflections for all samples, although not all dislocations can be observed (see Appendix). Both a four-crystal monochromator using Ge (220) reflections and a double-crystal channel-cut analyzer were employed to determine full width at half-maximum (FWHM) of the rocking curve for each sample. Since the observed width depends on the incident angle, the FWHM was corrected using the following equation:
reflections for all samples, although not all dislocations can be observed (see Appendix). Both a four-crystal monochromator using Ge (220) reflections and a double-crystal channel-cut analyzer were employed to determine full width at half-maximum (FWHM) of the rocking curve for each sample. Since the observed width depends on the incident angle, the FWHM was corrected using the following equation:
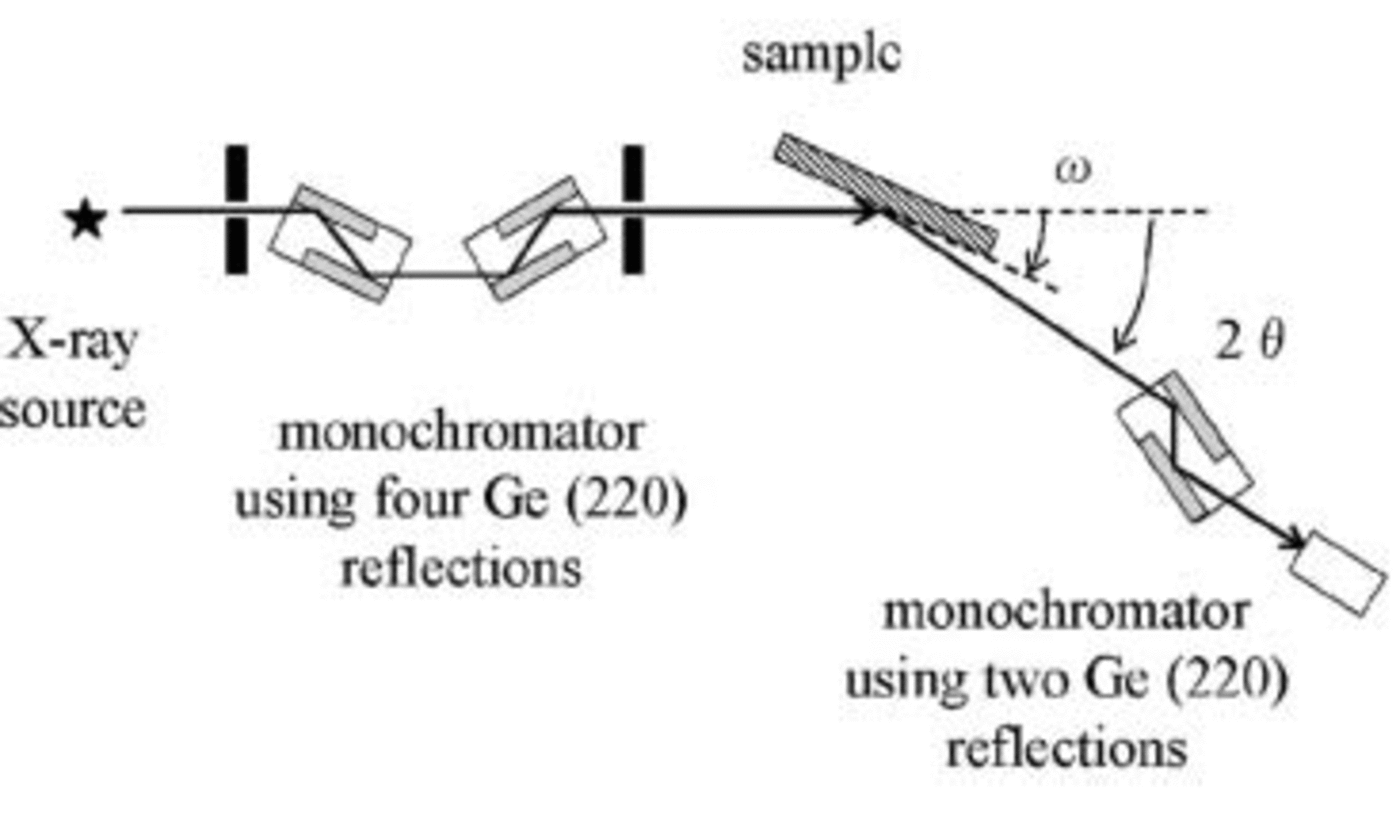
Fig. 2. A schematic diagram of the X-ray diffractometer. A four-crystal monochromator using Ge (220) reflections and a double-crystal channel-cut analyzer were employed. The width of the scattering slit was 0.05 mm.
where θB andφ are the Bragg angle and the angle between the crystal surface and the diffracting plane, respectively. Using the corrected FWHMs, dislocation densities for the samples were calculated over a wide range of dislocation density.
Results and Discussion
The rocking curves were measured for several reflections. Figure 3 shows raw profiles of the rocking curves from ![]() reflection of eight ice samples taken between 3200 and 3611 m depth of the Vostok ice core. The shape of the rocking curves depends on the samples. For example, that for the 3202m sample from glacier ice appears to be composed of four or five peaks. This structure was formed by polygonization of dislocations introduced during plastic deformation. From the intervals of the peaks, the average distance of dislocations d in the dislocation walls was estimated using the following equation: d ≈ b/θ, where b and θ are the Burgers vector length and the interval of peaks in the rocking curve, respectively. The estimated dislocation density was about 7.5 ×10¹⁰m–2. In the other samples, however, dislocation densities in the walls cannot be calculated in the same way because such structures with several distinct peaks as in the 3202m sample were not observed in other ice samples.
reflection of eight ice samples taken between 3200 and 3611 m depth of the Vostok ice core. The shape of the rocking curves depends on the samples. For example, that for the 3202m sample from glacier ice appears to be composed of four or five peaks. This structure was formed by polygonization of dislocations introduced during plastic deformation. From the intervals of the peaks, the average distance of dislocations d in the dislocation walls was estimated using the following equation: d ≈ b/θ, where b and θ are the Burgers vector length and the interval of peaks in the rocking curve, respectively. The estimated dislocation density was about 7.5 ×10¹⁰m–2. In the other samples, however, dislocation densities in the walls cannot be calculated in the same way because such structures with several distinct peaks as in the 3202m sample were not observed in other ice samples.

Fig. 3. Raw profiles of rocking curves for eight samples selected from four distinct layers of the deepest sections of Vostok ice core: (a) 3202 m and (b) 3286 m from the glacier meteoric ice, (c) 3490 m and (d) 3527m from shear zone ice, (e) 3538 m, (f) 3588m and (g) 3600m from upper accreted ice 1, and (h) 3610m from lower accreted ice 2. The width of each rocking curve is also shown, but only after correction using Equation 1 is it used to estimate the dislocation density.
A dislocation density in a grain or a subgrain was estimated using the following equation: D ≈ F2/9b2, where F is the corrected width of the rocking curve (Reference Gay, Hirsch and KellyGay and others, 1953). The width is considered to be composed of the width originating from lattice distortion, the incident beam width (Reference Kamata and MitsuhashiKamata and Mitsuhashi, 1994) and the intrinsic width of the diffraction. Therefore, a dislocation density in a grain or a subgrain can be estimated from a width of a rocking curve using the following equation:
where F, f and f0 are the width of the rocking curve, the incident X-ray beam width, and the intrinsic width of the diffraction, respectively.
Figure 4 shows the depth profile of the dislocation density and the dislocation density of a reference laboratory-grown single crystal. The dislocation density for the 3202 m sample obtained by Equation 1 was about 2.1 ×10¹⁰m–2 which was in a good agreement with the theoretical prediction of mean dislocation density within grains (Reference De La Chapelle, Castelnau, Lipenkov and DuvalDe La Chapelle and others, 1998). The density is lower than that estimated from peak intervals of the rocking curve. This is because the former represents the dislocation density inside a subgrain where annihilation of dislocations has occurred, while the latter represents that in the dislocation wall formed by gathering of dislocations as mentioned above.

Fig. 4. The depth dependence of the dislocation density calculated from the rocking-curve width by Equation 1. The boundaries of the strata in Figure 1 are shown. The dashed line shows the dislocation density of the reference single crystal.
A decreasing tendency of the dislocation density is seen for a whole depth, but no significant trend is seen either in the zone of climatic signal or in the shear zone. The decreasing tendency of the dislocation density with increase of depth is clearly found also for both shear zone ice and accretion ice below 3490m as shown in Figure 4. In this depth range, the dislocation density seems to decrease almost monotonously with the increase of depth. The values of the dislocation density are listed in Table 1.
Table 1 Dislocation density of studied nine Vostok ice-core samples from various depths and a reference laboratory-grown single crystal ice

In the case of accretion ice, the ice around the boundary between glacier ice and accretion ice is the oldest, and the deeper ice is the younger ice, while in the case of glacier ice the deeper ice is the older ice. Furthermore, there is almost no shear stress at the boundary between the accreted ice and the liquid water of the subglacial lake. Therefore, in accretion ice, the shallower ice is considered to be more deformed, and consequently the dislocation density decreases as depth increases. As for the difference in dislocation density between 3600m ice and 3610m ice, the dislocation density for the former is about 5×10⁸m–2 while that for the latter is about 2×10⁸m–2. Two possible explanations of this can be proposed. These ice samples belong to the different layers, i.e. accretion ice 1 and accretion ice 2. Mineral inclusions are observed in the former, while ice is clear in the latter (Reference JouzelJouzel and others, 1999). The presence of mineral inclusions in the accretion ice 1 suggests this ice could have been deformed under conditions of shallow water where the interaction with bedrock and, as a consequence, shear stresses in ice were possible. Alternatively, the difference in dislocation density between these layers can be explained by the difference in the ice accretion rate. Indeed, the growth rate of accretion ice 1 is estimated to be up to 40 mma–1, whereas that for accretion ice 2 is 20 mma–1 at about 3609 m depth (Reference Bell, Studinger, Tikku, Clarke, Gutner and MeertensBell and others, 2002). This suggests that the latter was annealed at temperature near the melting point for a longer time than the former. The dislocation density in ice decreases with decrease of growth rate almost linearly (Reference HigashiHigashi, 1974). The growth rate of the laboratory-grown single crystal was about 10 mma–1, which is far more rapid than those of accretion ices. However, the dislocation density of the laboratory sample was lower than those of samples from 3610 m. Therefore, the difference in dislocation density cannot be explained only by the difference in growth rate as in the case of accretion ice. This also suggests that the accretion ice has more or less been deformed after formation.
Concerning absolute values of dislocation density, the dislocation density determined by the X-ray rocking curve measurement was about four times as high as that determined by the etch-pit density measurement (Reference Sous, Hildmann and KaysserSous and others, 1997). Therefore, for example, the real dislocation density of the 3610 m sample could be reduced to the order of 107m–2, which is in good agreement with the result of the X-ray topography measurement (Reference Cullen and BakerCullen and Baker, 2002). To obtain absolute values of dislocation density, further improvement of the method is necessary.
Summary
Dislocation densities of accreted ice samples of different depths were determined by rocking-curve measurements. We first report that, in the accreted ice, lattice distortion tends to decrease with depth. However, the dislocation density does not reach a level typical for laboratory-grown columnar ice even at 3610 m. This reflects plastic deformation which accretion ice has undergone after its formation. For the glacier ice sample from 3202 m depth, the estimated dislocation density within grains is in a good agreement with the theoretical prediction. This method, if applied to samples from other depths, would give us important data to check simulation models in a future study.
Acknowledgements
This study was partially supported by the Japanese Ministry of Education, Science, Sports and Culture, Grant-in-Aid for Creative Scientific Research, 14GS0202, 2002/03. We are grateful to P. Duval and N. Azuma for helpful discussions.
Appendix
Our X-ray diffractometer was originally designed for measurements of thin-section samples like a silicon wafer, and the possible incident angle of X-ray is limited to be smaller than twice a Bragg angle for a certain reflection. Therefore, major reflections with lower Bragg angles (e.g. ![]() are not easily observed.
are not easily observed.
In this study, we consider a screw dislocation with a Burgers vector of ![]() to be the most probable, although this has not been experimentally confirmed. When
to be the most probable, although this has not been experimentally confirmed. When ![]() where
where![]() is the reciprocal lattice vector of the and reflection
is the reciprocal lattice vector of the and reflection ![]() is the Burgers vector, the dislocation cannot be observed by the reflection measurement (Bowen and
is the Burgers vector, the dislocation cannot be observed by the reflection measurement (Bowen and ![]() Tanner, 1998). For the reflection of one-third of of the six directions
Tanner, 1998). For the reflection of one-third of of the six directions ![]() belonging to
belonging to ![]() cannot be observed. From this point of view, the rocking curves for
cannot be observed. From this point of view, the rocking curves for ![]()
![]() reflections should be measured because of for any directions
reflections should be measured because of for any directions ![]() However, this reflection is not easy to find and its intrinsic width has not so far been reported. Therefore, we measured
However, this reflection is not easy to find and its intrinsic width has not so far been reported. Therefore, we measured ![]() reflections for all samples and analyzed their widths.
reflections for all samples and analyzed their widths.


