Introduction
Evidence from the deformation of radio-echo layers on the flow patterns within ice sheets has not yet been fully exploited. Studies by Reference Robin, de, Evans and BaileyRobin and others (1969) and Reference WhillansWhillans (1976) show layering as depositional in nature. Reference Hammer, Clausen and DansgaardHammer and others (1980) and Reference MillarMillar (1981) have explained this by demonstrating that a principal cause of layer echoes are layers of acidic ice containing volcanic impurities. In this paper, we describe layering in a variety of ice-flow and bedrock topography conditions, with particular reference to the three-dimensional flow of the ice around bedrock obstacles. Relevant observations from ice-fabric studies and seismic reflection work are summarized, and used as evidence for a model of ice flow in the lower part of ice sheets, which involves considerable changes of flow near the boundary between the upper, more rigid ice and the lower, warmer ice. Below the boundary, the stress and strain-rate systems are considerably influenced by bedrock relief, whereas above the boundary the dominant influence is that of the regional surface slope, although flow at all levels responds to a smoothed bedrock relief. The more variable deformation pattern in the basal layer causes the reflecting layers seen on radio-echo records to disappear in the basal zone.
Radio-Echo Layering
Radio-echo layers are commonly observed to lie parallel to the ice surface in the upper part of the ice sheet and to become progressively aligned with the bedrock in the lower parts. In the vicinity of centres of outflow in the Antarctic, layering is often observed to extend very close to bedrock (Fig.l). Moving away from a centre of outflow or an ice divide, horizontal motion becomes significant, and we observe an echo-free zone near to bedrock, as previously reported by Reference Robin, de, Drewry and MeldrumRobin and others (1977). This zone, which is generally several hundred metres thick, is widespread in East Antarctica and probably also in West Antarctica.
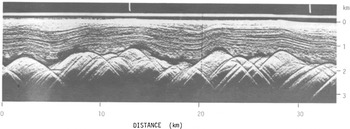
Figure.1. Radio echo-sounding Z-scope record from near Dome B, showing layering to bedrock (see Figure 3 for location).
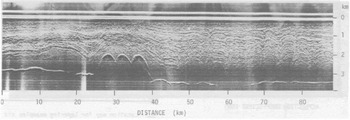
Figure.5. Radio echo-sounding Z-scope record along surface contour at site in East Antarctica (see Fig.3), showing undulations in layering believed caused by flow round bedrock obstacles up-stream.
To demonstrate that the lack of reflections in this zone is not simply due to inadequate system sensitivity, we look at returned power levels as well as the more familiar Z-scope recordings. The depth limits, to which Internal surfaces of given reflection coefficient may be detected with the radar, may be calculated as described 1n Reference Robin, de, Evans and BaileyRobin and others (1969) and elsewhere, and depend on observed or calculated temperature profiles and values of the temperaturedependent absorption coefficient. In central East Antarctica, we have been able to check these absorption estimates, using a smooth ice/water Interface above a subglaclal lake near Vostok, for which the reflection coefficient may be estimated within narrow limits. Good agreement between observed and calculated absorption losses suggests that our calculated figures are normally not more than a few dB in error. Where layering disappears due to absorption losses, we observe that the cut-off for layering at a particular site varies with reflection coefficient, strongly reflecting layers being detectable to greater depths than weaker ones, and this closely matches the predicted system detection limit. However, at many East Antarctic sites there is a sharp cut-off in layer echoes at a boundary well above the calculated detection limit (Fig.2(a)). This clearly indicates that suitable reflecting surfaces are absent below this level.
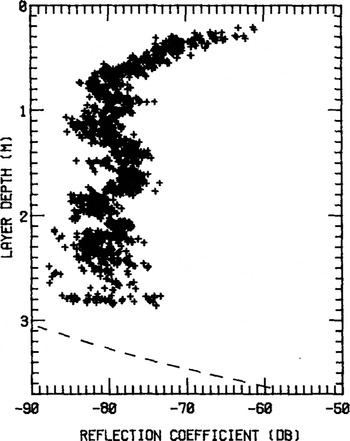
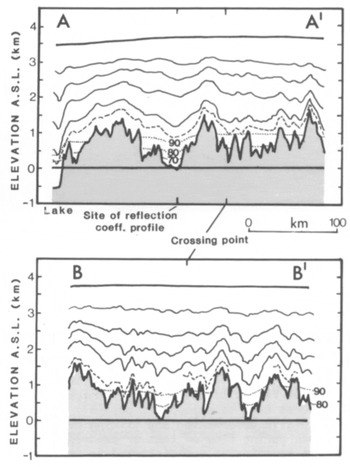
Figure.2(a). Layer reflection coefficient vs depth from many observations of layer echoes at site on line AA', and calculated system detection limit, indicating the existence of a basal echo-free zone
The extent and nature of this echo-free zone near an ice divide is shown in Figure 2(b), which shows selected layering along lines AA' and BB' (see Fig.3 for locations), together with estimated maximum depths to which surfaces of given reflection coefficient are expected to be seen with the radar. We note that most echoes below -600 m in Figure 2(a) have reflection coefficients of about -80 dB, so we attribute absence of layering 1n the basal ice of Figure 2(b) to the absence of suitable reflecting surfaces. As one moves to deeper and/or warmer ice, absorption losses limit the depth of observed layering more frequently, and this is the case for most of the interior of West Antarctica.

Figure.2(b). Profiles showing positions of selected radio-echo layers and surface and bedrock topography along lines down a flow line from the ice divide above Vostok (AA1) and along the crest of the ice divide (BB1). Dashed line represents the lowest visible layer; dotted lines represent calculated maximum depths to which surfaces with reflection coefficients of -70, -80, and -90 dB may be seen with the radar.
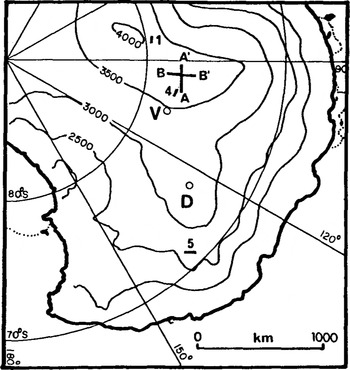
Figure.3. Location map for layering examples and surface contours. V: Vostok, D: Dome C camp, 1: site of record in Figure 1, AA', BB': profiles in Figure 2(b), 4: site of record in Figure 4, 5: site of record in Figure 5.
At many sites where such an echo-free zone is clearly developed (Fig.4), we also observe a transition zone between it and the layering above it of 100 to 200 m thickness, containing "broken-up" layering with very short horizontal continuity, and nearvertical cusps or "fingers" Reference Harrison(Harrison 1973). This indicates the presence of reflectors dipping fairly steeply and with considerable changes in the plane of dip along the flight line. Further from ice divides, these features tend to disappear, possibly because, after successive deformation and tilting over a variable bedrock during flow of tens or hundreds of kilometres, the layering is too distorted to produce consistent or recognizable cusps.
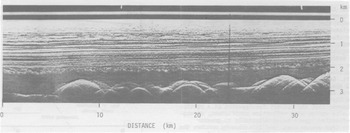
Figure.4. Radio echo-sounding Z-scope record along flow line above Vostok, showing basal echo-free zone, transition zone containing cusps and "finger" effects, and continuous layering above.
It has been pointed out in Reference Robin, de, Drewry and MeldrumRobin and others (1977) that deformation between visible layers is approximately uniform through the ice sheet, but, between the lowest visible layer and bedrock, deformation must be very variable as the lowest layers often do not follow the bedrock closely. This indicates that the flux of ice across deeper parts of the relief will be greater, and that ice flow must be diverted into these valleys from either side of the flow line. It appears that this diversion of flow takes place throughout the thickness of the ice
Clear evidence of the extent of a net sideways component of flow near bedrock comes from flights along surface contours in areas of smooth bedrock (Fig.5). Here we see that the layering has retained considerable undulations both from single large obstacles (10 to 15 km in the figure) and from complex flow over Irregular high relief further up the flow line (50 to 80 km). The retention of these features under steady flow conditions after the ice has passed the obstacles suggests some net transverse flow of ice at lower levels when passing obstacles, rather than simply uniform vertical deformation over an obstacle with no resultant sideways ice movement.
Ice-Fabric Studies
The development of a strongly oriented ice fabric with vertical c-axes occurs in the Byrd ice core between 1 000 and 1 810 m (Reference Gow and WilliamsonGow and Williamson 1976), below which the fabric is composed of "several discrete maxima generally arranged in a ring-Hke fashion around the vertical". Reference Gow and KohnenGow and Kohnen (1979) measured ultrasonic P-wave velocities both along and normal to the axis of the core and found a sudden drop of -100 m s−1 between 1 780 and 1 830 m, which, they believe, corresponds to a change in ice fabric. The maximum depth of radio-echo layering observed when flying over the borehole site was 1 800 m, but this is so close to the absorption limit that we are uncertain whether or not this marks the upper limit of the echo-free zone previously mentioned.
On the Law Dome, Reference Russell-Head and BuddRussell-Head and Budd (1979) found the highest horizontal shear rates at the lowest level of a zone containing a high concentration of vertical c-axes, and conclude that "the shear stress must decrease towards the bed after reaching a maximum in the region of the high shear layer located at about two-thirds of the ice thickness". They also suggest that the echo-free basal zone noted by Reference Robin, de, Drewry and MeldrumRobin and others (1977) may bear some relation to this slowly deforming basal layer.
The presence of additional acid impurities in the ice layers from which radio reflections are observed (Reference MillarMillar 1981) may also affect the mechanical properties. Laboratory studies (Reference Jones and GlenJones and Glen 1969) show that the addition of very small amounts of HF to pure ice causes appreciable softening; hence, it is possible that, when a strongly oriented fabric with a near-vertical c-axis is formed,the radio-echo layers indicate the easy glide plane and hence the icefabric orientation.It does not follow that all radioecho layers do so, but that they may if such orientation is present,as at Byrd.
Basal Seismic Reflecting Layer
Reference Bentley and CraryBentley (1971) has reported a widespread low amplitude seismic reflecting layer in West Antarctica, commonly of 200 to 400 m thickness above the bed. His observations show not only a single reflection from the top of this basal layer, but, at times, weaker reflections closer to bedrock within the layer. We have not been able to link this directly with observations of the radio-echo layer-free zone due to high absorption losses in West Antarctica; however, the thicknesses of the two types of layer are similar.
Bentley proposed three possible explanations: moraine within the ice, changes of ice fabric, or a layer of isothermal ice at the pressure-melting point. The first was his preferred explanation, but the Byrd ice core showed that moraine was confined to the lowest few metres of the ice, whereas, at Old Byrd station (15 km distant), the seismic reflecting layer extended to 460 m above bedrock in 2 480 m thick ice. Temperature measurements in the Byrd bore hole do not show a layer of Isothermal ice near to bedrock, and we conclude that Ice-fabric changes provide a general explanation rather than one applying to a few sites only, as suggested by Bentley. The seismic wavelength of ~40 m, together with a change In P-wave velocity of ~100 m s−1 over 5 to 10 m, should produce a reflection of 11.5% of the incident wave amplitude. Measured amplitude ratios lay in the range 0.3 to 13%.
Discussion
The observations presented above are all consistent with the following model, parts of which have been suggested in earlier studies in a two-dimensional context by several authors.
At centres of outflow, firn and ice are deposited with random crystal orientation, but, as flow and internal shear develop with increasing ice velocity, a strongly oriented fabric with a vertical c-axis develops Reference Whillans(Whillans 1979), so that flow is enhanced by a near-horizontal easy-glide plane at depths down to the basal layer. Below this, a multi-polar fabric (Reference Gow and WilliamsonGow and Williamson 1976) is caused by recrystallization, which, we suggest, is due to changes of stress and strain directions in three dimensions in response to varying bedrock slopes. If the interface between the two fabrics is sharp enough, it may produce the seismic reflections observed by Bentley over wide areas of West Antarctica, and also mark the level at which internal horizons become heavily deformed and radio-echo layering disappears. We envisage the ice sheet as comprised of fairly rigid but isotropic ice in the upper layers (accounting for perhaps 30% of the ice thickness), a central layer with strong vertical c-axis orientation (30 to 50% thickness), and a more isotropic crystal structure in the warmer basal ice (5 to 25% thickness). The central zone deforms mainly by shear in near-horizontal planes. Due to fabric change, there is a sharp decrease of shear below this oriented ice, as seen at Law Dome and probably at Byrd (Reference Russell-Head and BuddRussell-Head and Budd 1979) when one considers changes of ultrasonic velocities in ice core samples around this level (Reference Gow and KohnenGow and Kohnen 1979). The basal ice will respond more readily to the action of longitudinal and transverse stress differences than the ice above. Evidence from radioecho layering suggests this is important when bedrock slopes are of the order of 20° or more.
In order to discuss flow in the basal zone in the vicinity of bedrock peaks, we use the "principle of least action" which is not often applied to the flow of glaciers. We can state the principle as: "of all possible incremental displacements in an ice mass deforming under body and external forces, those which make the incremental work done a minimum defines the deformation". If it is energetically more favourable, therefore, deformation of the basal layers of ice will Involve a component of flow around a subgladal peak rather than uniform flow over the peak. If this occurs, it may affect layering downstream of the peak, since, if ice moves more readily around the peak than over the top, it may permanently distort the layering down-stream. This appears to explain the pattern of layering in Figure 5, which is located down-stream of an area of rough bedrock topography but which has Itself a smooth bed.
To estimate which types of deformation are energetically more favourable, we consider a simple vertical column model with uniform strain-rate for flow in a steady-state ice sheet, for which the vertical strain-rate ⋵z in two-dimensional flow can be written:
where H is the total ice thickness, A the accumulation rate, and u the horizontal velocity along the flow line in the x direction. When u = 0 at a centre of outflow, the vertical strain-rate is governed only by the surface accumulation rate and there is no shear over bedrock to introduce other factors to deform the ice column. Under these conditions, layering can extend to bedrock as seen in Figure 1. As soon as horizontal motion becomes significant, additional shear stress and strains are introduced, due to motion over an irregular bedrock. Typical figures for central East Antarctica may be A = 0.03 m a−1 and H = 3 000 m, giving εz = 10−5 a−1. According to Equation (1), the same strain would be introduced by horizontal movement of 1 m a−1 if dH/dx = 3x10⁻². Although surface slopes are around a third of this or less, bedrock slopes are much higher. Since velocities of 1 m a−1 are reached within 100 km of an ice divide, it appears that our vertical strain-rates could be dominated by the udH/dx term at distances of this order from ice divides and domes. We note that the echo-free zone usually starts to develop about 50 km from centres of outflow.
We can also use a simple vertical column model plus observations of surface slopes in central East Antarctica to compare the relative work of deformation due to longitudinal stresses and shear stresses. We note that driving stresses which are primarily basal shear stresses average around τb = 40 kPa in this region (Cooper and others 1982). From Robinson (1964), we note the presence of valleys up to 60 m deep in the ice sheet in the vicinity of the South Pole, which implies stress differences (σZ - σx) around ±300 kPa, in regions where ice velocity will be well below 10 m a−1. Work done for horizontal motion u will be uxD for basal shear, and (A - udH/dx).(σz - σx) due to the longitudinal strain. Work by the two processes would be equal if
so, using our approximate values for the stresses, this occurs when dH/dx = 40/300 = 1/7.5. We note on Figures 2(b) (AA') and 4 that, although bottom slopes along flow lines appear to exceed 1:7.5 frequently, the slope of the deep internal layers rarely exceeds 1:100. Thus, qualitatively at least, it appears that the energy involved in longitudinal deformation in the ice sheet remains substantially less than that involved in basal shear. This provides at least a partial explanation of why the upper level of the basal layer shows a much lower relief than the bedrock beneath along a flow line. Furthermore, along both flow lines and surface contours, vertical deformation between the surface and deepest reflecting horizon appears to be approximately uniform. Thus the tendency for flow to be diverted Into sub-Ice valleys running In the flow direction apparently takes place uniformly at all depths. A model which would largely satisfy this condition 1s one in which the longitudinal stress gradients are set up to overcome variations of basal relief and of basal shear stress, resulting in changes of surface elevation along the flow line. Where sub-Ice relief on either side of the flow line Is different, the elevation changes will produce surface slopes normal to the flow line, which, In turn, produce transverse stress differences (σz - σy) that cause vertical strain throughout the whole 1ce column, thus diverting 1ce to deeper areas.
We cannot assume that the stress differences (σz - σx) and (σz - σy) apply in the basal ice layer, as they interact with shear stress gradients dτzx/dx and dτyz/dy. Rapid changes of Ice fabric across this boundary would also be expected to cause rapid changes of flow. However, the lack of very rapid changes of the upper surface of the basal ice zone along flow lines, and the relative uniformity of thickness of this zone beneath surface contour lines shown on seismic reflection and radio-echo records, indicates that diversion of 1ce flow around subglac- Ial peaks Is not large except in the case of the steepest peaks (F1g.2(b)). In such cases, the constraint that near-bedrock ice movement must take place in planes parallel to bedrock, together with incompresslbility conditions, may be sufficient to cause some ice to flow around sharp peaks, but the field evidence suggests that this is not a frequent occurrence.
Conclusion
While two-dimensional analyses involve a gradual transition of ice velocity from flowing parallel to the bed to flowing approximately parallel to the surface, the field evidence presented above suggests, when considered as a whole, that the transition between shear controlled by bedrock surfaces and shear controlled internally due to mean surface slope, takes place within thick ice sheets at a relatively sharp boundary around the upper limit of the radioecho non-reflecting zone.
Acknowledgement
We should like to thank the US National Science Foundation for logistic support, the US Navy Squadron VX6, whose aircrews undertook the flying programme, and the UK Natural Environment Research Council for research funding. One of us (DHMM) wishes to thank NERC for support In the form of a Research Studentship.