


Introduction
There has been much recent field and laboratory research that has gathered substantial data on the Filchner Ronne Ice Shelf. Ice velocity, strain rate, surface elevation, thickness and internal structure have been investigated by a variety of methods including satellite altimetry, radio-echo sounding and seismic surveying. Shallow pits and cores have investigated the upper firn layers and deep hot-water and mechanical drills have penetrated the entire ice-shelf thickness. Analysis of retrieved cores has included chemical, isotopic and conductivity measurements. Until now, however, no laboratory study has investigated ice-mechanical properties. In the main, this has been due to the shortage of sufficient quantities of ice cores for a systematic investigation to be undertaken. Now the deep-hole coring expeditions of the Alfred-Wegener-Institut (AWI) to the Ronne Ice Shelf in 1990 and 1992 have made available sufficient quantities of large-diameter ice cores to facilitate the examination of the fracture and short-term rheology of Antarctic ice. The aim is to apply the derived material parameters to help explain the mechanics of specific ice-shelf processes such as crevasse formation and tidal flexure.
We are currently developing a number of techniques for investigating the fracture and mechanical properties of cylindrical ice cores using unique cold-room facilities and testing apparatus at University College London (UCL), A three-point bend method (Fig. 1a) allows the investigation of crack growth from an artificial notch in a direction perpendicular to the ice-core axis. One-half of this specimen can subsequently be used for uniaxial compression testing (Fig. lb), in which it is possible to determine crack nucleation and ice-rheological parameters. We describe both of these methods in this paper and present our first results on Antarctic ice cores along with some preliminary analysis of how fracture-mechanics results may be applied to ice shelves. Our current work is ongoing and we have also designed apparatus to investigate crack growth parallel to the ice-core axis using a notched short-rod specimen (Fig. 1c).
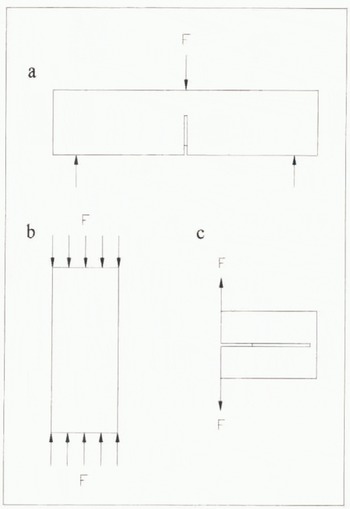
Fig. 1. Experimental geometries for measuring the fracture and mechanical properties of a cyclindrical ice core: (a) three-point head testing, (b) uniaxial compression testing, (c) short-rod testing. Methods (b) and (c) each use one-half of the specimen used for method (a).
Fracture Mechanics
Central to the development of our experimental approach has been the need to measure accurately a material parameter called the fracture toughness for natural ice. In linear elastic fracture mechanics, the tensile, or Mode I, stress-intensity factor, written K 1, describes the magnitude of the stresses around a crack tip and depends simply on the applied load and crack geometry. This stress-intensity factor has a critical value, written K IC, for which rapid, unstable tensile crack propagation will occur—this is the fracture toughness. In the general case, we may write
where σ is the applied stress, a c is the critical crack length and α is a geometrical factor. For example, in the case of an initially stable crack the critical stress-intensity factor can be achieved either through an increase in the remotely applied stress, or an increase in the crack length. In principle, fracture toughness is a scale-independent parameter and a true material property. However, its experimental determination commonly involves a number of inherent assumptions concerning, for example, the homogeneous, isotropic and linear elastic nature of the material, the nature of the crack being propagated and the influence of test geometry on crack propagation. For this reason, Dempsey (1991), whilst critically reviewing the ice-fracture toughness literature, has recommended following normal practice in the study of brittle rocks and ceramics by using the notation K Q as an “apparent” fracture toughness to represent symbolically the inherent assumptions involved. This notation will therefore also be adopted here.
Ice Core Morphology and Specimen Preparation
The ice cores we have tested have come from three boreholes drilled by AWI during 1990–92 at two sites on the Ronne Ice Shelf (Oerter and others, 1992, 1991) the first about 150 km northwest of Berkner Island about 50 km from its margin with the Weddell Sea (boreholes B13 and B14), the second a further 200 km upstream of this (borehole B15). These deep cores are 72 and 100 mm in diameter, taken to depths of 215 and 320 m in regions where the total ice thickness is 233 and 422 m, respectively. Within the ice mass, firn of meteoric origin undergoes gradual changes in porosity, crystal size and crystal fabric with depth, before giving way abruptly to a basal layer of marine origin at about 153 m depth. The textural and physical properties of the cores has already been reported (Eicken and others, 1994; Oerter and others, 1994), There are obviously differences between the cores from the two sites but, of the ice we have tested, all the firn and shallow meteoric ice specimens (down to 54 m), as well as the shallow marine ice specimens (160–180 m), have come from the B13/B14 site; all the other ice is from BI5. For the purpose of presenting preliminary results, we will represent these data as a single ice-shelf profile.
We have so far completed two suites of tests on 13 large core pieces, up to 57 cm in length. All the ice has been kept in storage at AWI and UCL at a temperature of 30°C. Three horizontal thin sections have been taken from each core piece, at the upper and lower extremities and also at the centre, immediately adjacent to the fracture surface after completion of the initial three-point bend tests. Grain-size was examined using enlarged photographs of the thin sections taken under crossed polarizers. The mean grain diameter was deduced by counting the number of grains per unit area of planar cross-section, assuming spherical geometry. The measurements are shown in Figure 2 and comply with those made by Eicken and others (1994) in which grain-size was found to increase linearly with depth down to about 120 m before becoming more variable. The solid line in this figure follows the trend of the data from the central section of each core piece. The grain-size of the marine-ice specimens is highly varied. Data triplets at near-identical depths indicate the variation in crystal size within a single specimen. This is negligible at shallow depths but very significant within the marine ice.
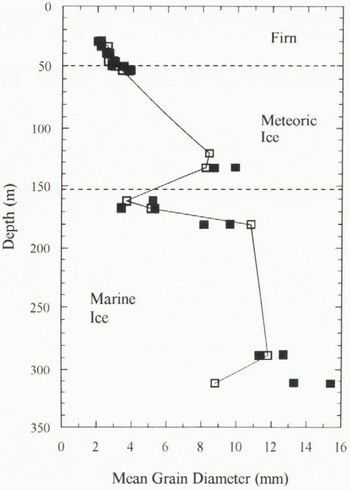
Fig. 2. Grain-size measurements taken from sections at the centre (◽) and extremities (◾) of each initial core-test piece. The solid line follows the trend of the data from the centre, adjacent In the three-point bend-fracture surface.
Prior to testing, each specimen was precisely machined to size using an adapted metallurgical machine lathe contained in a cold room at −10°C, For the three-point bend tests, a thin notch was cut at the centre of the cylindrical specimen using a sharp, thin, chisel-type blade. The blade and specimen were fitted to a modified histological microtome so that the notch could be cut by slicing in small increments to the required depth. Accurate machining of the specimens has allowed precise determination of specimen volume, and hence density, for the ice tested. It was found that the density measurements conformed closely with those deduced from weighing and measuring of core pieces immediately after drilling and from subsequent continuous gamma-ray absorption measurements on the BI5 core (Gerland and others, 1994; Oerter and others, 1994). These have indicated that density, ρ, is roughly constant in the deeper meteoric ice (72–153m; ρ = 896 ± 9 kg m−3) and also in the basal marine ice (below 153 m; ρ = 911 ± 6 kg m−3), but it is best described by a polynomial function above 70 m (see Fig. 3).
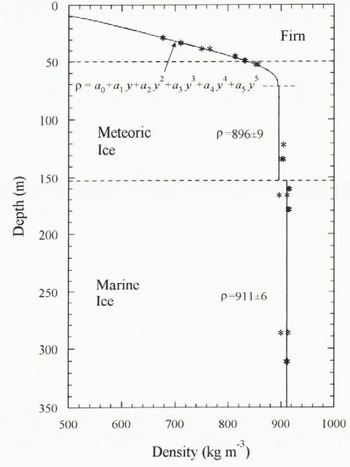
Fig. 3. Ice-core density profile. Data points (*) represent measurements from individual test specimens. The solid line represents a continuous analysis of the entire core with a polynomial best fit above 70 m depth and simple averages for the deep meteoric and marine ices.
Experimental Methodology
The experimental methods described below have made use of a large 20 tonne servo-hydraulic load frame normally used for testing rocks in the laboratories at UCL. The frame has been fitted with an Instron environmental chamber which is cooled using liquid N2, controllable to within 1°C (all tests were conducted at −20°C). The chamber has a large internal volume (~90 1j to incorporate ice-core specimens, test fixtures and measurement transducers, and includes a viewing window for direct observation during testing.
Fracture-toughness testing
A three-point bend method for determining the apparent fracture toughness, K Q, of cylindrical specimens has been developed following the recommendations of the International Society for Rock Mechanics (ISRM) Commission on Testing Methods (1988). The technique allows the investigation of fracture propagation perpendicular to the ice-core axis and also allows examination of ice elasticity. During testing, a specimen rests on two support rollers and a compressive load is applied in increasing stress cycles above an artificial V-shaped ligament which opens in tension (Figs 1a and 4). Strict geometrical constraints are imposed on the specimen size and notch dimensions in order to ensure plane strain conditions. In particular, the distance between the lower support points is always 3.33D, where D is the specimen diameter, and the depth to the tip of the V-shaped ligament is 0.15ZD. The test-specimen diameters used in this study were in the range 60–100 mm.
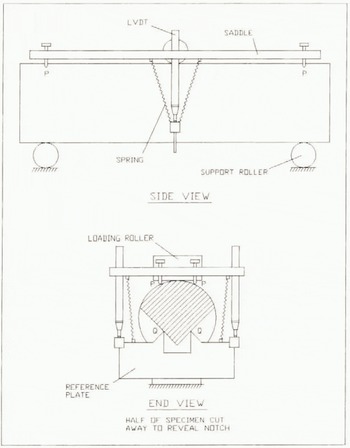
Fig. 4. Notched three-point bend specimen for fracture toughness testing, showing arrangement for measuring precise bending deflection.
For accurate assessment of the elastic modulus, precise measurement of the bending deflection of the specimen is necessary. This is achieved by the displacement measurement system shown in Figure 4. Here, a saddle plate rests on points, P, directly above the lower support rollers. A thin reference plate is inserted into the notch so that it rests on points, Q, along the notch front and is connected to the saddle by springs. Two spring-loaded linear-variable differential transformers (LVDTs) measure the displacement between points P and Q as the specimen bends. This method ensures that indentation of the ice by the loading rollers, and other interface effects, are not included in the measured displacement.
During testing, the loading roller was advanced and retreated at a fixed rate (≈ × 10−6 ms−1) controlled by an external displacement transducer connected to a servo-controlled hydraulic actuator. The corresponding loading rate was 10–30 kPa ![]() , depending on specimen size, so that failure occurred within 5–15s in a single loading cycle. The specimen-measurement LVDTs were not used for control purposes because of the potential for instability during crack growth. The principle of the test methodology is that the applied load initiates a crack at the sharp notch root which then increases in length as it grows upwards in-plane through the specimen. The cyclic loading is intended to promote incremental crack growth prior to failure, with any new crack growth being inferred from changes in specimen compliance. The point at which K
Q is evaluated is that at which the stress-intensity factor as a function of crack length is a minimum. For an “ideal” linear-elastic material, this simply occurs at peak load. If, however, there is significant elastic-plastic deformation, or if residual bending stresses in the specimen are important, the evaluation point has to be independently determined for each specimen. This is normally done by assessing the “degree of non-linearity” during the cyclic loading sequences (see ISRM Commission on Testing Methods, 1988).
, depending on specimen size, so that failure occurred within 5–15s in a single loading cycle. The specimen-measurement LVDTs were not used for control purposes because of the potential for instability during crack growth. The principle of the test methodology is that the applied load initiates a crack at the sharp notch root which then increases in length as it grows upwards in-plane through the specimen. The cyclic loading is intended to promote incremental crack growth prior to failure, with any new crack growth being inferred from changes in specimen compliance. The point at which K
Q is evaluated is that at which the stress-intensity factor as a function of crack length is a minimum. For an “ideal” linear-elastic material, this simply occurs at peak load. If, however, there is significant elastic-plastic deformation, or if residual bending stresses in the specimen are important, the evaluation point has to be independently determined for each specimen. This is normally done by assessing the “degree of non-linearity” during the cyclic loading sequences (see ISRM Commission on Testing Methods, 1988).
We found that, for the Antarctic ice we tested, unstable fracture propagation almost always occurred with the first crack increment. Typical behaviour for firm ice is shown in Figure 5. The repeated stress cycles shown in figure 5a did not result in crack growth and so the compliance of this specimen, indicated by the slope of the load-displacement plot of figure 5b, remained unchanged. A different specimen, illustrated in figure 5c, does display a change in its load-displacement slope prior to failure, indicating that stable crack growth had occurred during the penultimate cycle. In fact, this was the only specimen that behaved this way and was the shallowest specimen we tested, taken at 29.8m depth. It should be noted that all loading curves remained remarkably linear, although there is a small hysteresis effect (Fig. 5b and c). The non-linearity near the peak of each load-time cycle (Fig. 5a) is due to roller indentation, effectively lowering the deformation rate, since this was externally controlled. The sudden unstable fracture propagation may have been triggered by a release of stored energy in the testing arrangement, perhaps because of indentation of the loading rollers into the ice surface. On the other hand, it may merely reflect the remarkably brittle nature of ice, which is well known to retain high strength and brittleness to exceptionally high homologous temperatures, comparable only to covalent and hydrogen-bonded ceramics (Gandhi and Ashby, 1979; Rist and Murrell, 1991).

Fig. 5. Typical cyclic loading behaviour of firn ice during three-point bend testing at −20°C. (a) and (b). Ice from 34.5 m depth where failure occurs abruptly without prior crack growth. (c) Ice from 29.8 m depth for which a change in specimen compliance indicates incremental crack growth.
For this type of unstable crack propagation, we have evaluated K Q by arbitrarily assuming a degree of crack growth that minimizes K 1 for the test geometry — this occurs when the crack has advanced approximately 0.15D from the tip of the chevron ligament, assuming linear elasticity. This is realistic, considering the apparent elastic response of the material (which also makes an assessment of the degree of non-linearity unnecessary). However, our derived values of K Q should be considered a lower-bound estimate for the fracture toughness of this type of ice until implementation of the short-rod test (Fig. 1c), which will help resolve the issue. The short-rod geometry has been shown by Stehn and others (1995) to promote stable crack growth in natural pond ice.
Uniaxial compression testing
We have developed a compression-testing method that allows investigation of crack nucleation, elasticity and short-term rheology during a single test on one-half of the specimen previously used for the three-point bend fracture test, described above. In this case, the cylindrical ice core is loaded along its axis in pure uniaxial compression until the formation of the first few cracks occurs. At this point the specimen is rapidly unloaded and then allowed to relax.
The simple experimental arrangement is shown in Figure 6. The specimen is deformed by advancing a loading ram under servo-control at a fixed nominal strain rate (≈ 1 × 10⁻⁵s−1), determined by external displacement transducers connected to the hydraulic actuator. Specimens were dimensioned so as to provide a length) diameter ratio as close to 2.5: 1 as possible. This is in accordance with standard practice in rock-mechanics testing (Jaeger and Cook, 1979), in order to promote a uniform stress field in the central part of the specimen without tending to induce buckling. Precise measurements of true specimen strain were made using subminiature friction-free LVDTs embedded directly into the ice surface. These measured strain over the central half of the specimen where deformation was most homogeneous.
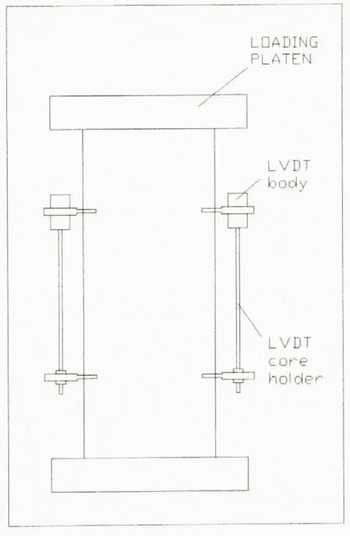
Fig. 6. Experimental set-up for uniaxial compression testing.
Typical deformation behaviour of Antarctic marine ice during this type of testing is shown in Figure 7. The crack nucleation stress was determined by visual means, using video recording and the naked eye where possible, and also by the onset of acoustic emissions. The latter occur as a rapid release of energy associated with local stress relaxations in the ice, generating transient elastic waves. These are detected by a piezoelectric transducer attached to the ice surface, amplified and then analysed using commercial monitoring equipment (for details see Rist and Murrell (1990)). Although loading is compressive, crack nucleation still occurs as a result of tensile mismatch stresses at grain boundaries and the crack size is of the order of the grain diameter. Under uniaxial stress, cracks tend to form with their long axes in the direction of maximum compression, parallel to the specimen axis. The stress at which these new cracks start to form can he used to infer the effective tensile-fracture toughness K Q.
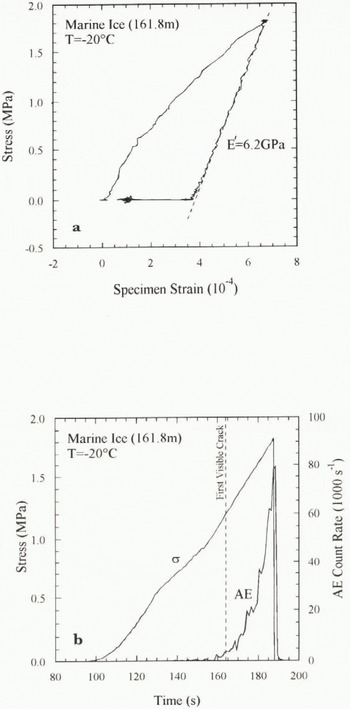
Fig. 7. Typical deformation of marine ice during uniaxial compression and subsequent relaxation at −20°C. (a) Stress–strain history including elastic unloading behaviour. (b) Stress and acoustic emission (AE) count rate versus time, showing how visual cracking closely correlates with AE onset.
Alter a few cracks have formed, the specimen is rapidly unloaded, in less than 250 ms, and then allowed to relax. The intention is to induce as little damage as possible through cracking, so that the ice elastic and rheological properties can be accurately assessed. The effective elastic modulus, Eʹ, is determined directly from the recovered strain in the linear part of the unloading curve (Fig. 7a). During relaxation the time-dependent delayed elastic component of the creep strain is recovered and the remaining strain is the permanent viscous component. These rheological data are currently being analysed.
Results And Analysis
Measured elastic moduli
Deformation of the ISRM three-point bend geometry has been evaluated by Matsuki and others (1991) using boundary-element analysis. The elastic modulus is given by
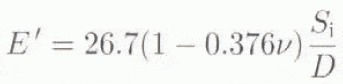
where S i is the slope of the linear load-displacement curve (Fig. 5b), D is the specimen diameter and ν = 0.33 is Poisson’s ratio. For the bending tests. Eʹ was determined for each loading cycle and then an average taken. For the compression tests. Eʹ was calculated directly from the true specimen strain and applied stress.
The measured elastic moduli of the lest specimens is shown in Figure 8. It can be seen that the modulus increases with depth through the firn before reaching a constant value of around 6 ± 1 GPa within the dense meteoric and marine ice, apparently reflecting changes in ice density (Fig. 3) but not grain-size (Fig. 2) or ice type. The compression data exhibit much less scatter than the three-point bend data, probably because of the nature of the displacement measurement system which was intrinsically more stable for the compression tests, being embedded into the ice surface rather than resting on point contacts, and also measured larger deformations. It is difficult to make direct comparisons with other work because of the strong dependence of the measured moduli, for example, on ice type, porosity, impurity content and loading regime. High-frequency acoustic wave-velocity measurements indicate a value for the dynamic Young’s modulus of pure fully dense polycrystalline ice to be about 9 GPa (Hobbs, 1974), but it is well known that static measurements of ice elasticity are dependent on the time of loading and magnitude of the applied stress. This is because of the contribution to deformation from the delayed elastic and viscous components of the creep strain (see Sinha, 1978). It may be somewhat surprising, therefore, that the two test methods have produced similar results and that deformation is so apparently linear-elastic. However, for the cyclic bending tests, the duration of loading is roughly an order of magnitude higher than that during unloading after compression, but the applied stresses are approximately an order of magnitude lower, and hence the error due to non-elastic effects may be similar. The observed linear elasticity is explained because, over short periods of time, the delayed elastic contribution is itself pseudo-linear. In any case, until the ice rheology is fully characterized, the values represented in Figure 8 are best considered as “effective” moduli representing relative changes in elastic properties through the ice shelf.
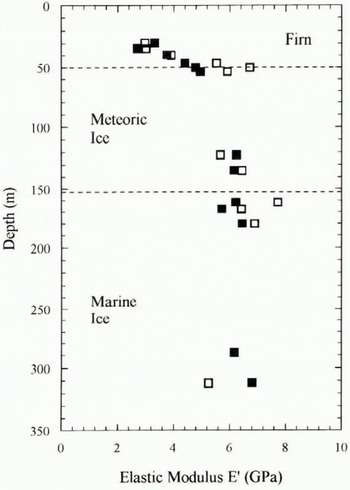
Fig. 8. Measured elastic moduli of Antarctic ice specimens from three-point bend (◻) and compression tests (◼) at −20°C.
Fracture toughness
During the fracture-toughness tests, we assume linear-elastic behaviour and a constant fracture toughness with crack length so K Q coincides with the peak load. F max, and is calculated from
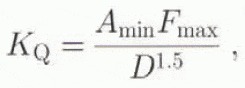
where A min is the minimum non-dimensional stress intensity factor (ISRM Commission on Testing Methods, 1988). Matsuki and others (1991) have found A min = 9.455 using boundary element analysis of the ISRM three-point bend specimen.
The variation of apparent fracture toughness with depth is presented in Figure 9. One data point at a depth of 288 m, present in all other figures, is missing from this diagram because of premature specimen failure during testing. The trend is for increasing K Q with depth through the firn and meteoric ice, followed by an apparent drop within the marine ice. However, it is important to clear up any specimen grain-size effect at this point. We have conducted a number of similar tests on laboratory-manufactured high-density (ρ = 912 ± 3 kg m−3), pure, isotropic, polycrystalline ice specimens of fixed but controlled grain-size. Specimen diameters were varied between 40 and 70 mm with average grain-sizes between 2 and 8 mm to produce specimens with between 6 and 35 grains intersecting a line through the diameter when viewed in planar cross-section. Results are plotted in Figure 10 for tests conducted between −10° and −25°C, for which there is little influence of temperature. It can be seen that the scatter in the data is small provided there are more than about 15 grains across the specimen diameter. All of the Antarctic specimens with mean grain-sizes below 6 mm (see Fig. 2) satisfied this condition and are the most reliable. However, the results for the deepest meteoric-ice and deepest marine-ice specimens should be treated with caution.
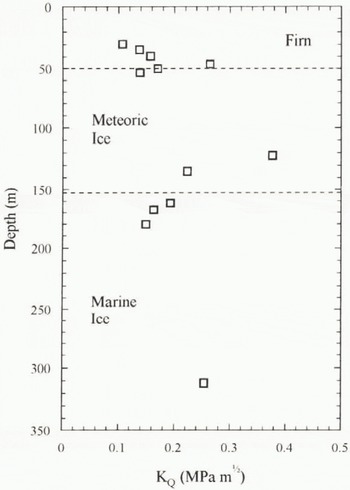
Fig. 9. Apparent fracture-toughness measurements for Antarctic ice from three-point bend tests at −20°C.
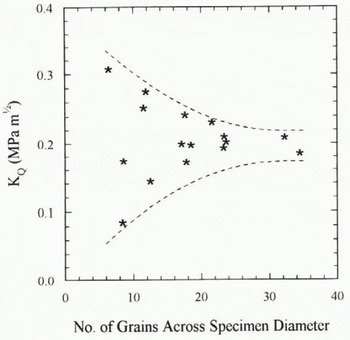
Fig. 10. Apparent fracture-toughness measurements for pure laboratory-ice specimens of varying grain-size. T = −10° to −2°C.
Because of the unique nature of the ice we have tested, there are very little other data with which our K
Q values for Antarctic ice can be directly compared. However,
Fischer and others (1995) have recently investigated the apparent fracture toughness of a shallow firn core from the Greenland Ice Shelf Project using a modified ring test and found a mean value of 0.109 MPa m![]() for ice from 26–27 m depth (average ρ = 605 kg m−3). This value can be compared with our shallowest firn-ice specimen from a slightly greater depth (30 m; ρ = 677 kg m−3) which coincidentally yielded a near-identical K
Q value of 0.107 MPa m
for ice from 26–27 m depth (average ρ = 605 kg m−3). This value can be compared with our shallowest firn-ice specimen from a slightly greater depth (30 m; ρ = 677 kg m−3) which coincidentally yielded a near-identical K
Q value of 0.107 MPa m![]() . Nixon and Schulson (1986) have investigated the fracture toughness of high-density laboratory-made isotropic polycrystalline ice over a range of grain-sizes (d = 1.6–9.3 mm; 10–50 grains across their 90 mm diameter specimens) and found K
Q = 0.067–0.096 MPa m
. Nixon and Schulson (1986) have investigated the fracture toughness of high-density laboratory-made isotropic polycrystalline ice over a range of grain-sizes (d = 1.6–9.3 mm; 10–50 grains across their 90 mm diameter specimens) and found K
Q = 0.067–0.096 MPa m![]() with little dependence on grain-size and none of the scatter for large grain-sizes we present in Figure 10. However, Nixon and Schulson used circumferentially notched cylinders for their tests which Dempsey (1991) argued were sub-sized and notch insensitive, always producing low estimates of fracture toughness. This is borne out by the more recent work of Weber and Nixon (1992), who tested ice manufactured in the same manner, albeit of smaller (1.2–1.8 mm) grain-size, using a four-point bend configuration and found K
Q = 0.150 MPa m
with little dependence on grain-size and none of the scatter for large grain-sizes we present in Figure 10. However, Nixon and Schulson used circumferentially notched cylinders for their tests which Dempsey (1991) argued were sub-sized and notch insensitive, always producing low estimates of fracture toughness. This is borne out by the more recent work of Weber and Nixon (1992), who tested ice manufactured in the same manner, albeit of smaller (1.2–1.8 mm) grain-size, using a four-point bend configuration and found K
Q = 0.150 MPa m![]() . Our pure-ice results indicate K
Q ≈ 0.2 MPa m
. Our pure-ice results indicate K
Q ≈ 0.2 MPa m![]() , which is higher still but may merely reflect the different ice- manufacturing technique which results, for example, in a higher distributed bubble content.
, which is higher still but may merely reflect the different ice- manufacturing technique which results, for example, in a higher distributed bubble content.
Crack nucleation stress
The crack-nucleation data derived from the compression tests are plotted in Figure 11. The nucleation stress, σnuc has been multiplied by the square root of the mean grain-size, d, to facilitate comparison with the fracture-toughness data. This is justified because new cracks in compression are derived from precursors whose magnitude depends on grain-size (Sunder and Wu, 1990), and so we can write
although it is difficult to assess the constant of proportionality at this stage. The trend of the data in Figure 11 is strikingly similar to that of the K
Q values in Figure 9, with σnuc
![]() increasing through the firn and meteoric ice before a sharp decrease at the transition to marine ice. The compression data again appear to exhibit less scatter. It should be noted that the nucleation data reflect fracture resistance parallel to the ice-core axis, since this is the direction of the induced tensile cracking in the overall applied uniaxial compressive stress field.
increasing through the firn and meteoric ice before a sharp decrease at the transition to marine ice. The compression data again appear to exhibit less scatter. It should be noted that the nucleation data reflect fracture resistance parallel to the ice-core axis, since this is the direction of the induced tensile cracking in the overall applied uniaxial compressive stress field.
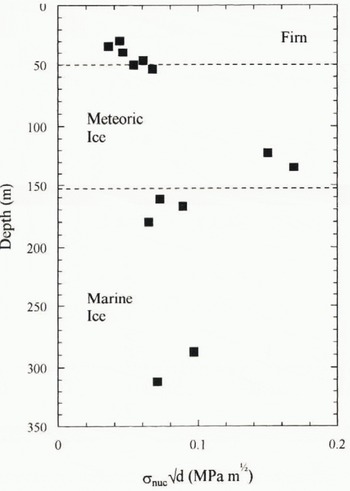
Fig. 11. Crack nucleation data for Antarctic ice from uniaxial compression tests at −20°C.
Gagnon and Gammon (1995) have found the flexural strength of glacier ice to be dependent on bubble content and suggested that intragranular air bubbles increase ice strength by accommodating greater strain and reducing stress concentrations, while grain boundary bubbles act to weaken the ice. Increasing grain boundary recrystallization and migration with depth tends to decrease the proportion of intergranular bubbles and may help explain the trend for increasing resistance to fracture through the firn and meteoric ice. Similarly, the concentration of inclusions at grain boundaries in the marine ice may help explain its apparent weakness.
Application to ice-shelf deformation
In order to put our mechanical test results into perspective, we tentatively apply our laboratory data to ice-shelf deformation using a simple fracture model. Fracture mechanics has previously been applied to the problem of crevasse penetration by Smith (1976), albeit without the benefit of any fracture toughness data. Smith modelled a crevasse as an edge crack in an infinite half-plane subject to a uniform tensile stress plus a linearly increasing overburden pressure with depth. We refine this model by incorporating the true near-surface density-depth profile for this region of the Ronne Ice Shelf, ρ = ƒ(y), which is a polynomial in y of degree 5 (see Fig. 3; a0 = 349.95, a 1 = 22.739, a 2 = −0.84789, a 3 = 2.3101 × 10⁻², a 4 = −2.9257 × 10⁻⁴, a 5 = 1.3131 × 10⁻⁶). The total horizontal stress, σ x (y), at depth y within the ice can then be written simply as
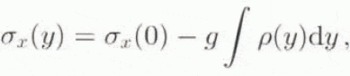
where σx(0) is an arbitrary tensile surface stress and ɡ is the acceleration due to gravity (Fig. 12a). The stress-intensity factor. K I, for an edge crack loaded by a polynomial stress in this way can be found in the literature (Stallybrass, 1970) and
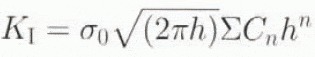
where h is the crack half-length (or crevasse depth). The constants, Cn , and reference stress, σ0, are derived by rewriting σ x as a polynomial of order n.
For the geometry described above, K I varies with crevasse depth as shown in figure 12b. In this figure, contours have been drawn for three different surface stresses in the range 150–250 KPa, typical of the Ronne Ice Shelf (Vaughan, 1993). Where K I is less than the fracture toughness (K IC, as estimated from our experimental K Q values) the crevasse will remain stable, where K I is greater than K IC the crevasse will grow rapidly. The figure shows that provided the initial crack is above a sufficiently small size to raise K I above K IC it will grow to a depth of about 40–60 m, depending on the surface stress, before K I again falls back below the critical value and crack growth stops. Intermediate crevasse depths are simply not stable.
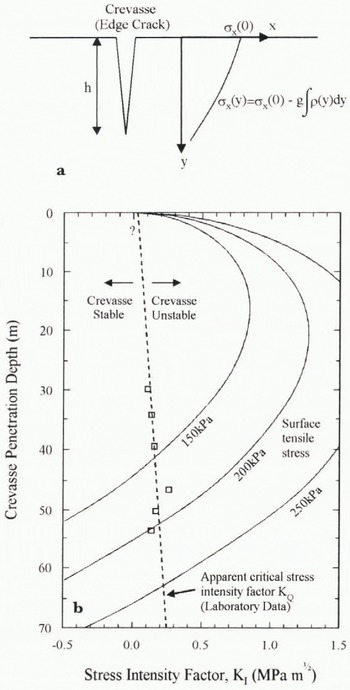
Fig. 12. Simple fracture-mechanics model of surface crevassing. (a) Crevasse as an edge crack in an infinite half-plane. (b) Stress-intensity factor for various crevasse depths ploted as contours for different arbitrary surface stresses (solid lines). The trend of the apparent critical stress-intensity factor has been inferred from experimental data (dashed line).
A detailed field examination of surface crevasse depths has not been undertaken but their shallow penetration depth, of the order predicted here, has been widely acknowledged (e.g. Paterson, 1994). The most intriguing feature of this model, from a mechanistic point of view, is the nature and size of any “starter” crack. Because we have been unable to test ice from the upper firn, we cannot make a precise prediction as in the potential size of starter cracks. However, using the K Q value for the shallowest ice, we have estimated that the starter-crack size is no greater than 10–40 cm for realistic ice-shelf surface stresses. It is difficult to establish whether such small cracks in the ice surface actually exist, because any new crack is likely to become rapidly covered or filled with snow.
We are currently applying this simple model to water-filled bottom crevasses which have been observed to penetrate much deeper into the ice-shelf thickness.
Summary
Laboratory experiments have been performed to investigate the fracture and mechanical behaviour of ice from the Ronne Ice Shelf. The following conclusions may be drawn from the preliminary results and analysis:
-
i. Within the ice shelf, the effective elastic modulus increases with depth through the firn before reaching a constant value of 6 ± 1 GPa in the dense meteoric and marine ice. This trend reflects the change with depth of ice density, which may be the dominant influence on the observed behaviour.
-
ii. The resistance to fracture, as measured by changes in apparent fracture toughness and crack-nucleation stress, increases with depth through the firn and dense meteoric-ice layers. An observed drop in the marine ice is questionable, because of a probable grain-size effect in some deep specimens and requires further investigation.
-
iii. For typical ice-shelf surface stresses, a simple fracture-mechanics model predicts crevasse penetration depths of about 40–60 m from the trend of the experimental data. The model also predicts that crevasses initiate at the surface from starter cracks no greater than 10–40 cm deep.
Acknowledgements
The experimental work presented in this paper was funded by the Natural Environment Research Council under research grant number GR3/9170. Support for collaboration between University College London and the Alfred-Wegener-Institut was also provided by the British Council. The authors are grateful to reviewers J. P Dempsey and R. E. Gagnon for their valuable comments on the manuscript.


