


1. Introduction
Water content has long been recognized as an important control on the dynamics of temperate glaciers. The pioneering experimental work of Reference DuvalDuval (1977), using ice samples from temperate glaciers and water contents of 0.01–0.8%, showed a linear relationship between water content W (given as %) and the rate factor A0 in Glen’s flow law (Reference Lliboutry and DuvalLliboutry and Duval, 1985):
The above dependence has a noticeable effect upon the dynamics of temperate glaciers, since Reference LliboutryLliboutry (1983) reported that the water content of basal ice of such glaciers typically varies between 0.6% and 0.95%, with a corresponding increase in effective strain rate by a factor of 1.3. This factor would be 3 for the case of the full range 0.01– 0.8% of W from which Equation (1) is derived.
Direct measurements of W in temperate glaciers have given values of 1–1.7% (Reference LliboutryLliboutry, 1971; Reference Dahe, Zielinski, Germani, Jiawen, Wang and WangRaymond and Harrison, 1975). Water content can also be estimated by indirect measurements, through the relation between radio-wave velocity and water content discussed in section 5. Such measurements have given values up to 4.1% for temperate glaciers (Reference Murray, Stuart, Fry, Gamble and CrabtreeMurray and others, 2000) and up to 5.06% for temperate ice of polythermal glaciers (Reference Macheret, Moskalevsky and VasilenkoMacheret and others, 1993).
Although radar methods have been recognized as an indirect tool for determining water content in temperate ice, we have no knowledge of any previous use of seismic methods for such apurpose. Therefore, we used both seismic and radar data, collected at coincident profiles in a temperate glacier, with the aim of comparing their suitability for the estimation of water content in temperate ice. We shall show that the two methods complement each other in accomplishing this task, as they do for the study of ice thickness, glacier internal structure and bed and subglacial conditions.
2. Geographical Setting
The fieldwork was done at Johnsons Glacier, a temperate ice mass located on Livingston Island, South Shetland Islands, Antarctica (Fig. 1), at 62°40’S, 60°30’W. It is a tidewater divide (200–330ma.s.l.) that defines it as a separate unit (glacier basin) within the Hurd Peninsula ice cap. The glacier terminates in a 50 m high ice cliff extending 500 m along the coast and covers a total area of about 5km2. The basement consists of sandstones Johnsons Bay side) and contact metamorphic rocks (Reference Raymond and HarrisonSmellie and others, 1995). Thermally, it is a temperate glacier, as revealed by temperature and density profiles measured at boreholes (Reference Furdada, Pourchet and VilaplanaFurdada and others, 1999; M. Pourchet and J.M. Casas, unpublished data). This is a rather unusual feature of Antarctic glaciers, though usual for glaciers in the South Shetland Islands, where typical summer temperatures at sea level are a few °C above zero. The flowlines in the northern part are shorter and have larger slopes (e.g. -10° for L4 in Fig. 1) than those in the southern part (e.g. ∼6° for L3 in Fig. 1). The confluence of the northern and southern flows results in a folded and highly fractured terminal zone (Reference RiznichenkoXimenis, 2001). Ice surface velocities increase downstream from the ice divide, reaching values of about 40 ma–1 near the glacier terminus (Reference RiznichenkoXimenis, 2001). The different orientations of the northern and southern flowlines relative to the prevailing northeasterly wind direction (Reference RiznichenkoXimenis, 2001) result in a larger accumulation in the northern sector. Accumulation and ablation rates show a large spatial and temporal (yearly) variability, with maximum accumulation rates of about 1mw.e. a–1 and maximum ablation rates of –4mw.e. a–1 measured during the last 7years (Reference RiznichenkoXimenis, 2001; F. Navarro, unpublished data). The equilibrium-line altitude is about 150m in the northern area and 180–260m in the southern area (Reference RiznichenkoXimenis, 2001). The shallowest part of the accumulation zone is characterized by a complex pattern of alternate firn and regelation-ice layers, associated with episodes of intense summer surface melting and subsequent percolation and refreezing. Thus, the firn–ice transition is not clearly determined, though it can be considered to occur, near the divides, at depths of 10–20m according to density data from ice cores (Reference Furdada, Pourchet and VilaplanaFurdada and others, 1999; M. Pourchet and J.M. Casas, unpublished data), which is consistent with measurements at other divide locations in the South Shetland Islands (Reference Orheim and GovorukhaOrheim and Govorukha, 1982; Reference ParenQin and others, 1994). The ablation area shows alternate bands of coarse clear ice, corresponding to layers from the end of the melting season, and coarse bubbly ice, corresponding to layers from the rest-of-the-year accumulation (Reference RiznichenkoXimenis, 2001).
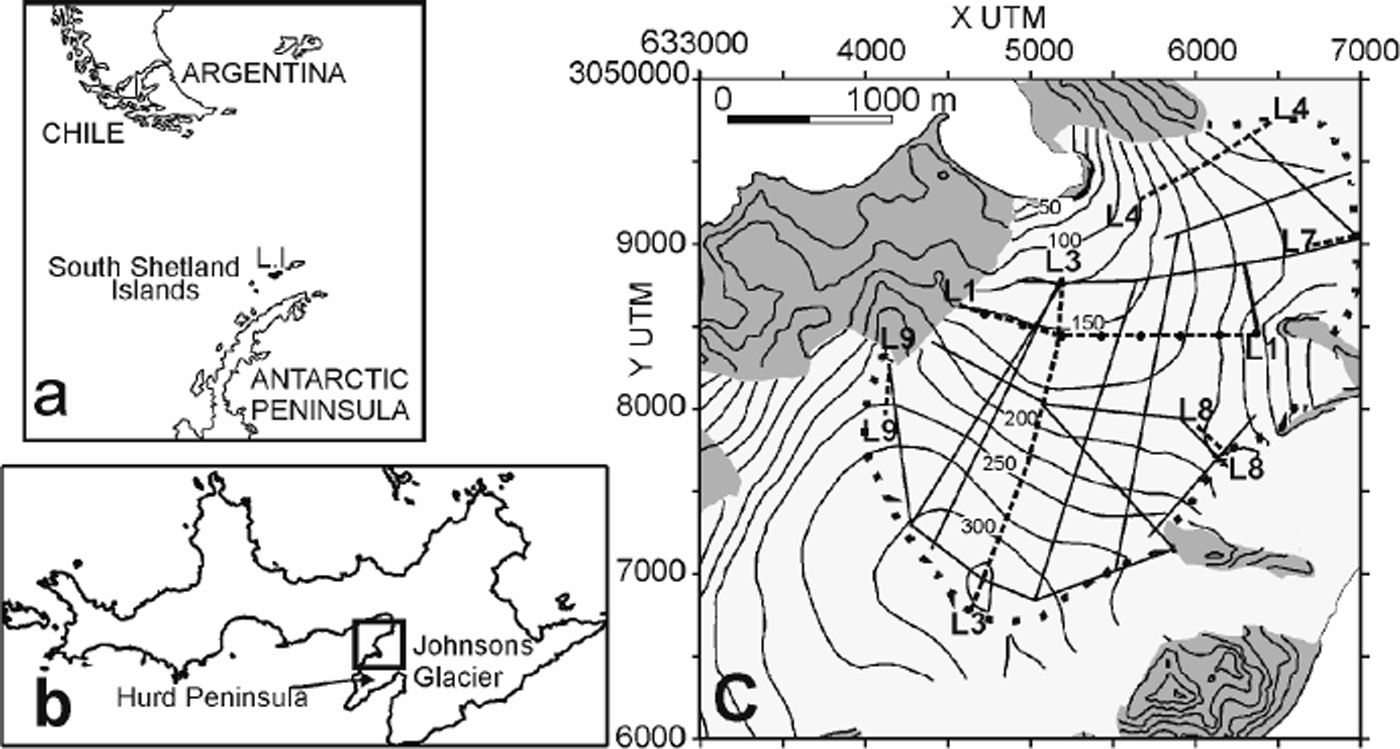
Fig. 1. (a) Location map of Livingston Island (L.I.), South Shetland Islands, Antarctica. (b) Location of Hurd Peninsula Johnsons Glacier within Livingston Island. (c) Layout of the coincident seismic and radar profiles (discontinuous lines as Ln, n being a number, at the beginning and end of the line) and radar-only profiles (unlabelled continuous straight Johnsons Glacier. The solid dots in L1 mark the position of the boundaries between the different refraction profiles that this profile. The grey areas are ice-free zones. The dotted line shows the approximate location of the ice divide.
3. Field Data Acquisition
Refraction and reflection seismic profiles, with a total length of 4.5 km, were performed at Johnsons Glacier during the Antarctic summer campaigns 1996/97 and 1997/98 (Reference Benjumea and TeixidoBenjumea and Teixido, 2001). Radar profiles with a total length of 22 km (4.5 km of them coincident with those of the previous seismic lines) were performed during the 1999/2000 campaign. Profiles both along and transverse to the glacier flowlines have been considered. The coincident profiles are shown in Figure 1: L3 and L4 follow approximately glacier flowlines, while L1 is transverse to L3; three smaller profiles, L7, L8 and L9, have also been considered. We should remark that both campaigns were planned separately and that they were not intended for water-content estimates but for ice-thickness measurements; otherwise, they would have been designed in a different way.
3.1. Seismic data
The seismic dataset consists of both refraction (L1, L7, L8 and L9 in Fig. 1) and reflection (L3 and L4 in Fig. 1, both approximately following glacier flowlines) profiles. Different geometries were used for the data acquisition of refraction and reflection seismic profiles.
For the refraction profiles, 48 geophones were placed with a spacing of 5 m. Five shots were fired along each spread, located with a nearest offset of 50 m at both sides of the spread, two at each end and one placed at the midpoint. A single spread was used for L7–L9, while the L1 profile is the result of eight consecutive spreads, shown in Figure 1.
Data acquisition for the reflection profiles was performed using 24 channels. The selected shot interval was of 10 m, and the nearest shot–geophone distance (offset) was 30 m.
For both configurations, single vertical 40 Hz geophone stations were deployed and a 48-channel digital seismograph (BISON 4098) was used to acquire the seismic data with a sample rate of 0.1 ms and a record length of 500 ms.
3.2. Radar data
The radar data were acquired at Johnsons Glacier using a low-frequency monopulse ice-penetrating radar (IPR) VIRL-2, specially designed for temperate glaciers but also useful for cold/polythermal glacier environments (Reference Smellie, Liesa, Muñoz, Sabat, Pallas and R.WillanVasilenko and others, 2002). Such low-frequency (usually ≤40 MHz) radars have been found to be the most appropriate radar tool for the study of temperate glaciers, since they overcome the strong scattering caused by water inclusions at higher frequencies (Reference Raymond and HarrisonWatts and England, 1976). The VIRL-2 equipment consists of transmitter, receiver and digital recording system (DRS). The transmitter has a centre frequency of 40MHz and peak power of 1.5 kW. The receiver has a logarithmic amplifier with 100MHz bandwidth and 80 dB input dynamic range. The antennas are resistively loaded half-wave dipoles of 5.8 m length. The DRS provides a high signal-to-noise ratio and a high rate of data acquisition: the sampling interval is 5 ns, and 4082 samples are recorded for each waveform. The DRS allows control in real time, and simultaneous recording of the radar signal and navigation information from both global positioning system (GPS) receiver and odometer. Data were collected at 2–3m spacing using a common-offset geometry with transmitting–receiving antennas arranged parallel to each other at a distance of 4.6m and transverse to the profile direction.
4. Data Processing
4.1. Seismic data
The processing of reflection profiles consisted of a conventional common midpoint (CMP) method, where the main challenge was the elimination of high-amplitude surface waves propagating in the ice. Refraction data were also used to obtain stacked sections for their comparison with radar profiles. The seismic stacked section is characterized by a low fold due to the refraction geometry used. However, good signal-to-noise ratio allowed structural information to be obtained. For all datasets, band-pass filtering, automatic gain control (a time-variant gain function applied to bring up weak signals), spectral balancing, velocity analysis, stacking (stacking of traces—offset-corrected —corresponding to a single CMP, to increase the signal-to-noise ratio) and post-stack filtering, where required, constituted the main stages of the processing scheme. As a final step, approximate depths were calculated using the stacking velocities. Details of seismic data-processing methods can be found in, for example, Reference RobinYilmaz (1987).
4.2. Radar data
The processing of radar data included correction of amplitude offset, amplitude scaling, band-pass filtering, and migration (to increase lateral resolution by collapsing diffractions and moving dipping events to their true subsurface positions) where required. The conversion to depth was accomplished using our best estimate for the radio-wave velocity, as discussed in section 5.
4.3. Some samples
As a sample of the quality of both seismic and radar data, the processed sections for profiles L3 (Fig. 2) and L1 (Fig. 3) are included. We have selected them because they are the longest profiles; the former is approximately parallel to a flowline, while the latter is transverse to it, and the seismic method used is different for both (reflection for L3 and refraction for L1). At this stage, we have left the sections as a function of two-way travel time instead of depth because conversion to depth implies previous velocity calculations, which are discussed in section 5.

Fig. 2. Results for the northern sector (1.2 km) of survey profile L3: (a) seismic stacked section, (b) radar section. I.D., within the ice; B.R., bed reflections; B. D., bed diffractions.

Fig. 3. Results for survey profile L1: (a) seismic stacked section, and (b) radar section. C.W., converted waves; I. D., within the ice; B.R., bed reflections; B. D., bed diffractions.
The L3 stacked seismic section (Fig. 2a) depicts a clear bed reflection. Diffractions from this interface can also be observed. A more detailed interpretation of this profile is given in Reference Benjumea and TeixidoBenjumea and Teixido (2001). In the southern part of the corresponding radar profile (Fig. 2b), the bed reflection is not so clearly marked: it is characterized by a lower level of bedrock reflections, attributed to discontinuities in ice, most likely to be closed-up crevasses which have been detected by analysis of seismic surface waves (Benjumea and Teixido, 2001). Many internal diffractions, as well as bed diffractions, can be observed in the northern part of the radar profile, which shows a clearer image of the bed. The internal diffractions are attributed to the presence of water inclusions, such as water lenses, or water channels crossed by the radar profiles. These are typical features of temperate glaciers such as Johnsons Glacier, where intense summer melting occurs at the surface.
The seismic image of the basement for L1is displayed in Figure 3a. Some stacked coherent noise corresponding to converted P-SV waves from the ice–bed interface (incident P, reflected SV) can be observed in the western part of the stacked section. The basin geometry is clearly shown, and its central part is characterized by a complex reflection pattern, interpreted as reflections from subglacial sediments or glacial till, which is manifested in the central part of the radar section for this profile (Fig. 3b) as a complex pattern of bed diffractions. There is a zone with low amplitude of bedrock-reflected signals in the eastern part of the profile, where both changing snow surface conditions and interference of diffractions with the reflection energy (the latter especially in the area corresponding to the shallowest bedrock) could be claimed as the reasons for the complex pattern observed in the radar section and the lack of a clear bed reflection.
The radar section for L3 (Fig. 2b) shows a lower signal-to-noise ratio than that of L1 (Fig. 3b). In addition to the presence of a highly crevassed area in the southern sector of L3, the influence of the directionality of the radar antennas with respect to the orientation of the main structures (Reference NobesNobes, 1999) could be another factor to be considered in order to explain the difference in radar data quality between L3 (following the ice flow) and L1 (transverse to it).
5. Data Analysis
5.1. Seismic wave velocity calculation
Due to the configuration used for data acquisition, different approaches were employed to obtain seismic velocity information.
For the refraction profiles, the analysis of first-arrival travel-time plots uses both routine-refraction and curve-fitting methods. The routine-refraction technique derives seismic velocities for a layered Earth model, applying the delay-time method (Reference Pakiser and BlackPakiser and Black, 1957) followed by a series of ray-tracing and model-adjustment iterations. The curve-fitting method (Reference HunterHunter, 1971) uses an iterative routine to obtain least-squares fits of the time–distance data to obtain seismic velocity and zero-offset time, which can be converted to depth. and This latter technique was applied to obtain velocity– depth profiles for the uppermost 50 m of some profiles.
The maximum source–receiver distance precluded obtaining a velocity–depth profile to the bed in the deepest parts of the glacier. For such areas, the reflection travel times were used to calculate the rms velocity from surface to bed. Three different techniques were employed depending on the data quality and bed topography: the T2 – X2 technique, the T – Δt method and the calculation of the semblance coefficient. T2 – X2 is the standard method for obtaining rms velocity and depth of horizontal reflectors from reflection hyperbolas. The method T – Δt eliminates the dip effect by averaging the times on the opposite sides of the source point. Another method for determining the stacking velocity is based on the calculation of the coherence for a group of traces (shot gather) at different stacking velocities (Reference Dahe, Zielinski, Germani, Jiawen, Wang and WangSheriff and Geldart, 1995). This can be done using different coefficients, such as the semblance, which is a measure of the sum of the energy for all the traces corresponding to a shot gather in an interval of time. The traces are shifted on time depending on the trial stacking velocity. The semblance coefficient is then displayed (contour plot) as a function of stacking velocity and time. The stacking velocity is that which maximizes the semblance.
For the reflection profiles, the rms seismic velocities between the glacier surface and the bed were obtained as result of the velocity analysis within the standard CMP reflection processing (stacking velocities). This velocity depends on the velocity from surface to reflector and the reflector dip.
The nearest offset used for reflection profiles precluded the use of the curve-fitting method to determine near-surface seismic velocity. However, horizontal variation of the seismic refraction velocities could be calculated using the differences in first-arrival travel time between adjacent records (Reference LawtonLawton, 1989). This procedure is adequate for the acquisition geometry of the reflection profiles (end-on shot configuration) since it does not require reciprocal shooting.
The error estimates for velocities were obtained using two different approaches. For the conventional refraction method, where the velocity is estimated as an average of different values, the standard deviation was taken as error estimate. For the curve-fitting, T2 – X2 and T – Δt methods, error propagation was used to evaluate the velocity error. For the two former methods, the velocity was calculated from the slope of the least-squares fit. For the T – Δt method, the error in velocity is given by the error propagation from the input parameters (time at the opposite sides of the shot, zero offset two-way travel time and source– geophone distance).
5.2. Radio-wave velocity calculation
The radio-waveve locities were calculated based on the travel time to diffractors (hyperbolic reflections) observed in the radar records (Reference MooreMoore and others, 1999; Reference MacheretMacheret, 2000). The accuracy of this method is influenced by the uncertainty in the geometry and location of the diffractor body with respect to the radar profile, as detailed below, and is sensitive to errors in positioning of radar records (Reference MacheretMacheret, 2000; Reference RobinVasilenko and others, 2001).
For estimating the radio-wave velocity from hyperbolic reflections, only symmetric hyperbolas were used, for the reasons discussed next. Theoretically, such reflections correspond either to point or to horizontal linear reflectors crossed by the radar profile; the depth of the reflector and the average radio-wave velocity between the reflector and the surface can be calculated from the travel-time curves (Reference Clarke and BentleyClarke and Bentley, 1994; Reference MacheretMacheret, 2000). On the other hand, the non-symmetric hyperbolas typically correspond to inclined englacial reflectors such as water-filled channels (Reference ParenVasilenko and others, 2001). The shape of symmetric and non-symmetric hyperbolas from linear horizontal or inclined reflectors depends on the angle between the reflector and the radar profile and also on the inclination of the reflector in the latter case (Reference MacheretMacheret, 2000). In order to estimate correctly both the geometry of the reflector and the radio-wave velocity, it is necessary to count on at least two or three profiles close to the reflector, which in practice is difficult to accomplish during the radar surveys. Therefore, we restricted our computations to symmetric hyperbolas. As error estimates for individual velocities, we used the standard deviations of the fits to the reflection hyperbolas.
The accuracy of the radio velocity estimate could be improved by using field methods such as the CMP. However, the radar equipment that we used did not allow it, because the synchronization between transmitter and receiver is accomplished by a dedicated radio channel (instead of an optic-fibre link) which limited the separation between antennas to a distance of about 5 m.
5.3. Estimation of water content from radio-wave velocity
The radio-wave velocity in glacier ice provides an indirect way of determining physical parameters of temperate ice such as the water content. Water content W in temperate ice can be estimated using the two-component dielectric mixture formulae by Reference LooyengaLooyenga (1965) for ice with spherical water inclusions,
and the relation Vr = c/ε1/2, where ε, εi and εw are the relative dielectric permittivities of the mixture, solid ice and water, and Vr and c = 300 m μs–1 are the radio-wave velocities in glacier ice and air, respectively. For the computations, we used εi = 3.19 and εw = 86 at the melting point (Reference Macheret and GlazovskyMacheret and Glazovsky, 2000). Note that the estimates of W so obtained are only valid for Vr < 168 m μS-1; higher values of Vr are associated either with dry glacier ice or with dry or wet firn, which have densities lower than that of solid ice (917 kg m–3) (Reference Macheret, Moskalevsky and VasilenkoMacheret and others, 1993). This method has been successfully used on both temperate (Reference Macheret, Moskalevsky and VasilenkoMacheret and others, 1993; Reference Murray, Stuart, Fry, Gamble and CrabtreeMurray and others, 2000) and polythermal glaciers (Reference Macheret, Moskalevsky and VasilenkoMacheret and others, 1993; Reference MooreMoore and others, 1999; Reference MacheretMacheret, 2000; Reference Macheret and GlazovskyMacheret and Glazovsky, 2000).
The dependence of radio-wave velocity on water content, as given by Equation (2), is shown in Figure 4, where a two-degree polynomial curve approximating the set of points obtained from Equation (2), for W values of 1–10%, in steps of 1, was used. This polynomial was also used to simplify computation of the error estimate for W, applying error propagation to the polynomial relation in order to compute the error estimate as a function of the radio-wave velocity and its error.
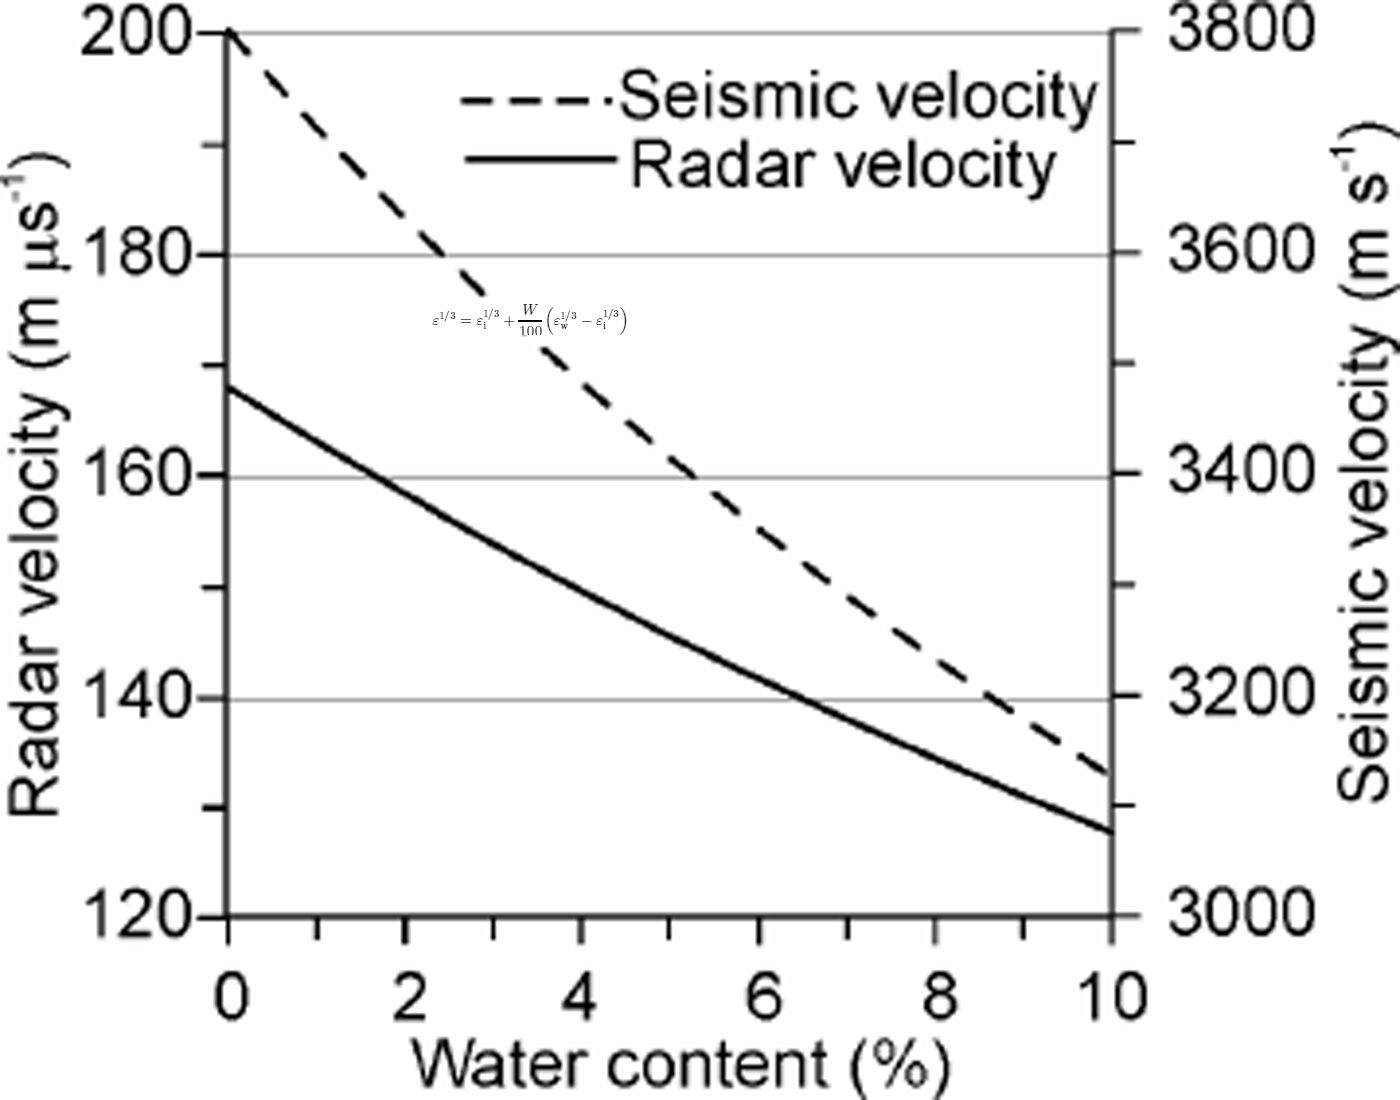
Fig. 4. Radar (continuous line) and seismic (dashed line) velocities vs water content, as given by Equations (2) and (3), respectively.
5.4. Estimation of water content from seismic wave velocity
In a similar way to that described above, we propose to estimate the water content W in temperate ice from the seismic velocity (Vs) data using the equation, due to Reference Raymond and HarrisonRiznichenko (1949), describing the dependence between both variables for a two-component heterogeneous elastic medium:
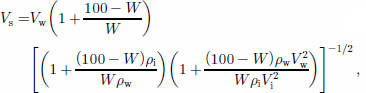
where ρ w and A are the densities of water and solid ice at 0°C, and Vs and Vi are the seismic wave velocities in these media, respectively. For our computations, we used Vi = 3800ms–1 (Reference KohnenKohnen, 1974), Vw = 1500 ms–1, ρ w = 1000 kgm–3 and P i = 917 kgm–3.
The dependence of seismic wave velocity on water content, as given by Equation (3), is shown in Figure 4. To compute the error estimate for W as a function of the seismic velocity and its error, we proceeded as described in section 5.3.
6. Results and Discussion
To compute radio-wave velocities at Johnsons Glacier, we counted on a dataset of 49 clearly identified symmetric diffraction hyperbolas. However, as the water content is strongly dependent on the radio-wave velocity, we discarded those velocities showing deviations from the average larger than 5% of the value of the velocity, since factors other than water content (such as presence of crevasses or snow conditions) could be the cause of such large discrepancies. We thus obtained a dataset of 42 hyperbolas corresponding to diffractor bodies at 28–162 m depth. The corresponding velocities ranged from 157 to 174 m ps–1, with an average of 164.9 ± 4.2 m ps–1. These are typical values for temperate glaciers, except those above 168 m μs–1, which can be attributed to the effect of the snow and firn layers. This is confirmed by the fact that, with just a couple of exceptions, such high velocities corresponded to relatively shallow diffractors in the accumulation area.
As pointed out in section 5.3, the equation for computing water content from radio-wave velocities is not valid for velocities equal to or higher than 168 m μs–1. Discarding such velocities from our dataset, 29 velocities remained, in the range 157–167 m μs–1, with an average of 162.8 ±2.9 m ps–1, corresponding to diffractor bodies still in the same depth range of 28–162 m. The associated water contents, obtained from Equation (2), are in the range 0.2–2.3%, with an average of 1.1 ±0.6%. A note of caution is necessary. Velocities calculated from diffraction hyperbolas are rms velocities for the full columns above the diffractors. The possible presence of a snow–firn layer will thus increase the column-averaged velocity, with a corresponding decrease in the water-content estimate. This effect will diminish for diffractor bodies near the glacier bed and/or located in the ablation zone. Remember also that Equation (2) is only strictly valid for ice (or firn) with fully water-saturated pores, which—for the case of ice—is most likely expected, during the melt season, in the deepest parts of the glacier; however, as veins draining surface meltwater through the ice are not always able to transmit downward all of the percolating meltwater, a local water table sometimes forms in the firn (Reference RobinVallon and others, 1976; Reference FountainFountain, 1989). On the other hand, as we are interested in comparing our water-content estimates from both seismic and radar data, and all computations for seismic velocity correspond to full-column averaged velocities, it is interesting to show the result for radio-wave velocity and derived water contents when the dataset is limited to the diffraction hyperbolas close to the glacier bed (only eight hyperbolas). Such velocities lie between 159 and 167 m ps–1, with an average of 163.1 ±2.5 m us–1, and the corresponding water contents between 0.2% and 1.9%, with an average of 1.0 ± 0.5%.
Yet another computation was made: if we include only diffraction hyperbolas (at any depth) located near the seismic profiles, a dataset of 12 hyperbolas remains, giving velocities in the range 157–166 m μs–1 and averaging 162.3 ±3.0mps–1, and corresponding water contents in the range 0.4–23% and averaging 1.2 ±0.6%. No statistical data are given for hyperbolas located both under seismic profiles and near the glacier bed, since unfortunately there are just two such hyperbolas. Neither can be used to present a contour map of water content for Johnsons Glacier, because the estimates correspond to diffractor bodies at different depths. Finally, concerning variation of water content with depth of diffractor (for the same location), only three locations were available: two of them (near the equilibrium line) with two hyperbolas, and another (in the accumulation area) with three hyperbolas. These are too few points per location to allow any conclusion to be drawn. One of the locations near the equilibrium line shows a clear increase of water content with depth, while the other shows almost no change. The location in the accumulation area shows an average water content of 0.6% for the 35 uppermost metres, which increases to 2.3% at 58 m depth, followed by a decrease to 1.6% at 102 m depth (total ice thickness is about 165 m). Though this is not many points, it is worth mentioning the similarity with the results of Reference Murray, Stuart, Fry, Gamble and CrabtreeMurray and others (2000), at least concerning the sharp increase that they found at 25–28 m depth, which they interpreted as a physical manifestation of the piezometric surface, followed by a gentle decrease in water content with depth, except for a rapid decrease near the bed.
No matter which of the above datasets we choose, both the average and the extreme values for velocities are typical of temperate glaciers, and show acceptable standard deviations (as well as individual errors), which are of course smaller when the selection criterion for the dataset is constrained. The corresponding water-content estimates are close to the values of 1–1.7% measured directly from ice cores in temperate glaciers (Reference LliboutryLliboutry 1971; Reference Dahe, Zielinski, Germani, Jiawen, Wang and WangRaymond and Harrison, 1975) and also to those estimated from CMP radar measurements in temperate glaciers (Reference Macheret, Moskalevsky and VasilenkoMacheret and others, 1993; Reference Murray, Stuart, Fry, Gamble and CrabtreeMurray and others, 2000). We should mention that, if we had used Paren’s mixture formula (Reference Pakiser and BlackParen, 1970) as an alternative to Looyenga’s formula for estimating the water content from radio-wave velocity, we would have obtained W estimates slightly lower than those presented in this paper, but still within the range usual for temperate glaciers.
Seismic velocities from surface to bed were obtained using the standard refraction method (eastern and western sectors of L1) and the methods introduced in the seismic data analysis for rms velocity calculation (L3, L4, L7 and L8). Source-generated noise (surface waves, refracted waves) precluded the detection of the reflection in the L9 profile, where the glacier bed is shallow.
From all these results, only velocities higher than 3500 m s–1 have been considered for the water-content estimation. As can be seen in Figure 4, velocities lower than 3500 m s–1 would lead to water contents too high for temperate glaciers. The low velocities could be attributed to the presence of dry ice, a thick snow–firn layer or crevasses. For example, the L4 reflection profile is characterized by extremely low seismic velocities (2800–3000m s–1). Most of this profile corresponds to the accumulation area and, in particular, to the zone of highest accumulation rates on the glacier. Moreover, the presence of many crevasses has been evidenced during the fieldwork and manifested in the data acquisition (difficulties in transmitting seismic energy to the ice) and analysis (presence of backscattered energy; see Reference Benjumea and TeixidoBenjumea and Teixido, 2001).
The seismic velocity, for the profiles considered, ranges from 3530 to 3720 m s–1. The range of the estimated errors is 20–192 m s–1, i.e. relative velocity errors lie between 1% and 5%. The largest errors have been found in the estimation of the velocity using the T – Δt method, since a large number of data points is necessary to diminish the effect of the reflector dip.
The water-content estimates obtained from Equation (3) for the above seismic velocities range from 0.9% to 3.2%, with an average of 2.2 ±0.9 %.We should keep in mind that the seismic velocity is an estimation for an ice column from surface to bed. As shown in Figure 5, for L7 and L8 seismic profiles low-velocity material characterizes the near-surface zone, with a resulting decrease in the column-averaged velocity. Density vs depth in the accumulation area can be calculated from the seismic-velocity–depth curve using the equation obtained by Reference ParenRobin (1958). According to it, the density curves in the accumulation area of L7 and L8 profiles show that firn becomes ice (density of 830 kg m–3) at 20 and 15 m depth, respectively. If we removed this low-velocity layer, the water-content estimate would change substantially. For instance, the computed seismic velocity for the full column below profile L8 was 3598m s–1, leading to a water content of 2.4%. The averaged velocity for its upper-most15mwascalculatedto be 2910 m s–1. Using a Dix equation (Reference RobinYilmaz, 1987), we then obtained a seismic velocity for the ice column between 15m depth and the bed of 3710 ms–1, resulting in a new water-content estimate of 1.0%.
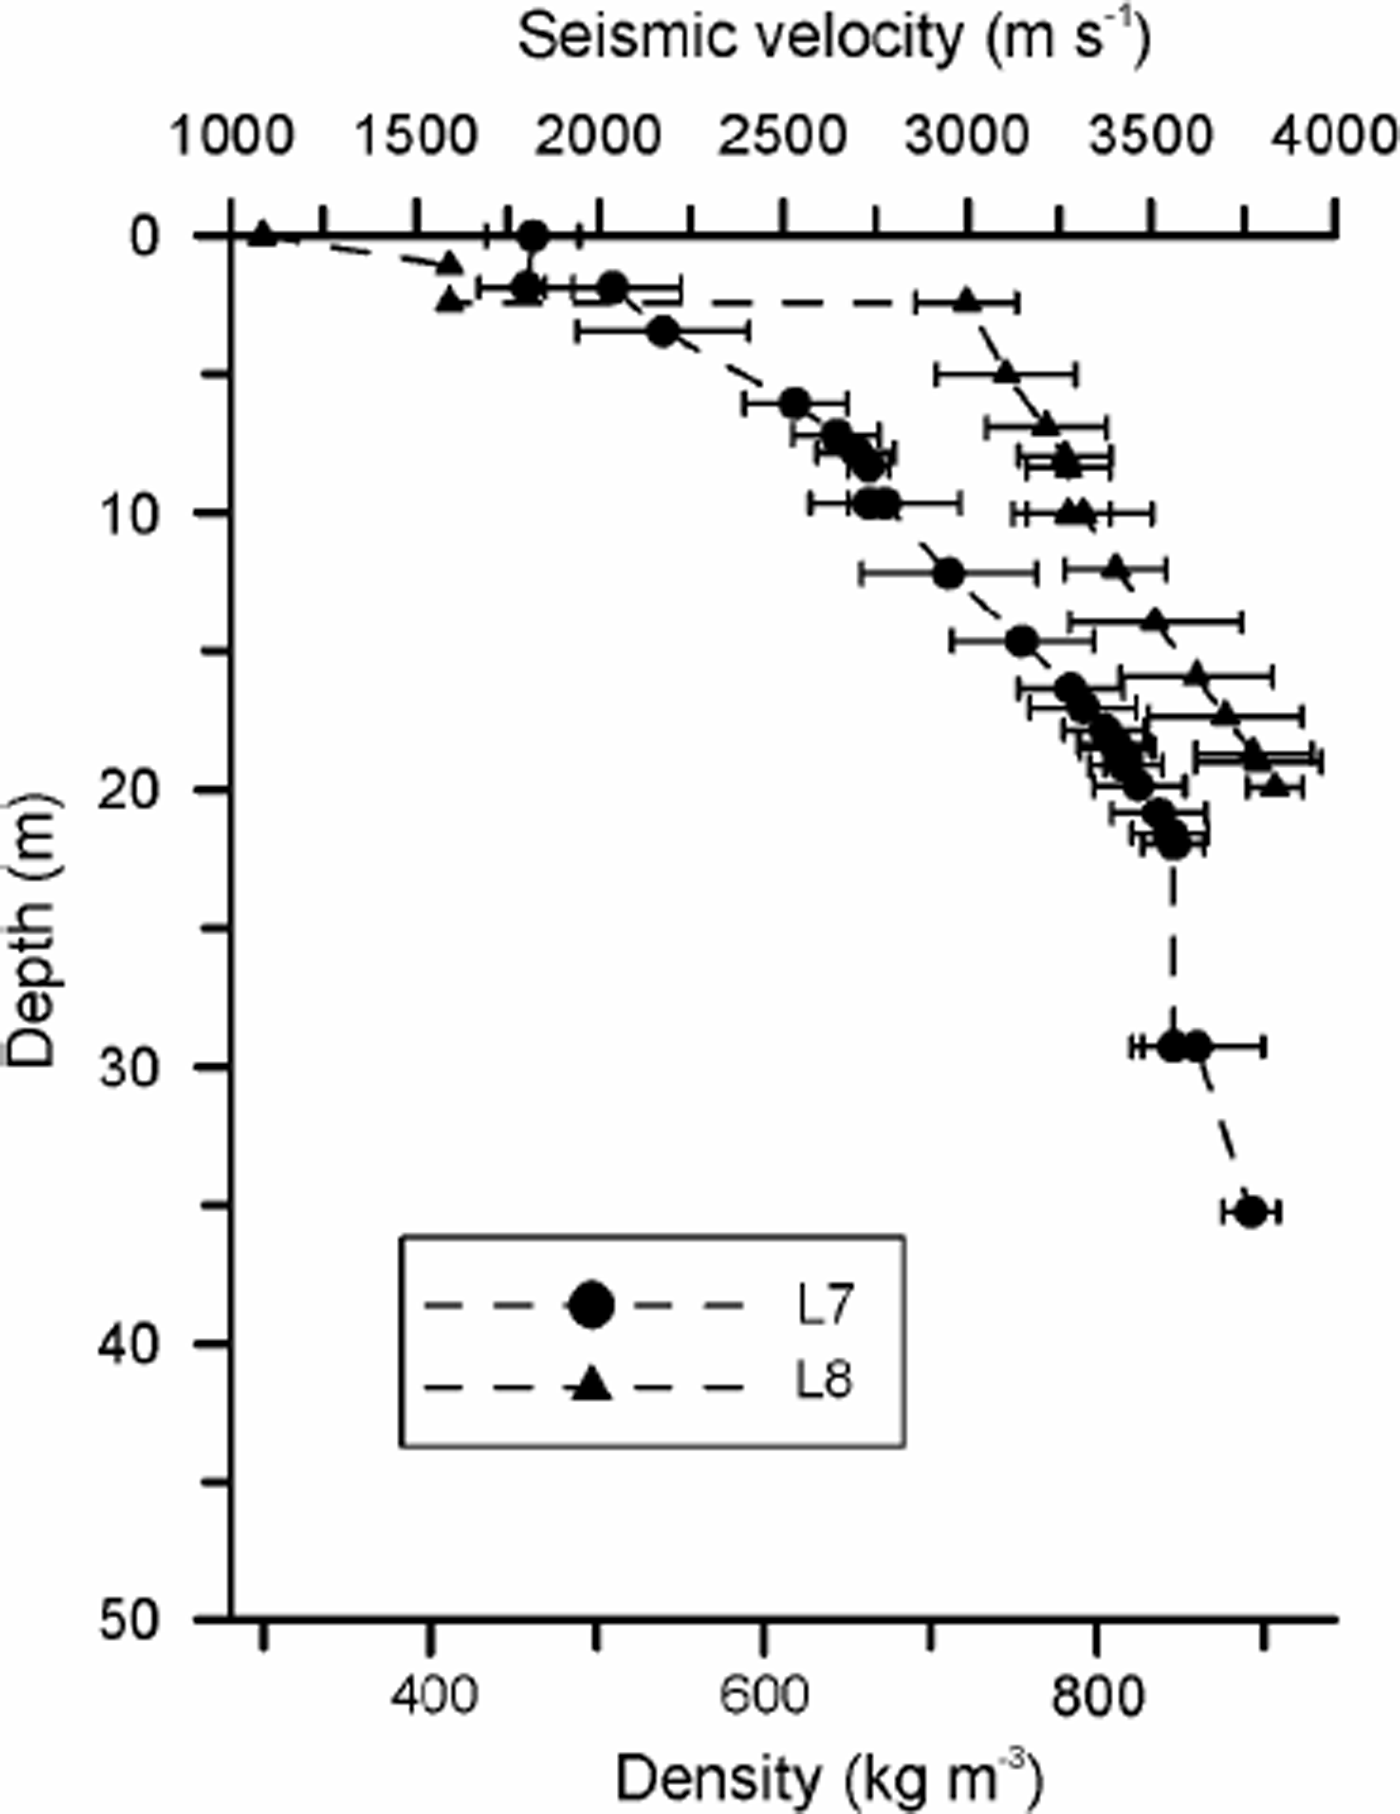
Fig. 5. Seismic velocity–depth and density–depth curves obtained from curve fitting of the first arrivals of the refraction profiles L7 and L8. The density is calculated using the Reference ParenRobin (1958) relationship between density and seismic velocity.
Lateral variations in water content could only be roughly estimated for the refraction profile L1, excluding its eastern part (corresponding to the accumulation area). For this section, which shows similar surface elevation but has the largest ice thickness (about 150 m) in its central part, followed by decreasing thickness towards the west, the water-content estimates are quite high (1.6–3.2%) and maximum in the area of largest ice thickness.
The water-content estimates obtained from radar and seismic data show good agreement, although estimates derived from seismic data are generally higher than those computed from radar data. This is due to the different behaviour of seismic and radar velocities as functions of density: while seismic velocity increases with density (and, correspondingly, with depth), radio-wave velocity decreases with permittivity (according to Vr = c/ε1/2), which, in turn, is an increasing function of density. Consequently, for constant water content and temperature, radio-wave velocity would decrease with depth. Therefore, the water-content estimates obtained from seismic velocities should be understood as an upper limit for actual values, while those obtained from radio-wave velocity should be considered as a lower limit. In this way, the seismic method is an excellent complement to the radar method in order to constrain the water-content estimates in temperate glaciers.
As shown in Figure 4, both seismic and radar velocities are strongly dependent on water content: a change in Vr of about 5 mms–1 or a change in Vs of about 150m s–1, in the usual range of velocities, would imply a variation in water content by about 2%. Such dependence is, of course, the basis for our computations. However, the strong dependency implies an urgent need to improve the accuracy of the velocity estimates. In the case of the radar measurements, it could be substantially improved by using methods such as the CMP or wide-angle reflection instead of diffraction hyperbolas, though at the expense of prolonging the fieldwork. An alternative would be to perform parallel (and close) profiles; Reference MacheretMacheret (2000) has shown that, for point diffractors, this allows the accuracy of the radio-wave velocity determinations from diffraction hyperbolas to be improved by 1–6 m ms–1, with a corresponding increase in the accuracy of the water-content estimates by 0.2–1.3%. In order to obtain more accurate water-content estimates from seismic measurements in the accumulation zone, it would be necessary to carry out a detailed refraction survey to obtain the near-surface velocity variation with depth. This would be used to correct the average velocity obtained from surface to bed, thus leading to an improved estimate of the seismic velocity (and, thus, water content) in ice.
7. Conclusions
Water content has an important effect upon the dynamics of temperate glaciers. A 1% increase in water content implies an increase in the effective strain rate by a factor of 3. It also has a strong effect on the accuracy of ice-thickness measurements. For these reasons, during the last decade several authors have paid attention to the water-content estimate from radio-wave velocity data combined with dielectric mixture formulas. In addition to this method, we have used a similar technique, but based in a mixture formula by Riznichenko concerning elastic properties, in order to estimate the water content in temperate glaciers from seismic velocity data. The good agreement between the estimates derived from seismic and radio-wave velocities allows us to conclude that the seismic method can also provide important information on the water-content distribution in temperate glaciers.
The results of our water-content estimates are similar to those obtained through direct measurements from ice cores and to those estimated from radar measurements in other temperate glaciers. However, the water-content estimates from seismic data are higher than those determined from radar data, which we attribute to the fact that seismic velocity is an increasing function of density, while radar velocity is a decreasing function of density. Water-content estimates from seismic and radar data should thus be considered as upper and lower limits, respectively, to the actual values.
Near-surface conditions strongly influence the propagation of elastic and electromagnetic waves and, consequently, the accuracy of the velocity determinations and the corresponding water-content estimates. Therefore, corrections for such effects should be taken into account.
Due to the strong sensitivity of radio- and seismic-wave velocities even to small water-content variations, precise velocity measurements are required at temperate glaciers. For radar measurements, CMP or wide-angle reflection methods should be preferred to velocity determination from diffraction hyperbolas, unless the latter are determined using data from parallel (and close) profiles, as proposed by Reference MacheretMacheret (2000). In the case of seismic measurements, a detailed refraction survey in the accumulation zone would be required to obtain the near-surface velocity variation that would allow correction for the effects of this low-velocity zone on the water-content estimation from seismic data.
Acknowledgements
Thisworkwas funded by projects ANT 96-0734 and ANT 99-0963 of the Spanish Antarctic Research Program, grant 9905-65551 from the Russian Fund of Basic Research and a fellowship from Universidad de Granada. Part of this work was done during a stay by one of the authors (B.B.) at the Geological Survey of Canada.


