


Introduction
This paper presents the calculated erosion rate of a Younger Dryas cirque glacier at Kråkenes (Fig.l), based on stratigraphical and glacial geological investigations. The two critical factors involved in such an approach are the duration of the erosion period and the volume of eroded bedrock. A preliminary result, based on a less accurate estimate of the eroded volume, is given in (Reference Mangerud, Larsen, Longva and Sønstegaard Mangerud and others 1979)
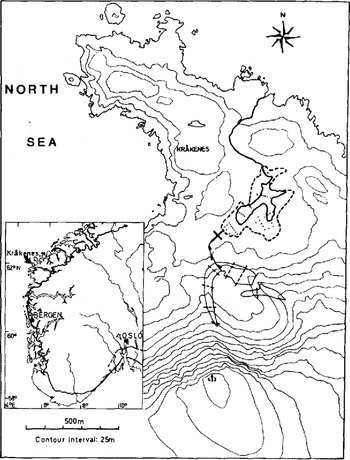
Fig.1. The position of Younger Dryas end moraines in southern Norway (key map after Reference Mangerud, Larsen, Longva and SønstegaardMangerud and others 1979), and the cirque moraine, melt-water channel, and lake (with both present level and level before lowering) at Kråkenes. Cored sites in lake (dots), seismic profiles on delta (unbroken lines), and levelled profiles on end moraine (dashed) are also indicated.
Kråkenes on the island of Vågsøy faces the North Sea. The cirque glacier here built up a prominent end moraine, and the melt water drained into a small lake (Fig.2). The level of the lake was artificially lowered some years ago, but its former shoreline can still be easily traced. The area of the lake was originally 0.07 km2

Fig.2. The cirque, end moraine, and lake at Kråkenes. The course of the glacial river is dotted (right side). Arrow indicates the site of the 14C-dated core.
Stratigraphic nomenclature in this paper is according to Reference Mangerud, Larsen, Longva and SønstegaardMangerud and others (1974).Dates are given in radiocarbon years before present (1950), i.e.14C a BP.
The Duration Of The Erosion Period
In order to date the end moraine, the lake sediments were cored, and the glaciolacustrine sediments that could be correlated with the moraine formation were identified (Reference PenningtonPennington 1947) Thirty-nine cores were obtained from the lake. These showed that the stratigraphy is very consistent. At the base (Fig.3) is a bed of grey, weakly laminated clayey silt, about 0.1 m thick. In one core a basal till was observed beneath this sediment, suggesting that the clayey silt was deposited immediately after the Scandinavian ice sheet withdrew from Kråkenes. As the clayey silt is neither thicker (Fig.4) nor more coarse-grained near the glacial river mouth, we conclude that no glacier occupied the cirque immediately after deglaciation. Above the clayey silt follows brown silty gyttja, from the base of which a date of 12 320 ±120 14C a BP was obtained (Fig.3). This is a minimum age for the deglaciation, and we concluded previously that deglaciation occurred shortly before this date (Reference Mangerud, Larsen, Longva and SønstegaardMangerud and others 1979)
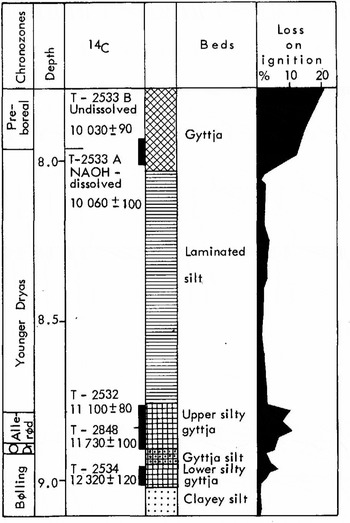
Fig.3. The lowest part of the 14C-dated core from the Kråkenes lake

Fig.4. Simplified longitudinal profile through the basin at Kråkenes. Compare the stratigraphy with Figure 3. Seismic velocities in the delta area are given.
A bed of grey gyttja silt within the brown silty gyttja sequence is found throughout the lake. The top of the silty gyttja is dated 11 100 ± 80 14C a BP, that is, close to the end of the Allerød Chronozone.
Above the silty gyttja follows a thick bed of strongly laminated silt, generally grey in colour, but with some brownish zones. This bed is thicker, and much more coarse grained near the glacial river mouth than further out into the basin (Fig.4 and Table I), and can, without doubt, be correlated with the existence of the cirque glacier. The time interval occupied by the cirque glaciation is thus bracketed between the 11 100 ± 80 14C a BP date from the silty gyttja and the 10 060 ± 100 and 10 030± 90 dates from the gyttja overlying the laminated silt (Fig.3); that is, glaciation took place during the Youneer Dryas Chronozone. The entire samples for 14 C datings are, however, taken respectively below and above the laminated sequence. In order to obtain a more precise age for the lower boundary of the laminated silt, two alternative sedimentation rate curves were constructed (Fig.5). Both curves indicate an age of approximately 10 900 a BP for the lower boundary of the laminated silt, and thus the onset of cirque glaciation. Above the laminated sequence we have only one radiocarbon date (Fig.3) and the sedimentation rate could therefore not be determined. However, by assuming a sedimentation rate similar to that just below the laminated silt, the upper boundary of the laminated silt can be estimated to 10 200 a BP.

Fig.5. Alternative sedimentation rate curves through the lower silty gyttja. gyttja silt. and upper silty gyttja (cf. Fig.3). The continuous line, representing a constant sedimentation rate, is drawn within one standard deviation of the three dates below the glaciolacustrine sediments. The dashed line is mainly based on the assumption that increased minerogenic content in the sediments reflects an increased sedimentation rate; it was constructed by assuming a linear, reciprocal relationship between sedimentation rate and loss of ignition: s = c/l, where s is sedimentation rate. c is a constant and l is loss on ignition. The dates of 11 730 ± 100and 11 100 ± 80 14C a BP are accepted as correct. Between these two dates. l is fairly constant (Fig.3). Thus the sedimentation rate between the two dates is considered constant. and the continuous line between these dates defines the constant, c. A moving average of l was used for the construction of the curve
We can thus demonstrate that for this particular site there was no glacier during the Bølling, Older Dryas, and Allerød. The cirque glacier appeared, had a lifetime of, and disappeared in some 700 a during the Younger Dryas Chronozone. At the same time the front of the Scandinavian ice sheet was situated some 60 km further inland (Fig. 1)
The ages and the duration of the erosional period are given in conventional radiocarbon years. If the suggestion of(Reference OeschgerOeschger and others (1980)) is correct, the 700 a during the Younger Dryas would correspond to some more sideral (calendar) years, and our calculated erosion rate would be correspondingly less
The sediment volume
Our basic consideration is that the total amount of erosion caused by the cirque glacier equals the total volume of the resulting sediments. Consequently the model can be expressed as (cf. Fig.6):

Fig.6. A profile through the cirque, end moraine, and lake at Kråkenes. For explanation of symbols, see text.
where V is the volume and subscripts refer to total deposition t (= total erosion), basal till b, end moraine e, sediments in river bed rb, delta d, lake sediments ℓ, sediments passing the lake p, and dissolved material ds. The results are given in Table II, and will be discussed below
The end moraine (V e)
The end moraine is a well-marked ridge (Fig.2) with a maximum distal height of 13 m. A melt-water drainage channel cuts through the moraine. Boulders occur relatively frequently on the surface of the eastern part of the moraine ridge, but are less common elsewhere. Grain-size analysis from two parts of the ridge show almost identical distribution curves (Fig.7). Within the main moraine ridge, on the eastern side of the cirque, there is a smaller end moraine (Fig.1), marking a halt or readvance during the deglaciation period. Seven profiles were levelled across the moraine (Fig. 1), and the total volume was calculated from these profiles. We have assumed a porosity of 20%, based on results from Norwegian tills (e.g. Reference Selmer-OlsenSelmer-Olsen 1977).in order to obtain the corresponding bedrock volume.

Fig.7. Grain-size distribution for two till samples from the end moraine.
Table I Grain-size distribution for the whole glacio-lacustrine sequence near the river inlet and outlet.

Some of the material included in the end moraine may have been derived from rock falls. In the present calculations we wished to isolate subglacial erosion from the total cirque erosion. Most of the rock-fall material was transported supra- and englacially to the end moraine. and has an angular form. One roundness analysis shows that 9% of the fraction between 20 and 80 mm in size consists of angular material. However. angular rock fragments are also produced subglacially and taking the grain-size distribution into consideration. we estimate that 5% of the volume of the end moraine is derived from rock fall.
(Reference ReheisReheis (1975)andReference AndersonAnderson (1978))also used angularity to distinguish between subglacially derived material and material derived from rock fall. Their figures are comparable to the 9% obtained here. Both assume that all subglacially derived materials will show some degree of roundness, but this is not in accordance with observations on Norwegian basal ti11s.
78.8% of the total amount of the glacially eroded material subsequently deposited in the vicinity of the cirque is contained in the end moraine. The end moraine has been carefully measured, and is unlikely to introduce more than small errors into the calculations. The major uncertainties are associated with the recalculations of this volume, due to the porosity of the till and the amount of rock-fall derived material. Both estimates of these parameters are minimum values. Hence possible errors in the estimates will further decrease the till volume and result in a lower erosion rate. A subjective estimate indicates a maximum error (decrease) of 20%
The river bed (V rb)
Field mapping shows that no material was deposited along the glacial river bed, due to its steep slope.
The delta (V d)
The volume of the delta is based on two seismic refraction profiles and one bore hole at the intersection of the profiles (Fig. 1). The seismic data showed two layers above bedrock (Fig.4). The velocity in the lower layer corresponds to sand below ground-water level, and is believed to represent the delta. The bore hole supports the seismic interpretations. We have neither identified a delta of pre-Younger Dryas age nor the corresponding lacustrine sediments. This may be because the older sediment sequence is very thin and/or has a seismic velocity similar to that of the delta. Normally, the small stream which flows from the cirque over the delta at present carries little material. Taking these considerations into account, the total measured delta volume has been reduced by 10%. The volume obtained for the Younger Dryas delta is corrected for pore volume in the same way as described below for the lake sediments.
The lake sediments (V l )
The volume of glaciolacustrine sediments was calculated on the basis of 39 cores (Fig. 1). This volume includes minerals, pore water, and some organic material. The volume percentage of water and organic material was measured in one of the cores. The mean water content was 65.2% and the mean loss on ignition was 2.5%. The measured volume of the lake sediments was reduced by corresponding amounts to give the equivalent bedrock volume (Table II).
Based on glacial-river load measurements in front of recent Norwegian glaciers, Østrem (1975) demonstrated that bed-load transport usually amounts to 30 to 50% of the total. At Kråskenes the bed-load transport (delta) is 47.3% of the amount of total sediment transported by the glacial river. The sediments deposited from the glacial river amount to 21.2% of the total amount of glacially eroded material. These sediment volumes are measured accurately. Any errors in these calculations will be relatively minor and will not affect the final results.
The sediments passing through the lake(V P)
The amount of material passing through the lake cannot be measured. However, some deductions as to its importance can be made. The laciniate form of the lake indicates that it was an effective sediment trap, a contention supported by grain-size analysis covering the whole of the glaciolacustrine sequence near the river inlet and outlet (Table I). It is clear that practically all of the sand in the lake was deposited there. The increasing percentage of clay towards the outlet of the lake is also a strong indication that very little of the fines passed through the lake. This sediment volume is therefore considered negligible.
Table II MEASURED SEDIMENT VOLUMES AND CORRESPONDING BEDROCK VOLUMES USED IN THE DETERMINATION OF THE EROSION RATE

The dissolved sediments (V ds)
The bedrock at Kråkenes is a gneiss, and the amount of eroded material dissolved in the water is therefore unimportant and neglected in the calculations.
The basal till (V b)
The thickness of the basal till on the cirque floor was measured at two sites only, and the volume of the till was not calculated. However, we wanted to calculate the bedrock erosion, and therefore till and other sediments existing on the cirque floor before the Younger Dryas glacier was formed should be subtracted from the sediment volume deposited by that glacier.
The cirque at Kråkenes is situated on the northern slope of a mountain 433 m a. s. l. (Fig. 1). Regional ice movement over the area was towards the north-west (Reference Larsen and LongvaLarsen and Longva, unpublished). Glacier-free slopes in the same area during the Younger Dryas, but with the same position as the cirque at Kråkenes, usually have a till cover deposited by the Scandinavian ice sheet. This suggests that the cirque at Kråkenes already contained basal till when the cirque glacier appeared. In addition, we suspect rock-fall activity to have contributed to the pre-Younger Dryas sediments in the cirque. The volume of these pre-existing sediments is impossible to estimate, and we therefore postulate it to be equal to the volume of the Younger Dryas basal till. The two sediment volumes are therefore excluded from our calculations. This is the major uncertainty in the calculations.
Rate of erosion
The areas of the cirque and the reconstructed glacier are given in Table III, and calculated erosion rates in Table IV. Note that all the erosion rates are calculated on the basis of the real areas, and not on map projection.
Table III Areas measured with planimeter on maps with a scale of 1 : 5 000. the last three values are corrected for slope angles. the reconstructed glacier and head-wall are according to figure 8


Fig.8. Reconstruction of the cirque glacier based 00 the end moraine and the cirque topography.
Table IV CALCULATED EROSION RATES. THE VOLUMES AND AREAS GIVEN IN PARENTHESES ARE FROM TABLE II AND III

Based on glacial river transport, erosion rates over periods of 2 to 11 a have been obtained for several Norwegian glaciers (Reference østrem, Jopling and McDonald(Østrem 1975) (Reference KjeldsenKjeldsen 1979))The average erosion rates vary from 0.07 to 1.0 mm a−1, with the majority of glaciers lying between 0.2 and 0.6 mm a–1. However, the erosion rates were calculated relative to the horizontal projection area of the glaciers. If we calculate in the same way, we obtain an erosion rate of 1.0 mm a–1. The bedrock at Kråkenes is a mica-rich gneiss with weathered zones. The bedrock beneath the glaciers investigated by Kjeldsen and østrem consists of crystalline rocks, often gneisses, and the resistance to erosion should therefore be of the same order of magnitude. Our result compares remarkably well with the erosion rates for present Norwegian glaciers.
The head-wall retreat is calculated according to our estimate of rock-fall material. As pointed out earlier, the rock-fall volume is assumed to be a minimum value. Nevertheless, the great difference between head-wall retreat (0.1 mm a−1) strongly suggests that subglacial erosion was the most important process. Over a period of 9 a (Reference Rapp Rapp (1960)) found a recent mean retreat of 0.06 mm a−1 for a rock fall in northern Sweden. For the head-wall of a cirque glacier in Thor Nielsen Range, Antarctica, Goldthwait (oral communication (1980)estimated a retreat of approximately 0.3 mm a−1. These results indicate that our estimate is reasonably good.
(Reference AndrewsAndrews 1971, Reference AndrewsAndrews 1972)(Reference Andrews and LeMasurierAndrews and LeMasurier (1973), )Reference ReheisReheis (1975), and Reference AndersonAnderson (1978) have calculated erosion rates for cirque glaciers in various parts of the world, and found that the erosion rate is low in polar glaciers (Baffin Island) and much higher in temperate glaciers (Rocky Mountains). Generally, our results support that conclusion, the erosion rate at Kråkenes being between that of Baffin Island and Rocky Mountains glaciers. However, with the uncertainties involved in the different estimates, and the large number of factors influencing the cirque erosion, a rigorous analysis is not possible at present.
The pre-cirque bedrock surface is unknown. By assuming this to be a smoothed continuation of the adjacent slopes. this surface is reconstructed. From a profile through the central axis of the cirque (Fig.9), it can be deduced that a deepening of from 50 to 75 m of the bedrock surface has taken place over much of the cirque.

Fig.9. A profile through the cirque showing present and assumed pre-cirque bedrock surface. No vertical exaggeration.
It is unlikely that the erosion rate was constant during the whole period of cirque formation, but a cirque glacier with a constant erosion rate of 0.6 mm a−1 would require from 83 to 125 000 a in order to erode 50 to 75 m. Furthermore. the cirque glaciation has been interrupted by ice-sheet glaciation, and certainly also by ice-free periods. We assume that the ice-sheet erosion was not larger within the cirque than on both sides. and thus that the cirque is formed by cirque glaciers during the Middle and Upper Pleistocene.
Acknowledgements
Cand. real. Oddvar Longva participated in most of the field work. and also contributed to fruitful discussions. Cando mag. Erik Søe Eriksen helped with the seismic interpretations. Cand. mag. Øivind Kirkhus and Mr Harry Isachsen assisted in the field. All 14C dates were carried out by Dr Reidar Nydal and siv. ing. Steinar Gulliksen at the Trondheim Radiological Dating Laboratory. The figures were drawn by Miss Ellen Irgens and Mr Jan E. Lien. The manuscript was read critically by Dr Bjørn G. Andersen and Dr Brian Robins. Robins also corrected the English language. Mrs Solveig Helland typed the manuscript. Financial support was given by the Norwegian Research Council for Science and Humanities (NAVF) and the University of Bergen. To all these persons and institutions we proffer our sincere thanks.


