


Introduction
With the advent of commercially available high-speed digitizers, it has become possible to sample relatively wide-band radar signals. Conventional recording techniques in radar-sounding programs usually employ an optical recording process (e.g. Reference Crabtree and DoakeCrabtree and Doake 1986; Reference Shabtaie and BentleyShabtaie and Bentley 1987). The resultant form of the recording is frozen into an image that contains limited amplitude and no phase information, and is difficult to use for quantitative analyses. In contrast, an 8 bit digitizer has a dynamic range of greater than 40 dB, all of which is preserved in a recording from which the form of data presentation can be selected.
For the quantitative analysis of radar information, recording the data digitally obviates the necessity of digitizing the data from analog records, which often compromises the quantity and quality of the results. The primary focus of radar studies has been the mapping of ice thicknesses and surface elevations, which can be facilitated by computer automation. Programs that select arrival times for echoes, with or without user intervention, can build data bases from which maps may be drawn directly (Reference BamberBamber 1987). Other types of analyses, such as generating frequency distributions of echo amplitudes for the determination of small-scale roughness characteristics (Reference NealNeal 1982), are relatively easy to perform after the echo amplitudes have been determined from digital records. For example, the back-scatter images made by Reference Musil and DoakeMusil and Doake (1987) could have been created directly from processing digital data that retain the phase information.
Beyond advantages related to recording, the computer can be used to enhance the quality of the radar signal itself. For example, complex systems have been constructed to steer or shape the beam of antenna arrays. The digital radar system in this application preserves phase information, and adds successive radar traces together coherently to increase both the signal-to-noise ratio and the dynamic range of the recorded signal. Coherent integration (stacking) of traces, as distinct from integration after demodulation (e.g. Reference Dowdeswell, Drewry, Cooper, Gorman, Liestøl and OrheimDowdeswell and others 1986), permits echoes with amplitudes smaller than the mean noise level to emerge from the noise. From a fast-moving vehicle such as an aircraft, the integration process has the additional advantage of significantly narrowing the effective antenna aperture along the direction of motion, thus reducing the clutter from surface scattering that interferes with primary echoes.
The radar transmitter and receiver units used in the study were similar to the Scott Polar Research Institute Mark IV design described by Reference Evans and SmithEvans and Smith (1969). The radar signal is amplitude-modulated at a carrier frequency of 50 MHz; the signal band width is 10 MHz. The pulserepetition frequency is software-controlled and arbitrarily variable, being tied to the acquisition cycle for a single trace. Buffered outputs were provided for both pre-detected and post-detected signals. The post-detected signal was used for monitoring, the pre-detected one for digitizing. The digital circuitry that triggered the transmitter and recorded the receiver output was shielded to prevent RF contamination of the received signal from emitted digital noise. Hardware components İn the digital system were chosen for functionality in polar operations (operation in a heated enclosure is still necessary) and rapid data-acquisition capabilities. The software was designed primarily for highspeed data recording, ease of use in controlling the system, and versatility.
System Hardware Description
The digital radar-system hardware consists of a “Camac sub-system”, a “Multibus sub-system”, and a bit-slice processor that passes information between them. The Camac dataway and radar instrumentation modules, which reside on the dataway, together constitute the Camac sub-system (Fig. 1). The Multibus sub-system comprises computer peripherals and devices connected to “Multibus” (a trademark of the Intel Corporation), a general purpose, multi-processor, microcomputer bus.

Fig. 1 Hardware schematic of the digital radar system. The digital system consists of a Camac sub-system for bi-directional translation of signals from the analog and digital realms, a Multibus sub-system that constitutes a general purpose microcomputer, and a bit-slice processor for Camac control and communication between sub-systems. Scott Polar Research Institute Mark IV radar units were adapted for coherent integration of echoes.
The Camac dataway, originally developed by the ESONE Committee of European Laboratories, is a standardized “data highway”, by means of which an assemblage of instrument modules can communicate with each other and with external computers and computer components (Reference CostrellCostrell 1971). There are four primary Camac modules which conform to IEEE Bus Standard 583–1975. One module is a four-channel arbitrary wave-form generator (AWG) that is used for data play-back. The other modules are involved in the data-acquisition process. The suppressed-carrier, amplitude-modulated radar signal passes through a wide-band pre-scaling module to an 8 bit analog-to-digital converter (ADC). A clock module provides an external sample clock for the ADC. The sample clock consists of two suites of interdigitated pulses, each produced at a 25 MHz rate. One suite is delayed in time by 270 ° of the center frequency to produce sets of samples that are approximately in quadrature. A transmitter trigger that is synchronized with the sample clock is derived from the master oscillator in the clock module. Auxiliary modules provide local memory for the ADC and the AWG. All of the modules except the pre-scaler are controlled by Camac function commands issued by the host processor via the bitslice processor.
The host processor (Intel 8085 microprocessor), and other peripherals connected in the Multibus sub-system, together constitute a general purpose microcomputer. Many Multibus components were, however, specialized for data acquisition in the field. Data were archived on two drives of a Bernoulli box (cf. Reference LintonLinton 1982). A 10 Megabyte floppy disk resides within a rigid cartridge that protects it from chemical and mechanical contamination. Because it floats on an air cushion during recording, the disk is additionally accorded a high degree of shock immunity. The acquisition code was stored in bubble memory, which is non-volaiile and also provides a high degree of protection from the environment. For recovery from catastrophic failures like a loss of power, a small amount of battery-backed random-access memory was used to save and restore system-status information, thus providing a means of rapidly repairing a corrupted data structure on disk, A serial port was utilized to allow the operator to record external events (e.g. passage by reference points on survey lines), thus providing a data link between the radar data-stream and positioning information. An auxiliary serial port is available for the input of navigational data.
A micro-programmable bit-slice processor (Am 2910) allows fast and complex management of Camac operations. A bus-master interface also gives the bit-slice processor direct access to the memory of the host processor and to other devices in the Multibus sub-system. Bits within a 48 bit microcode instruction word directly control the hardware connected to the processor. The micro-coding and other architectural features of the bit slice lend themselves to parallel processing and high-speed control of hardware operations, which are essential in phase-sensitive recording if summing is performed from a moving vehicle. The bitslice processor stores accumulated data in a memory bank (8 kilobytes by 24 bits) referred to as the “stacking” memory.
Software Description
The host processor executes instructions in FORTH, a computer language that operates within the CP/M programming environment. The user configures and controls the acquisition process through the host processor. The user is first presented with a set of configuration menus from which the desired data-acquisition parameters, such as the sample clock source for the ADC, the number of samples in a data buffer, and the sweep rate of the AWG, are selected. The menu selections provide the flexibility required for generally recording transient wave forms, such as other types of radar signals. During processing, the user can monitor the data flow on a terminal screen and, whether or not the data are being recorded, monitor the digitally acquired data on an oscilloscope or oscillograph. In addition, he has a switch that is used to start data recording and mark events.
After a configuration is selected, several steps are performed before data recording commences. The recording status from the previous recording session is checked and if a failure is detected the data structure on disk is repaired if necessary. Then the disk directory is read and a new record header containing configurational details is written. At this stage, the system is ready for data acquisition.
The system architecture lends itself to processing tasks concurrently and therefore at high speed during data acquisition. A start-up process precedes the main acquisition loop. In this process, the first radar time series, which is the normalized sum of several received radar traces, is acquired. In preparation for writing on to disk, the data are transferred from stacking memory to Multibus memory. An analog replay of the data is also initiated on the AWG, At the completion of these procedures, the activities of both processors in the data-acquisition process (Fig.2) are repeated until the user intervenes.
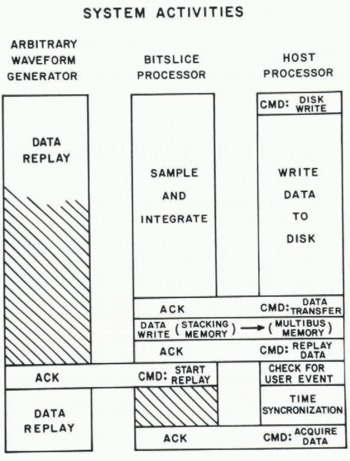
Fig. 2 Block diagram of system activities during a data acquisition cycle. Intercommunication between processors and between the bit-slice processor and the AWG are indicated by command issue (CMD) and command acknowledge (ACK) pairs. Time increases toward the bottom of the figure. For maximum speed, the three major time-consuming tasks of data replay, sampling and integration, and writing data to disk are performed concurrently.
There are three major time-consuming tasks performed during the main acquisition loop. First, the data are written to the archiving disk, a process that is carried out entirely within the Multibus system. Transferring typically 1—2 kilobytes of data from the buffer to the disk requires approximately 0.4 s. Secondly, the sampling and integrating process, performed by the bit-slice processor in conjunction with the ADC, requires an amount of time that is linearly dependent on the number of traces to be superimposed. Each trace typically required 0.3 ms. To acquire a single trace, the ADC, and consequently a trigger pulse to the radar transmitter, are activated by the bit-slice processor. An additional pulse, synchronized to the transmitter pulse, is also sent to the ADC to start the sampling. After a trace has been digitized, the ADC interrupts the bit-slice processor, which in turn retrieves and, in parallel, adds the data to the stacking memory. The sampling procedure repeats until the number of desired traces (monitored by a trace counter) has been integrated.
The third major task is analog play-back of the integrated data on the AWG. The quadrature sample pairs are combined and the result is normalized to 10 bits before it is sent to the AWG by the bit-slice processor. The samples are combined, or in effect the trace is demodulated two samples at a time, by taking the larger sample of a quadrature pair and adding it to half the smaller sample. (This approximates the square root of the sum of the squares within an error of 12%.) After transfer of the entire demodulated trace, the AWG will replay the data independently, at a sweep rate set previously during initialization. Of course, the original digitized data remain in storage after play-back.
At the start of the acquisition cycle, the AWG is presenting the demodulated form of the latest set of acquired traces, a process initiated at the end of the previous acquisition cycle. At the same time, the bit-slice processor is acquiring the next suite of integrated traces, and the host processor is writing the latest set of data on to the disk. With the three main processes running concurrently, the highest data-flow rate will be provided if sampling-and-integration takes the same length of time as writing the data on to the disk. In our system, summing 128 traces maximizes the data-flow rate. (For airborne profiling at 120 knots, that rate results in a suite of samples being integrated ονετ, and recorded, every 20 m.) In our work, however, we commonly used more stacking to improve the signal-to-noise ratio and narrow the effective antenna beam.
Results
The digital radar system was used both for ground profiling at Upstream B camp on ice stream B and in an airborne program on the Siple Coast employing a DeHavilland Twin Otter. At this time, we have only begun to examine the vast amount of data collected. Two examples of airborne profiles across the ice stream are shown in fig.2 of Reference BentleyBentley and others (1987). Both cross-sections are intensity-modulated analog records, each constructed from approximately 2000 digital records. Each digital record is the sum of the radar returns of 256 individual radar pulses. In both profiles, internal layers show clearly over the slow-moving ice between ice streams B and C as one approaches the margin of ice stream B. Numerous bumps exist on the bed that diminish in size in cross-sections farther down-stream. Clutter associated with surface crevassing sharply delineates the marginal zones because of the beam-narrowing effect of the integration. The clutter reduction by spatial averaging also has made the bottom show more clearly, and occasionally even internal layers in the ice stream can be discerned.
Parts of two recorded ground profiles are shown in Figs 3 and 4. Each figure shows a sequence of integrated traces reconstructed from quadrature samples. Each integrated trace is the result of adding 1024 individual radar traces.

Fig. 3 Displays of successive integrated (stacked) traces from ground profiling; survey along the axial direction of ice stream B.

Fig. 4 Displays of successive integrated (stacked) traces from ground profiling; survey transverse to the axis of ice stream B.
Along the flow direction (Fig.3), internal layers that are laterally continuous and parallel to the surface are clearly evident in the upper two-thirds of the section. In the lower third of the section, the internal layers are less clearly continuous. A train of echoes can be observed at or near the ice-stream bed. The first basal echo is the strongest, and the temporal invariance of this echo indicates a bed that is fairly smooth in the longitudinal direction. Modulation of the echo-train amplitude resulting from surface crevassing is apparent at 11m and 53–60 m along the profile. A second echo follows the first, but the amplitude of this echo varies more than the primary echo. The fading pattern changes slowly over the 160 m survey distance. A closer examination of this section and accompanying data will be required to identify the sources for these subsidiary echoes at the bed.
A section transverse to the ice-stream axis (Fig.4) shows internal layers similar to those in the longitudinal section for one-way travel times less than 1.5 μs. Internal layers may exist but, if so, they are obscured by interference from structures closer to the surface of the ice stream. The basal echo train is also more complicated on the transverse section. The echo train from the bed varies over a distance of 10—20 m. Two or more echoes from undulating Sayers that are marginally resolved may be present throughout the entire section. Approximately 0.1 μs before the main bottom echo is a small-amplitude echo that is spatially discontinuous. This layer also exists above two indentations or channels in the bottom 5-meter-wide (marked “C” in Fig.3). Interpretation of these features is in progress.
Acknowledgements
The development of the radar system required the talents of several individuals. In particular, we thank R B Abernathy, W L Unger, B Karsh, R Eastwood, and N Lord. We should also like to thank those who assisted in the acquisition of the radar data: R B Abernathy, S N Stephenson, J Firestone, S T Rooney, R Flanders, and S Anandakrishnan. Financial support was provided by the National Science Foundation under grant DPP-8412404. This is contribution No. 464 of the Geophysical and Polar Research Center, University of Wisconsin-Madison.


