


Background
For isotropic ice, a common assumption, that the flow is governed by a relation between the second invariants of the stress- and strain-rate deviator tensors, is adopted as proposed by Nye (1953) to allow the experimental results for compression, shear and other more complex stress configurations to be used for the specification of the flow properties of ice independent of stress configuration. The power flow law in terms of the octahedral values of stress, τ0 and strain rate, ![]() 0 is taken in the form
0 is taken in the form
where A is dependent on temperature and possibly other properties of the ice. A large number of laboratory ice-deformation tests on polycrystalline ice has suggested a value of 3 for the exponent n (e.g. Glen, 1958; Lile, 1978, 1984; Russell-Head and Budd, 1979; Hooke, 1981; Mellor and Cole, 1982; Jacka. 1984; Budd and Jacka, 1989). Most of these laboratory tests were performed in uniaxial compression or tension, or in simple shear. These stress configurations are commonly used as special extreme cases, because they are relatively simple to establish in the laboratory and have relevance to the deformation of natural ice masses. It is important, however, also to examine more complex stress systems, because these are the general cases to be expected in the field.
The flow-law dependence on the second invariant has been proposed to generalize the flow rates measured in different stress configurations to a common relationship. The second invariant hypothesis has been tested by a comparison of strain rates for compression and shear tests independently along with comparisons in terms of octahedral stress and strain rates. Steinemann (1958) compared effective values of minimum strain rates in shear (torsion of hollow cylinders) and compression at −1.9°C in the stress range 0.1–1.0 MPa. He found approximate agreement of the minimum strain rates but those in compression tended to be slightly higher. Using the data from Steinemann’s tests under simple shear and combined shear and compression, Glen (1958) also made an equivalent comparison by plotting values of the second invariant of the strain-rate tensor against the second invariant of the stress deviator. He found that, although the results provided some support for the hypothesis, some marked discrepancies clearly existed. Baker (1987) made more systematic investigations by deforming samples of isotropic glacier ice under conditions of simple shear with simultaneous uniaxial compression at a constant temperature of −9.1°C. He concluded that his experimental results did not support the second invariant hypothesis and suggested that stress configuration may affect the deformation of ice much more than suggested by the flow law. Budd and Jacka (1989) have summarized the results from a number of compression and shear experiments to show that at an octahedral shear stress of 0.1 MPa, minimum (isotropic ice) strain rates for compression and for shear agree to within a factor of 2. A subsequent re-analysis of those data revealed an error which made these shear rates too high by a factor of 2. Consequently, with the correction, there is agreement in the octahedral rates for shear and compression from those tests to within about ± 20%. For an axial stress of 0.2 MPa compared with the same simple shear stress the minimum strain rates differed by about an order of magnitude. Similar results were also found by Gao (1992) in two sets of comparison experiments in uniaxial compression and simple shear with octahedral shear stress ranging from 0.1 to about 0.4 MPa at a constant temperature of −2.0°C, His results showed that for the same octahedral shear stress, the minimum octahedral shear-strain rates for the shear tests were slightly higher (10–20%) than those for the compression tests.
The project described in this paper aims again to test the validity of the second invariant assumption. This is done by carrying out systematic tests in simultaneous compression and shear, using a new deformation apparatus which has been specially designed for this stress configuration, and which allows deformations to be taken to large strains.
Previous results (cf. Budd and Jacka, 1989) show that the initially isotropic ice remains isotropic through to minimum strain rate at about 1–2% strain but thereafter gradually develops clearly defined crystal anisotropy induced by the deformation. By about 30% strain, the form of anisotropy is clearly developed and approaches a steady-state pattern directly related to the stress configuration and the movement picture, including the rotation. The simple extreme forms of c-axis fabric patterns include the following unconfined compression gives a girdle around the compression axis, concentrated at about 25–30° to it. Similarly, for uniaxial tension, but the angle is about 65° (Jacka and Maccagnan. 1984; Li, 1995). For confined compression the deformation is essentially plane strain and two maxima in that plane occur at a similar angle to the compression axis (Budd and Matstida, 1974).
For simple shear, initially two maxima occur normal to the shear planes but as the deformation continues the maximum normal to the shear plane, which does not rotate, becomes dominant and the other gradually disappears.
These fabrics have also been clearly identified in the field in locations where the strain history is well known. For more general, or intermediate stress states, the fabrics show a corresponding intermediate pattern.
For all combined stress tests, the deformations were continued to high strains until steady-state tertiary flow was established and the corresponding anisotropic crystal fabrics were developed. These fabrics showed a clear transition from predominant compression to predominant shear in direct relation to the combination of compression and shear stresses.
The second aim of the project was to determine the steady-state tertiary strain rates for this ice, with deformation-induced anisotropy, in relation to the compatible combined stress situation. It should be noted that this compatible deformation-induced anisotropy occurs in natural ice masses and among the commonest forms are simple shear, with various amounts of compression normal to the shear plane, as studied here.
Experimental Technique
For combined shear and compression measurements there is a problem of sample shape. For unconfined axial compression, a cylindrical shape with length several times the diameter is desirable but not essential (Jacka, 1994).
For simple shear, a sample several times longer in the direction of shear than across the shear is desirable to minimize free-end effects. For the experiments described here, rectangular oblong samples with length (L) 60 mm, width (W) 15 mm and height (H) 32mm were used with the long dimension in the direction of shear. Samples were cut from cylindrical samples of isotropic ice, laboratory prepared by the technique described by Jacka and Lile (1984).
For these samples, the direct compression perpendicular to the long dimension without shear has shown that the ice deforms outwards primarily in the short dimension analogous to the case of compression confined to two dimensions, i.e. for the long dimension (in the direction of the shear) ![]() x
≈ 0. Therefore, the confined compression analysis for octahedral stress and strain rates has been used following Budd (1969, p. 17) rather than that for unconfined compression. The details of these analyses for a variety of combinations of compression and shear directions will be published elsewhere. It suffices to say here that the deformation rates of the oblong samples in compression, when treated as confined compression, agree in octahedral terms with deformation rates for unconfined compression.
x
≈ 0. Therefore, the confined compression analysis for octahedral stress and strain rates has been used following Budd (1969, p. 17) rather than that for unconfined compression. The details of these analyses for a variety of combinations of compression and shear directions will be published elsewhere. It suffices to say here that the deformation rates of the oblong samples in compression, when treated as confined compression, agree in octahedral terms with deformation rates for unconfined compression.
For the x axis in the direction of the horizontal shear and the long dimension of the sample, and z in the vertical with the direction of the compression, the following stress components apply. For the case of zero shear the confined compression stress. σ (confined in the x direction) is equivalent to a combination of plane stress in pure shear deformation in the xy plane with principal stresses (0, σ/2, −σ/2) plus a hydrostatic stress of −σ/2. This gives principal stresses, σi = (−σ/2, 0, −σ).
The addition of a horizontal shear stress τ in the x

Fig. 1. Diagram of the apparatus for combined simultaneous measurement of ice flow in compression and shear.
direction gives the stress tensor

For small τ the greatest and least principal stresses are in the xy plane but for large τ they switch to the xz plane. This stress situation is also approached by the combined axial stress and torsion of hollow cylinders (cf. e.g. Kamb, 1972).
The samples tested for this project were polycrystalline, with initially isotropic crystal orientation and mean crystal area, 1.2 mm2. Test temperature was −2.0°C, controlled by immersion in a silicon oil bath, to ±0.1°C by a method similar to that described by Morgan (1979).
To apply compression and simple shear simultaneously, the apparatus shown in Figure 1 was designed and fabricated. A fuller description of the apparatus will be published elsewhere. The ice-test sample is frozen between two support boxes. The lower box is fixed to the base of the apparatus so that it is stationary. The upper box is attached to a plate which supports the load applying the compression force. To ensure that the upper box is compressed perpendicular to the base, i.e. without tilting laterally, the compression is applied through a large-diameter piston guided by a piston housing. The piston housing is linked to two horizontal guide rails through linear bearings which allow the housing (and with it, the piston and upper box) to move horizontally and independent of the vertical compression. Shear stress is created by a force applied through a wire, tensioned (via a pulley and a load cell) by a fixed 50 mm diameter pneumatic air cylinder which can be adjusted to maintain a constant force (measured by the load cell) of up to 2000 N. The tensioned wire is connected to an arm fixed to the upper box. The vertical position of the pulley can be adjusted to ensure that the shear force is always applied horizontally through the middle of the ice-test sample during deformation. A dial indicator measures the horizontal (shear) displacement of the piston housing with respect to the base. Another dial indicator measures the vertical (compression) displacement of the piston with respect to the piston housing. Two bakelite (incompressible, resin-impregnated canvas material) plates are attached above and below the sample support boxes to provide thermal insulation.
For ice subject lo a combined stress configuration with confined normal stress σ and compressive strain rate ![]() , and with shear stress τ and strain rate
, and with shear stress τ and strain rate ![]() , the octahedral relations are given by
, the octahedral relations are given by


It should be noted that Equations (3) and (4) are appropriate for any combination of the magnitudes of stress for combined confined compression and shear. For example, in the case of uniaxial compression alone (τ = 0) or simple shear alone (σ = 0), Equations (3) and (4) reduce to the simple forms of octahedral relations used for uniaxial confined compression and simple shear respectively (Budd, 1969).
As an aside, it is useful also to note the octahedral relations for the case of unconfined compression:


For the laboratory tests, total compressive strain ϵ at time ti is estimated by the relation

where δhi , is the absolute value of vertical ice displacement (measured by a vertical dial indicator) since the experiment commenced and h 0 is the initial sample height.
The total shear strain γ at time ti is estimated by the relation

where δli , is the absolute value oi horizontal ice displacement (measured by a horizontal dial indicator) since the experiment commenced, for simple shear δhi = 0 is ensured.
The strain rate over the consecutive time interval ti to t i+1 (h) is estimated for compression, by

and for shear, by

The octahedral shear-strain rate, ![]() 0 is then calculated from Equation (4).
0 is then calculated from Equation (4).
Experiments were carried out for various combinations of compression and shear with shear stress ranging from 0 to 0.49 M Pa and compressive stress ranging from 0 to 0.98 MPa but such that, based on Equation (3), the corresponding octahedral shear stress was in all cases 0.4 MPa. All experiments were run to tertiary creep, typically at 20–40% strain.

Fig. 2. Creep curves (log–log plots of octahedral strain rate as a function of octahedral strain) for ice-deformation tests in various combinations of compression and shear. The combined octahedral stress for all tests was 0.4 MPa. The test temperature was −2.0°C.
Results
Creep curves for each test are shown in Figure 2. Results are summarized in Table 1, The creep curves are plots of octahedral strain rate as a function of octahedral strain and demonstrate that, under these test conditions, the isotropic octahedral strain rates (i.e. the strain rates up to minimum) are very similar. Tins finding supports the hypothesis (Nye, 1953) that the flow in combined stress situations can be represented by a power relation between the octahedral shear-strain rate and the octahedral shear stress, which implies dependence on the second invariants alone.
However, Table 1 also shows that for constant octahedral shear stress τ0 {in spite of some scatter) the minimum compressive strain rate ![]() m does not appear to increase linearly with the compressive stress σ as implied by the Nye (1953) relation. By contrast, the minimum shear-strain rate
m does not appear to increase linearly with the compressive stress σ as implied by the Nye (1953) relation. By contrast, the minimum shear-strain rate ![]() m appears to increase much more than linearly with the applied shear stress τ for constant octahedral shear stress. This indicates that even for isotropic ice the Glen–Nye type of flow relation needs some modification for combined stress situations.
m appears to increase much more than linearly with the applied shear stress τ for constant octahedral shear stress. This indicates that even for isotropic ice the Glen–Nye type of flow relation needs some modification for combined stress situations.
Beyond the minimum strain rate (i.e. as polycrystal anisotropy develops), each of the curves exhibits strain rates increasing to near constant tertiary values. The “shear only” curve (i.e. σ = 0) increases to a greater tertiary strain rate than the other samples (tertiary strain rate a factor of ~10 greater than the minimum isotropic ice strain rate) and the greater the amount of compression (i.e. the less the amount of shear), the lower the tertiary strain rate.
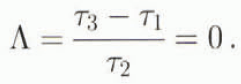
The patterns of crystal-orientation fabrics developed in tertiary flow depend very much on the stress configuration and the rotation. The stress configuration reflects the relative magnitudes of the principal stress deviators and is independent of rotation. Using the stress-configuration parameter, Λ of Lile (1984) in terms of the three principal shear stresses, τ1, τ2 and τ3, the stress configuration for confined compression and simple shear is the same with
These two deformation systems (confined compression and simple shear) differ only in their boundary constraints and the material rotation. The tertiary fabrics which develop for the confined compression are two maxima primarily in the plane of deformation at about 25–30° to the compression axis. For simple shear after the initial formation of two maxima, the maximum perpendicular to the applied shear plane becomes dominant and eventually includes most of the crystals. Simple shear becomes the “easiest glide” form for polycrystalline ice, short of being a compatible combination of single crystals. For combined stress tests, it is considered that the important parameters are the relative fractions of the octahedral shear stress, of shear or compression.
For the stress configuration used in these combined stress tests with horizontal shear τ and vertical compression σ confined in the direction of the horizontal shear, and with transverse extension, the octahedral shear stress is given by Equation (3).
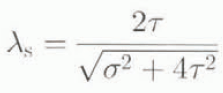
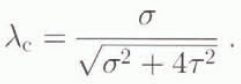
Table 1. Compressive stress σ and shear stress τ in various combinations required to deliver a combined octahedral shear stress of 0.4 MPa (Equation (3)) are tabulated along with λs (Equation (12)) and λc (Equation (13)), the strain rates measured in compression (ϵ), in shear (ẏ) and calculated (Equation (8)) for the octahedral case (⋵0), at minimum (subscript m) and tertiary (subscript t)

We define the “shear fraction” and the “compression fraction” of the octahedral shear stress, respectively, as
and
These fractions vary from 0 to 1 and 1 to 0, respectively, as the stress situation varies from purely confined simple compression (τ = 0) to purely simple shear (σ = 0). The octahedral shear-strain rates for minimum (secondary flow with still isotropic ice) and for tertiary flow (with well-developed fabrics) are shown in Figure 3 as a function of the shear and compression fractions.

Fig. 3. Plots of combined octahedral strain rate at minimum (isotropic) strain rate and at tertiary (anisotropic) strain rate (log scale) as a function of λc (linear scale). Corresponding values of λs are also shown. The minimum octahedral strain rates (for isotropic ice) are relatively constant, whereas the tertiary rates (with strongly developed fabrics) give enhancements relative to minimum of about a factor of 3 for compression to about a factor of 10 for shear. The combined octahedral stress for all tests was 0.4 MPa. The test temperature was −2.0°C.
This figure again shows that minimum octahedral shear-strain rate remains unchanged for all combinations of the level of shear versus the level of compression (for the fixed octahedral stress of 0.4 MPa). For the tertiary (anisotropic ice) strain rates, the figure provides a measure of enhancement factor, varying from ~3 for compression alone to ~10 for shear alone. While a straight line (on this log-linear plot) is the best estimate that can be made between these two values at this stage, further experiments are under way to confirm the details of this relationship over a large range of temperature and octahedral shear stress.
Conclusions and Discussion
The comparison outlined above indicates for isotropic ice that the octahedral expressions do bring the flow rates emanating from different stress configurations together. However, this does not necessarily apply to the separate compressive and shear-strain rates under combined stress situations.
Tertiary strain rates are strongly stress-configuration-dependent as a consequence of the fabric that develops with strain as a property of the stress configuration and the deformation pattern. The enhancement factor for tertiary octahedral shear-strain rate is about 10 for simple shear and decreases to about 3 with increasing confined compressive-stress component.
The steady-state tertiary flow rate for anisotropic polycrystalline ice has been considered as an enhancement of strain rate over the minimum isotropic flow rate. Earlier laboratory experimental results have indicated that this enhancement factor is dependent on stress configuration and the degree of developed anisotropy related to total strain. Over a wide range of stress and temperature the enhancement was found to have a value of about 3 (Jacka and Maccagnan, 1984) for unconfined uniaxial compression in “easy glide” (i.e. the anisotropy is compatible with the stress configuration) and 5–10 for simple shear in “easy glide” depending on the strength of the single maximum fabric (Russell-Head and Budd, 1979; Russell-Head, 1985). A flow law in terms of octahedral values for anisotropic ice may now be represented by incorporating a variable enhancement factor E dependent on the degree of shear or compression. Thus
where ![]() 0t
is the octahedral shear-strain rate for anisotropic ice. For steady-state tertiary flow in which the anisotropy has been developed by a compatible stress configuration. E has a value of ~ 10 for simple shear and 3 for compression (Jacka and Budd, 1989). Results obtained in this study provide additional support to this concept. In addition, Figure 3 provides an indication of the values of E for the combined stress situations with vertical confined compression superimposed on horizontal shear. Although these detailed combined stress data are only available for a limited range of stresses and temperatures at this stage, the tertiary flow rates for simple shear and compression have been studied over a wider range of stresses and temperatures. Based on Figure 3. we propose the following general relationship for the octahedral shear fraction λs or compression fraction λc. If
0t
is the octahedral shear-strain rate for anisotropic ice. For steady-state tertiary flow in which the anisotropy has been developed by a compatible stress configuration. E has a value of ~ 10 for simple shear and 3 for compression (Jacka and Budd, 1989). Results obtained in this study provide additional support to this concept. In addition, Figure 3 provides an indication of the values of E for the combined stress situations with vertical confined compression superimposed on horizontal shear. Although these detailed combined stress data are only available for a limited range of stresses and temperatures at this stage, the tertiary flow rates for simple shear and compression have been studied over a wider range of stresses and temperatures. Based on Figure 3. we propose the following general relationship for the octahedral shear fraction λs or compression fraction λc. If ![]() c is the octahedral tertiary strain rate for compression alone (λc 1) and ⋵s is the octahedral tertiary strain rate for simple shear alone (λc = 0), then the experimental data give a log-linear relation of the form
c is the octahedral tertiary strain rate for compression alone (λc 1) and ⋵s is the octahedral tertiary strain rate for simple shear alone (λc = 0), then the experimental data give a log-linear relation of the form
or more simply
Although the shear and compression fractions are simply symmetrically related by
the experimental data suggest the corresponding relation in terms of the shear fraction follows approximately

These relations may he expressed in terms of enhancement factors relative to the minimum strain rate for isotropic ice ![]() m for which the flow rates are well established (Budd and Jacks, 1989). If E
C and E
s are the respective enhancement factors for compression and shear alone, then the enhancement factor for the combined stress situation, E
λc, with compression fraction λc is given by
m for which the flow rates are well established (Budd and Jacks, 1989). If E
C and E
s are the respective enhancement factors for compression and shear alone, then the enhancement factor for the combined stress situation, E
λc, with compression fraction λc is given by

with E c = ~ 3 and E s = ~ 10.
In octahedral terms there are relatively little differences between confined and unconfined compression so we expect Equation (16) to hold reasonably well over a wide range of stress situations. Other stress situations will be examined further in the future. For the present, the stress situation with compression approximately normal to the direction of shear is perhaps the commonest combined system found in deforming ice masses and the results presented here can be used generally for interpretation of field data and for ice-sheet modelling.


