


Introduction
Drifting and blowing are regularly occurring phenomena over snow-covered surfaces. When the surface wind becomes stronger than a certain threshold wind speed, the drag force becomes sufficiently large to overcome interpar-ticle bonds and gravity, and the particles are lifted from the surface. For moderately strong winds, the particles remain confined close to the surface and periodically bounce with the surface; this is commonly referred to as saltation. For stronger winds, turbulent motions are able to further lift the particle against gravity. As a result, the particles are able to leave the saltation layer and become fully suspended. Travelling with the speed of the wind in the direction of the wind, drifting snow particles can be transported over considerable distances. The horizontal mass flux associated with drifting snow can be of appreciable magnitude, causing a considerable redistribution of the precipitated snow, as has been shown by observations and theoretical calculations of snowdrift transport rates (e.g. Reference Budd and RubinBudd and others, 1966; Reference RadokRadok, 1970;Reference TakeuchiTakeuchi, 1980; Pomeroy and Male, 1992).
During snowdrifting, continuous sublimation of the snow particles takes place as the ambient air is generally under/saturated with respect to the water-vapour pressure at the temperature of the suspended-snow particle. Turbulent fluctuations in vertical velocity, which provide the drag required to keep the particle at a certain average height, continuously ventilate the particle, thereby significantly enhancing the particle-to-air moisture transfer. Since water-vapour transport occurs on all sides of each floating-snow particle (the surface-arca/mass ratio of a suspended-snow particle is very large), sublimation of drifting snow seems to be a potentially more efficient ablation mechanism than sublimation of the rigid snow/ice surface, which was demonstrated quantitatively by Pomeroy (1989).
Over Antarctica, wind speeds are regularly high enough to induce snowdrifting, especially in the coastal regions where cold katabatic winds almost continuously roar down the relatively steep ice-sheet slope. For instance, the annual mean wind speed at the windiest place on Farth close to sea level, Cape Denison,Terre Adélie, amounts to 19.1 ms−1, with monthly means up to 25 m s−1 during winter (Wendler and others, 1997). Not surprisingly, these windy coastal regions experience snowdrifting during large parts of the year (Budd and others, 1966; Reference SchwerdtfegerSchwerdtfeger, 1984). We may therefore expect that sublimation of drifting snow is also a regu-larly occurring phenomenon, which makes it necessary to quantify its contribution to the surface mass balance.
For this we will use a one-dimensional model of the atmospheric surface layer which includes equations describing the vertical profiles of suspended-snow particles in 16 size classes, snowdrift sublimation and a Richardson number parameterisation of the reduced eddy diffusivities caused by the buoyancy effects of the stably stratified suspended-snow profile. The model is validated by comparing simulated vertical profiles of snowdrift sublimation with those derived from measurements. The model is then used to parameterise snowdrift-sublimation rates in terms of quantities measured at automatic weather stations (AWSs), i.e. 3 m wind speed and air temperature. Finally, this parameterisation is used to evaluate sublimation rates during one year at six AWS sites along a transect from Dumont d'Urville to South Pole, namely, D-10, D-47, D-57, D-80, Dome C and South Pole.
Model Description
In this section we will briefly describe the surface-layer model with focus on those parts associated with snowdrift sublimation and water-vapour transport. The parts dealing with momentum and suspended-snow particles are described in more detail by Bintanja (1998), while a complete description of the entire model has been prepared by Bintanja (unpublished).
The drifting of snow particles in the air is considered as a two-phase turbulent flow of air mixed with rigid, non-cohesive, spherical snow particles, separated sufficiently to be considered isolated so that particle interaction can safely be neglected (Reference Lumley and BradshawLumley, 1978). in other words, interparticle interactions of the boundary layers of momentum, heat and moisture are neglected, which accurately holds for two-phase flows with such low particle volume concentrations as in snowdrifting. The one-dimensional model domain (assuming horizontal homogeneity) is the atmospheric surface layer from the surface up to a height of 10 m, in which most of the snowdrift transport takes place. in Antarctica, the lowest 10 m of the atmospheric boundary layer can usually be regarded as the constant-flux layer. This domain is subdivided into a suspension layer overlying the saltation layer close to the rigid surface. in the suspension layer, the model describes vertical profiles of wind speed (u), potential temperature (θ), specific humidity (q), and suspended-snow-mass concentration (in kg m −3) in 16 size classes (![]() ) according to:
) according to:

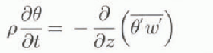
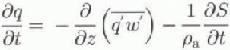
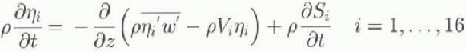
where z is the vertical coordinate, t is time, ρ is the density of the air-snow mixture, ρa
is the density of air, ![]() is the snowdrift-sublimation rate for particles in size class i, and
is the snowdrift-sublimation rate for particles in size class i, and ![]() is the sublimation rate summed over the 16 size classes. Vi is the terminal fall velocity of particles in size class i, which depends on the gravitational force and the fluid drag exerted on the particle; it is parametcrised in terms of particle radius and wind speed according to Pomeroy and Jones (1996). in Equation (2) the cooling due to sublimation of drifting-snow particles is neglected, whereas in Equation (4) it is assumed that particles do not change size while sublimation occurs.
is the sublimation rate summed over the 16 size classes. Vi is the terminal fall velocity of particles in size class i, which depends on the gravitational force and the fluid drag exerted on the particle; it is parametcrised in terms of particle radius and wind speed according to Pomeroy and Jones (1996). in Equation (2) the cooling due to sublimation of drifting-snow particles is neglected, whereas in Equation (4) it is assumed that particles do not change size while sublimation occurs.
The turbulent fluxes of momentum, heat, moisture and suspended-snow particles are parameterised in terms of the mean gradients (first-order closure):
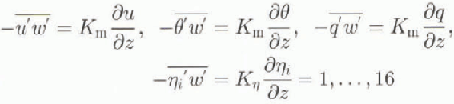
where Km is the eddy diffusivity for momentum, which is assumed to be equal to the eddy diffusivities of heat and moisture. Km can be expressed as
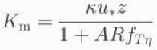
where ![]() is the friction velocity, κ (= 0.4) is the von Kármán constant and A is an empirically determined constant equal to 6 (observations show that this value is representative for thermally stable boundary layers (Garratl, 1992) as well as for boundary layers including a stable suspended-mass gradient (Reference Bridge and DominicBridge and Dominic, 1984)).
is the friction velocity, κ (= 0.4) is the von Kármán constant and A is an empirically determined constant equal to 6 (observations show that this value is representative for thermally stable boundary layers (Garratl, 1992) as well as for boundary layers including a stable suspended-mass gradient (Reference Bridge and DominicBridge and Dominic, 1984)). ![]() is the eddy diffusivity for suspended-snow particles.
is the eddy diffusivity for suspended-snow particles. ![]() is the Dux Richardson number in case of a thermally stable surface layer and a surface layer containing a stable suspended-snow profile:
is the Dux Richardson number in case of a thermally stable surface layer and a surface layer containing a stable suspended-snow profile:
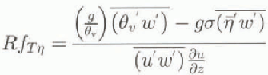
where g is the acceleration of gravity, ![]() is the virtual potential temperature and
is the virtual potential temperature and ![]() is the relative excess of snow-particle density
is the relative excess of snow-particle density ![]() over air density.
over air density. ![]() is defined as the ratio of destruction of turbulent kinetic energy by buoyancy forces and the production due to shear (Reference Adams and WeatherlyAdams and Weatherly, 1981).
is defined as the ratio of destruction of turbulent kinetic energy by buoyancy forces and the production due to shear (Reference Adams and WeatherlyAdams and Weatherly, 1981).
When a snow particle enters into suspension, sublimation takes place across the particle boundary layer owing to the difference in water-vapour pressure at the surface of the particle and the ambient air. Hence, the particle loses latent heat through sublimation, which is compensated for by a sensible-heat flux directed towards the particle. The balance between these two fluxes occurs almost instantaneously; the e-folding adaptation time tor ventilated water drops increases with the square of drop radius, and approximates 0.5s for the largest spheres considered here with radius of 240 μm (Reference Pruppacher and KlettPruppacher and Kletl, 1978). Hence, one can safely assume that there is a balance between the two fluxes, which enables one to derive a relatively simple expression for the snowdrift-sublimation rate in terms of known quantities. Wc neglect the absorption of radiation by the snow particles, as Pomeroy and others (1993) found its contribution to be small. in case of ventilated ice spheres and using the Clausius-Clapeyron relation to approximate the water-vapour gradient in the particle boundary layer, Reference Thorpe and MasonThorpe and Mason (1966) derived the following expression for the sublimation rate in size class

where ![]() is the radius of particles, λ(= ρw/ρws
— 1, where ρw(ρws) is the (saturation) water-vapour density) is the undersaturation of the air surrounding the particle with respect to ice, Ls is the latent heat of sublimation, Kc
is the thermal conductivity of air, D is the diffusivity of water vapour in air, M is the molecular weight of water vapour, Τ is absolute temperature and fi is the universal gas constant.
is the radius of particles, λ(= ρw/ρws
— 1, where ρw(ρws) is the (saturation) water-vapour density) is the undersaturation of the air surrounding the particle with respect to ice, Ls is the latent heat of sublimation, Kc
is the thermal conductivity of air, D is the diffusivity of water vapour in air, M is the molecular weight of water vapour, Τ is absolute temperature and fi is the universal gas constant. ![]() represents the number of particles in size class i. The Nussclt number (Nu) and Sherwood number (Sh) represent the effect that ventilation increases the sublimation rate compared to stationary (non-moving) particles. Using hexagonal ice crystals, the experiments of Thorpe and Mason (1966) yielded
represents the number of particles in size class i. The Nussclt number (Nu) and Sherwood number (Sh) represent the effect that ventilation increases the sublimation rate compared to stationary (non-moving) particles. Using hexagonal ice crystals, the experiments of Thorpe and Mason (1966) yielded ![]() in the range 10 ≤ Re ≤ 200, where Re = 2riVi/v is the Reynolds number and ν is the kinematic viscosity of air; this increase in sublimation rale caused by ventilation is in good agreement with those according to various theoretically derived expressions (Pruppacher and Klctt, 1978).
in the range 10 ≤ Re ≤ 200, where Re = 2riVi/v is the Reynolds number and ν is the kinematic viscosity of air; this increase in sublimation rale caused by ventilation is in good agreement with those according to various theoretically derived expressions (Pruppacher and Klctt, 1978).
Next, wc will describe briefly the boundary conditions that were applied; a detailed description has been given by Bintanja (unpublished). The lower boundary of our suspension model is the so-called focus height, which is the height at which the downward extrapolated wind profiles during snowdrifting intersect (Reference BagnoldBagnold, 1941; Budd and others, 1966; Reference Shiotani, Arai and ŌuraShiotani and Arai, 1967; Radok, 1970); hence it is the height at which the horizontal wind apparently remains constant during drifting. As the height of the focus is approximately 80% of the depth of the saltation layer (Pomeroy and Gray, 1990), the cause of the existence of the focus must lie in the dynamics of the saltation layer. Wc will assume that the wind speed, temperature and humidity remain constant at the focus during snowdrifting, with wind-speed values determined by the threshold-friction velocity (u*t), the height of the focus (= 0.05 m) and the intrinsic-roughness lengths (= 1 x 10 −4 m; e.g. Reference KingKing, 1990). The lower boundary condition for the suspended-particle Equation (4) is given by the mean mass concentration in the saltation layer (Pomeroy and Gray, 1990):

where u*
is the friction velocity near the focus, C is the ratio of saltation velocity and ![]() is the height of the saltation layer, which is assumed to depend on
is the height of the saltation layer, which is assumed to depend on ![]() according to Pomeroy and Male (1992). The appropriate particle-size distribution in the saltation layer (particle diameters 30-480 μm) is obtained by using the well-known two-parameter gamma distribution (e.g. Budd, 1966; Reference SchmidtSchmidt, 1982) with the shape parameter and the mean diameter equal to 4 and 200 μm, respectively. At the upper boundary (z = 10 m), the fluxes of momentum and sensible heat are prescribed, whereas the latent-heat flux is the sum of the surface flux and the vertically integrated snowdrift-sublimation rate. For snow particles, the upward turbulent diffusion balances the downward flux due to gravity at the upper boundary.
according to Pomeroy and Male (1992). The appropriate particle-size distribution in the saltation layer (particle diameters 30-480 μm) is obtained by using the well-known two-parameter gamma distribution (e.g. Budd, 1966; Reference SchmidtSchmidt, 1982) with the shape parameter and the mean diameter equal to 4 and 200 μm, respectively. At the upper boundary (z = 10 m), the fluxes of momentum and sensible heat are prescribed, whereas the latent-heat flux is the sum of the surface flux and the vertically integrated snowdrift-sublimation rate. For snow particles, the upward turbulent diffusion balances the downward flux due to gravity at the upper boundary.
Equations (5) and (6) are solved on a finite-difference grid which is logarithmic in z in order to obta in the highest resolution near the surface where the vertical gradients are largest. The time differencing is simply forward in time, while the diffusion terms on the righthand sides of Equations (1)-(4) are solved with central differences. The model integrates from initial wind, temperature, humidity and suspended-snow-mass profiles until a steady state is reached.
Validation of Simulated Vertical Snowdrift-Sublimation Profiles
In this section, we validate the model by comparing simulated profiles of snowdrift-sublimation rates to those calculated from direct snowdrifting observations by Schmidt (1982). He presented vertical snowdrift-sublima-tion rates in the lowest metre calculated using Equation (8) from measured profiles of wind, temperature, humidity and suspended snow at a site in Wyoming, U.S.A., which was nearly level and had a fetch of at least 1 km. We simulated his runs 4 and 10, for which he gives sufficient data (table 1) to initialise our model with the measured wind, temperature and humidity profiles. in order to simulate the amount of suspended-snow particles for these runs correctly, wc had to take u*t = 0.45 m s−1, c = 10 and α = 1.6 (values of α larger than 1 have been suggested by Sommer-field and Businger (1965)). Furthermore, we assumed that the relative humidity at the focus was 95%, in rough agreement with Schmidt's measurements. Finally, we assumed that the 10 min average quantities that Schmidt presented represent equilibrium conditions, so that drift flux and sublimation rate are in equilibrium with the average profiles of wind, temperature and humidity.
Table 1. Measured surface layer profile parameters during Schmidt's (1982) runs 4 and 10
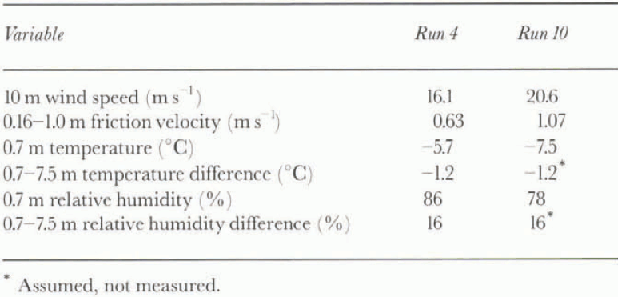
Figure 1 shows simulated and “observed” suspended-snowdrift-sublimalion rates for the two cases. The agreement is good in both cases. Notice that most of the snowdrift sublimation occurs very close to the surface, a result of the fact that most of the suspended-snow particles, especially the largest ones, remain close to the surface. During run 10 the sublimation rate is significantly higher than during run 4. This can be attributed mainly to the higher wind speeds during run 10, which induced more suspended particles at each height (due to a stronger upward turbulent diffusion) as well as stronger ventilation of the particles. Both effects enhance the total sublimation rate. Another reason for the high sublimation rates of run 10 is the relatively low humidity (table 1), as the sublimation rate is directly proportional to the un-dersaturation of the ambient air with respect to the saturation vapour pressure at the surface of the partirle (Equation (8)). The fact that the model was able to simulate accurately snowdrift-sublimation rates in two different situations suggests that the dependence of snowdrift-sublimation rate on surface-layer wind speed, temperature and humidity profiles is sufficiently well modelled. This gives confidence in the accuracy of the simulated sublimation rates when the model is applied to a wider range of conditions.
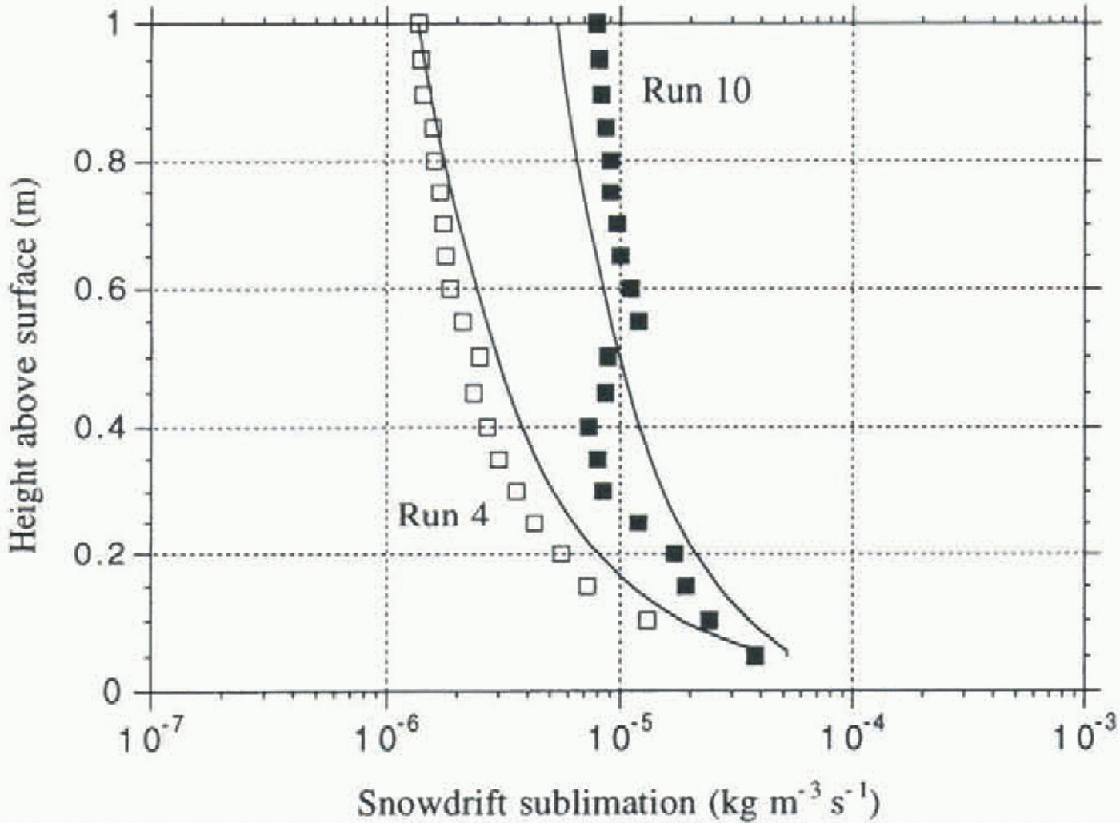
Fig. 1. Simulated (lines) and observed (squares) vertical profiles of snowdrift sublimation rate in the lowest metre for two of Schmidt's (1982) experiments denoted run 4 and run 10. Values of the meteorological variables during these experiments are presented in Table 1.
Parameterisation of Vertically Integrated Snowdrift Sublimation in Terms of Wind Speed and Temperature
To calculate snowdrift sublimation over Antarctica, one should ideally use the specific characteristics (e.g. threshold friction velocity, temperature and moisture profiles) of each AWS location and run the model for each 3 hour measurement that is available. Unfortunately, this is impossible for the following two reasons: (1) the spatial and temporal variation of the (surface) characteristics on which snowdrifting depends heavily is not known; instead, only rough estimates are available at best; (2) the model consumes too much computer time to perform enough runs within a reasonable amount of time. Consequently, we have decided to parameterise the total snowdrift-sublimation rate in terms of 3 and 10 m wind speed and temperature for a fixed value of relative humidity (the AWSs used in this study did not contain humidity sensors). We assumed that conditions at the AWS locations were horizontally homogeneous, that the surface was level and that the time required for the surface layer to reach equilibrium snowdrift profiles was short compared with the time between two successive AWS readings (3 h). The errors associated with these assumptions can be considered negligible. Table 2 shows the various model parameters that were used to make the parameterisation. Notice that the value of the threshold friction velocity is in agreement with estimates made using Antarctic data (e.g. King and others, 1996), which yields a 3 m threshold wind speed of 7.7 m s −1 with the given value of the intrinsic roughness length. Notice also that we assumed (from lack of further knowledge; AWSs measure temperature at only one level) that the temperature stratification in the surface layer was spatially and temporarily invariant, in spite of the fact that the vertical temperature gradient is known to depend heavily on location and season. The 3 m relative humidity was assumed to be 70% (with respect to ice), in accordance with measure-ments by Wendler and others (1988) at D-47 during summer.
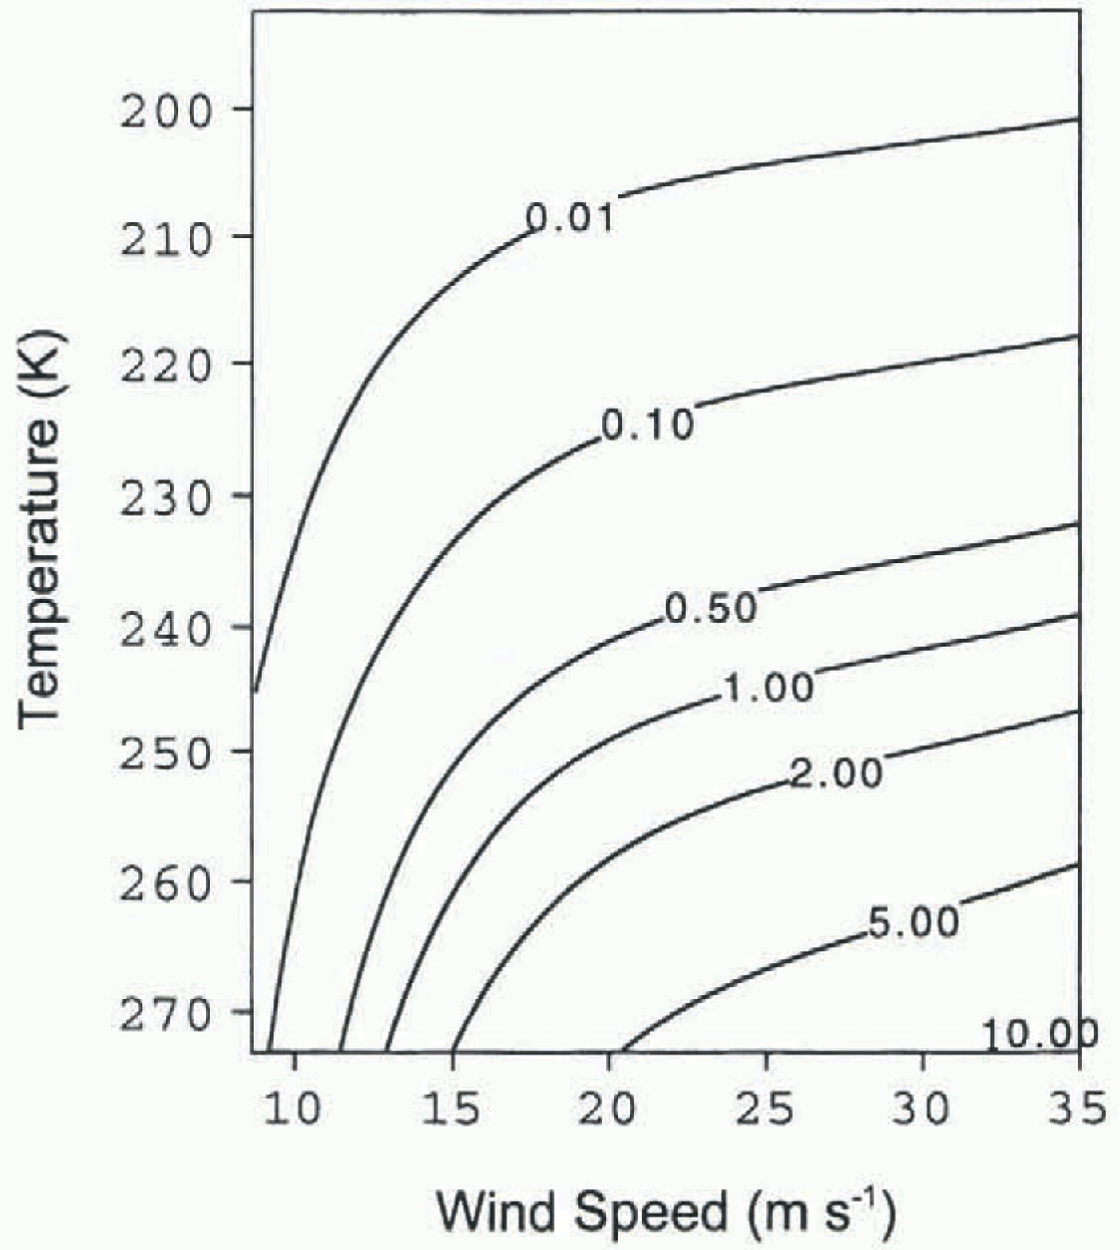
Fig. 2. Vertically integrated (0.05-10 m) snowdrift sublimation rale (in mm w.e. d−1) as afunction of air temperature and wind speed at 10 m as calculated using values of the model parameters given in Table 2.
With the model parameters fixed at the values indicated in Table 2, the model was forced with 3 m wind speeds and air temperatures ranging from 7.7 to 34.7 m s−1 and 193 to 273 K, respectively. For each individual set of conditions, the model calculates the various vertical profiles until equilibrium is reached. Figure 2 shows the vertically integrated snowdrift-sublimation rate as a function of 10 m wind speed and temperature. Obviously, snowdrift sublimation increases strongly with increasing wind speed; this is caused mainly by the strong increase in drift density (and hence the number of suspended particles) with wind speed. According to Equation (9), the strongest increase in saltation drift density with wind speed occurs at winds just above the threshold wind speed. Moreover, the ventilation of the particles increases with wind speed.
Figure 2 also demonstrates that snowdrift sublimation increases strongly non-linearly with increasing ambient temperatures. This can be attributed to the fact that the lower the temperature, the smaller the specific humidity gradient across the particle boundary layer. Hence, it can be concluded that summer storms contribute significantly more than winter storms to the annual amount of snowdrift sublimation. To compare the equivalent latent-heat flux associated with snowdrift sublimation with the surface sublimation rate, note that 1 mm w.e. d−1 is equivalent to a latent-heat flux of 32.8 wm . Since several estimates of surface latent-heat fluxes show that these rarely exceed 50 wm −2 even under the most favourable conditions (e.g. Reference Stearns, Weidner, Bromwich and StearnsStearns and Weidner, 1993; Bintanja and Van den Broeke, 1995; King and others, 1996; Bintanja and others, 1997), it is clear that the sublimation of drifting snow may be a potentially important term in the surface mass balance of Antarctica.
In order to calculate snowdrift sublimation from AWS data, we made a regression of snowdrift-sublimation rate against wind speed and temperature in the following form:
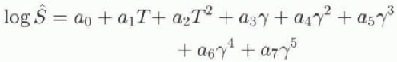
where ![]() is the vertically integrated (0.05-10 m) snowdrift-sublimation rate (kgm−2s−1), Τ is air temperature
is the vertically integrated (0.05-10 m) snowdrift-sublimation rate (kgm−2s−1), Τ is air temperature ![]() (with u in ms−1) and a0-a7
are regression coefficients. Regressions in the form of Equation (10) yielded a significantly higher correlation coefficient than other forms that were tried. Table 3 lists the values of the regression coefficients for wind speeds and temperatures at 3 and at 10 m above the surface. The first is included since most AWSs have their sensors mounted at 3 m. Variables at 3 m cannot be calculated easily from their 10 m equivalents since the surface-layer profiles are essentially non-logarithmic during snowdrifting, by virtue ofEquation (7) (Bintanja, 1998).
(with u in ms−1) and a0-a7
are regression coefficients. Regressions in the form of Equation (10) yielded a significantly higher correlation coefficient than other forms that were tried. Table 3 lists the values of the regression coefficients for wind speeds and temperatures at 3 and at 10 m above the surface. The first is included since most AWSs have their sensors mounted at 3 m. Variables at 3 m cannot be calculated easily from their 10 m equivalents since the surface-layer profiles are essentially non-logarithmic during snowdrifting, by virtue ofEquation (7) (Bintanja, 1998).
Table. 2. Model parameters used to make the parameterisation

Estimate of Annual Snowdrift-Sublimation Rates from AWS Data
In this section we apply the parameterisation described in the previous section to actual Antarctic data. More specifically, we chose to calcúlale snowdrift-sublimation rates using data from South Pole and from five AWSs in Terre Adélie: D-10, D-47, D-57, D-80 and Dome C (Fig. 3). This was done for three reasons: (1) most of the spatial variations in the snowdrift-sublimation rate are to be expected in the radial (north-south) direction; (2) the AWSs inTerre Adélie have yielded a long-term nearly continuous dataset; and (3) data from these stations are well studied, free of errors and easily available (Stearns and others, 1993). We have selected 1987 as the year with the least gaps in the data of the six above-mentioned AWSs. For each 3 hour instantaneous reading of wind speed and temperature, Equation (10) is applied to calculate the snowdrift-sublimation rale, provided that the 3 m wind speed is higher than 7.7 m s−1 (the threshold wind speed); otherwise the sublimation obviously equals zero.
Figure 4 shows daily mean temperatures, wind speeds and snowdrift-sublimation rates at D-10. Clearly, (sublimation of) drifting snow occurs regularly at this site owing to the high frequency of winds above the threshold. Stormy periods during the summer cause large day-to-day variations in snowdrift-sublimation rate, with peaks of up to 4 mm d−1 (3 hour values reach peaks as high as 7.3 mm d−1). During winter, sublimation is reduced by low temperatures. High wind speeds contribute disproportionally to the total snowdrift-sublimation rate, as can be inferred from Figure 5. This especially holds for the plateau stations, where wind speeds rarely exceed the threshold for snowdrifting. At the coastal stations (D-10, D-47 and D-57), which are located on the steep surface slope and therefore experience strong katabatic winds throughout the year, daily mean winds exceed 12 m s −1 for 15-28% of the time during which 56-62% of the annual snowdrift sublimation occurs.
Table. 3. Regression coefficients of vertically integrated snowdrift sublimation in terms of 3 and 10 m wind speed and temperature in the form of Equation (10). R is the correlation coefficient of thefits
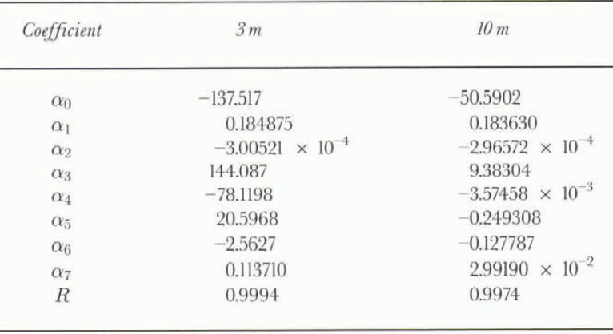
Figure 6 depicts daily average snowdrift-sublimation rates for each AWS site. Obviously, snowdrifting and subli-mation of drifting snow occur regularly at the windy coastal stations, whereas in the interior they occur quite rarely, owing to the weak winds. When snowdrift sublimation occurs, its magnitude is largest near the coast because of the relatively high temperatures and strong winds. When snowdrift sublimation occurs on the plateau it is negligible due mainly to the low ambient temperatures.
Figure 7 shows monthly means of wind speed and temperature, and monthly totals of snowdrift sublimation. The highest winds occur at some distance from the coast at D-47, with maximum values in winter (Wendler and others, 1993). Nevertheless, the monthly sublimation rates are largest near the coast throughout the year, which can be attributed to the dominant influence of the higher temperatures near the coast. Interestingly, the stormy period in September contributes significantly to the annual snowdrift-sublimation totals at each station. Near the coast, the surface loses mass at a rate of about 2 cm w.e. month−1 during summer (in other words, snowdrift erosion is 2 cm w.e. month −1 larger than snowdrift deposition, the difference being due entirely to sublimation of the suspended snow). During the cold and relatively windy winter months, sublimation of drifting snow amounts to approximately 1mm w.e. month −1 Hence, wintertime snowdrift sublimation apparently does not vanish, in contrast to the surface sublimation rate which is generally considered to be negligible during winter (e.g. Reference Fujii and KusunokiFujii and Kusunoki, 1982; Stearns and Weidner, 1993; Bintanja and others, 1997). The annual course of the snowdrift-sublimation rate is domi-nantly controlled by seasonal variations in air temperature, which can be attributed to the fact that the seasonal march of wind speed (with its maximum in winter) is not so pronounced.

Fig. 3. Map of the AWS locations D-10, D-47, D-57, D-80 and Dome C in Tèrre Adélie, Antarctica (after Wendler and others, 1993). The altitude contours are in metres.
Figure 8 depicts annual mean values of air temperature and wind speed, and annual total sublimation rate for the six AWS locations. According to our calculations, sublimation of snowdrift amounts to about 17 cm w.e. a−1 near the coast, and decreases strongly inland. in fact, sublimation of snowdrift appears to be significant in an absolute sense only in regions less than 400 km from the coast, even though its relative contribution to the surface mass balance may also be non-negligible in the interior where all other surface mass-balance terms are also small. On the other hand, surface sublimation becomes relatively more important than snowdrift sublimation when surface winds largely remain below the threshold for snowdrift, since surface sublimation occurs for any wind speed larger than zero.
Needless to say, the mechanism of mass removal by snowdrift sublimation contributes significantly to the sur-face mass balance in the coastal regions of Antarctica, as can be concluded if the calculated snowdrift-sublimation rates are compared with the observed surface mass-balance distribution (Reference BromwichBromwich, 1988) and with the various surface mass-balance components as calculated by various atmospheric models (e.g. Reference Fortuin and OerlemansFortuin and Oerlemans, 1992; Reference Tzeng, Bromwich, Parish and ChenTzeng and others, 1994; Reference Genthon and BraunGenthon and Braun, 1995; Reference Connolley and KingConnolley and King, 1996). Near the coast, the calculated mass loss through snowdrift sublimation amounts to roughly 10-20% of the annual accumulation. Unfortunately, spatial and temporal distributions of surface sublimation rates are usually not presented in these studies, which makes it difficult to compare calculated snowdrift sublimation with estimates of surface sublimation. Therefore, we will compare our snowdrift-sublimation rates to the surface sublimation evaluated from atmospheric surface-layer measurements taken at D-47 in November-December 1985 (Wcndler and others, 1988). The monthly mean upward latent-heat flux amounted to 8.7 wm−2, which can be regarded as a typical summer value. As can be inferred from Figure 7, snowdrift-sublimation rates at D-47 in summer can be twice as high as the surface sublimation. This nicely illustrates that sublimation of drifting snow may represent the largest part of the total surface-to-atmosphere moisture flux.

Fig. 4. Daily means of air temperature and wind speed at 3 m, as well as calculated daily totals of snowdrift sublimation at D-10 during 1987.

Fig. 5. Occurrence of wind speed (in % of time) and the contribution to the total amoun t, of snowdrift sublimation (in %) as a function of 3 m wind speed for daily mean data of the six AWS locations during 1987.

Fig. 6. Calculated daily mean snowdrift sublimation ratesfor the six AWS locations during 1987. Note the different vertical scales in each diagram.

Fig. 7. Monthly means of temperature and windspeed at 3 m, and calculated monthly total of snowdrift sublimation for the six AWS locations during 1987.

Fig. 8. Annual means of temperature and wind speed at 3 m, and calculated annual totals of snowdrift, sublimation as a function of distance to the coast near Durmonl d'Urville in Terre Adélie, 1987.
The uncertainties associated with the present analyses have been addressed as follows: two additional parameteri-saiions were made, one with the relative humidity fixed ai 80%, the other with a threshold friction velocity of 0.4 m s−1. These additional parameterisations were used to recalculate snowdrift sublimation at the six AWS locations. Using a relative humidity of 80% instead of 70% reduces total snowdrift-sublimation rates by 30%, which can obviously be attributed to the reduced humidity gradient across the particle boundary layer. An increase of u*t from 0.3 to 0.4 m s −1 decreases the total snowdrift sublimation by 70%, which can be attributed to the fact that snowdrifting occurs less often, and to the smaller amount of particles that enter into suspension (by virtue of Equation (9)). As threshold friction velocities may increase significantly when temp-eratures approach the melting point as a result of the increased strength of the interparticle bonds (Takeuchi, 1980), it cannot be excluded that the present analysis overestimates snowdrift-sublimation rates during the summer very near the coast. Unfortunately, very little is known about the spatial and temporal distribution of the threshold friction velocity to accurately account for this effect. This sensitivity analysis demonstrates that one should interpret the quantitative results presented here with caution. A preliminary experiment including cooling due to snowdrift sublimation in Equation (2) reduced the amount of sublimation by approximately 10%.
King and others (1996) calculated snowdrift-sublimation rates from measurements taken at Halley during winter. They concluded that snowdrift sublimation does not contribute significantly to the surface mass budget during winter, which they attributed to the fact that the surface winds at Halley are not particularly strong (drifting snow occurs only 30% of the time) and to the high relative humidities in the surface layer (up to 97% at 1 m). They estimated that all sublimation took place on the suspended-snow particles, so that surface sublimation was zero with in the accuracy of their measurements. This qualitatively agrees with the above-mentioned notion that, unlike the surface sublimation rate, snowdrift sublimation may significantly differ from zero during winter.
Conclusions
In this paper, the snowdrift-sublimation rate is calculated on the basis of a one-dimensional atmospheric surface-layer model using year-round meteorological data of six AWSs in East Antarctica. The model calculates steady-state vertical profiles of wind speed, temperature, humidity, suspended-snow mass and snowdrift-sublimation rates. It takes into account the buoyancy effects induced by the stable stratification of suspended snow. The model successfully reproduces vertical profiles of sublimation rate calculated from measured meteorological and snowdrift profiles for two selected cases when some model parameters are assigned appropriate values. in order to calculate snowdrift sublimation for large quantities of data, the model is used to parameterise the vertically integrated snowdrift sublimation in terms of 3 and 10 m air temperature and wind speed. This pararnelerisaiion is then used to evaluate snowdrift-sublimation rates from meteorological data of six AWSs located along a transect from Dumont dTJrville at the coast to South Pole for one year.
Snowdrift-sublimation rates increase strongly with wind speed and air temperature. Therefore, strong wind events contribute disproportionally to the mass loss through snowdrift sublimation, especially during the summer. Snowdrift sublimation occurs regularly in the windy coastal regions; at D-10, close to Dumont d'Urville, calculations indicate that snowdrift sublimation removed about 17 cm w.e. during 1987 (the uncertainty in this value may be large, due to the various assumptions that were made), which is about 10-20% of the annual accumulation. This amount decreases rapidly to 0.8 cm w.e. a −1 at D-80, 440 km from the coast. in the interior, snowdrift sublimation occurs rarely and amounts only to a few mm w.e. a−1 due to the weak winds and low temperatures. Hence, the strong radial gradient in snowdrift-sublimation rates can be attributed to the fact that temperatures and wind speeds increase towards the coast. The calculations show that snowdrift sublimation is largest during the summer, but that it may be non-negligible also during the winter. A comparison of calculated snowdrift sublimation with surface sublimation rates at D-47 during another year demonstrates that snowdrift-sublimation rates may be twice as high as the surface sublimation in summer. Wintertime surface-layer moisture fluxes may be completely attributable to snowdrift sublimation.
This study can be regarded as a first step in estimating the contribution of snowdrift sublimation to the surface mass balance of Antarctica. The results demonstrate that sublimation ofdrifting snow may be an effective and important mechanism in removing mass from Antarctica's ice sheet. Notice, however, that other studies (e.g. King and others, 1996) found that relative humidity increased significantly during snowdrift sublimation, thereby significantly reducing the amount of sublimation. Although our model does not show such behaviour, it probably indicates that the results presented here must be regarded as upper limits. If data from the transect in Terre Adélie studied here represent conditions found elsewhere in East Antarctica (and there is no reason to assume otherwise), snowdrift sublimation may contribute significantly to the integrated surface mass balance of Antarctica. Integrated over the continent, snowdrift sublimation amounts to 1.7 cm w.e. a−1, which is about 10% of the annual accumulation. To estimate its importance more accurately, model calculations should be refined (e.g. somehow to include spalial and temporal variations in relative humidity) and extended towards other locations. As snowdrift sublimation is likely to be a significant contributor to the surface-to-Atmosphere moisture flux, this mechanism should be accounted for in atmospheric models.
Acknowledgements
The author expresses his thanks to the members of the Ice and Climate group of the Institute for Marine and Atmospheric Research Utrecht for their comments on an earlier version of this paper, and to C. R. Stearns and co-workers at the University of Wisconsin-Madison for making available the AWS data used here, which were obtained in the framework of the Automatic Weather Station Project funded by the U.S. National Science Foundation. Financial support was provided by the Netherlands Antarctic Research Programme (GOA).


