


Introduction
7Time scries of surface air temperature for particular sites are among the most important data bases used to assess global change (e.g. Reference JonesJones, 1994; Reference Parker, Folland and JacksonParker and others, 1995). Oxygen-isotope ratio values obtained from polar firn and ice samples are determined by complex phenomena that include the condensation history of air masses, but in practice are taken to indicate the temperature of condensation in the lower troposphere at the time of precipitation, and are used as proxy data for surface temperature (e.g. Reference Dansgaard, S. J., H. B. and GundestrupDansgaard and others, 1973; Reference Lorius and MerlivatLorius and Merlivat, 1977). Applying diverse dating criteria, time series of oxygen-isotope ratio values obtained from deep ice cores yield complete temperature records of varying time resolutions covering millennia (e.g. Reference Hecht, Ocschger and LangwayHecht, 1989; Jouzcl and others, 1993). Values of δ18O (in this study, multi-year mean value of 18O/16O relative to Standard Mean Ocean Water, in ‰) (SMOW; repositories at the U.S. National Bureau of Standards, Washington, DC, and at the International Atomic Energy Agency, Vienna) need to be adjusted for ice flow, normally using modeling procedures that incorporate an assumed surface distribution of either δ18O or multi-year mean temperature values upstream of the sampling site (e.g. Robin, 1976; Reference Budd, Young and RobinBudd and Young, 1983). The present study provides a benchmark distribution for any such modeling in studies of deep ice cores from Antarctica.
In the following sections we discuss aspects of:
-
(a) the sample-site dataset and 100 km grid data subsets.
-
(b) the general model derived using the whole sample-site dataset, and the possibly maximum regional differences at drainage-system scale with in the general model.
-
(c) entity-specific models that result from splitting the sample-site data to represent locations exclusively on the conterminous grounded-ice area, and on ice-shelf areas (including islands and ice rises).
-
(d) two arcal distributions of δ18O that result from the inversion of entity-specific models applied to 100 km grid data subsets, one based largely on data obtained from surface observations, and the other based largely on remotely sensed data.
-
(e) a comparison between the areal distribution of δ18O produced using the field and remotely sensed data subsets showing the distribution of residuals.
The principal differences between the present study and a preceding study (Giovinetto and Zwally, 1997) are the compilation of a significantly larger and overall more representative sampling-site dataset, an assessment of regional departures from the general model, the introduction of a remotely sensed grid data subset and the production of a contoured distribution based on it, as well as a discussion of residuals produced by the δ18O distributions based on the field and remotely sensed data subsets.
Sample-Site Database
Our compilation of δ18O data for Antarctica aims to include all sampling sites reported in the literature, mainly building on two preceding compilations (Morgan, 1982; Giovinetto and Zwally, 1997) (Fig. 1). The number of sampling sites listed for the present study (562) is 38% greater than the number used in a preceding analysis (406; Giovinetto and Zwally, 1997). The increase is due in part to the inclusion of data for 33 sites in the Graham Land Larsen Ice Shelf eastern Palmer Land region that were compiled bill pur-posely excluded from analysis in the preceding study, and in part to the addition of data for 86 sites in the sector between 50° and 110° E (Goodwin, 1990; Reference Higham and CravenHigham and Craven, 1997; Morgan and others, 1997). Due to an oversight, three sites on the eastern Filchnei-Ronne Ice Shelf (Reference Jenkins and DoakeJenkins and Doake, 1991) are not included in the analyses.
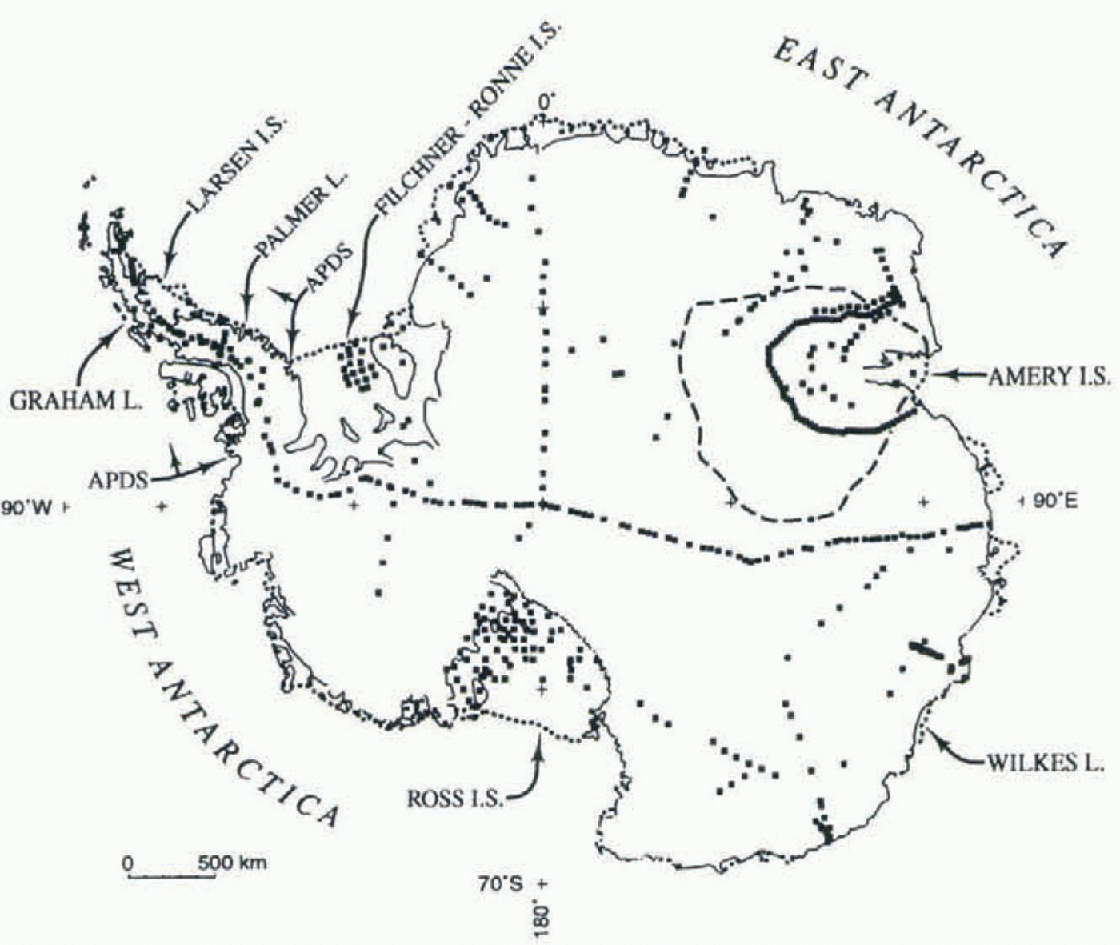
Fig. 1. Antarctica, showing the location of data siles and places mentioned in the text. The coastal extent of the drainage systems in the Antarctic Peninsula region is indicated by arrows labeled APDS, and the divide for the Lambert Glacier-Amery Ice Shelf drainage system is shown with dashes.
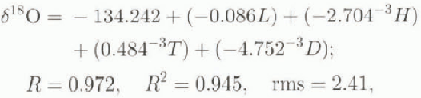
In the present study, δ18O data for four sites in the Lambert Glacier-Amcry Ice Shelf drainage system were obtained by conversion of δD (2H/1H relative to SMOW, in ‰) derived from a correlation between the two ratios for 27 sites in the same system:

where R is the coefficient of correlation, R2 is the coefficient of determination, and rms is the root-mean-square residual.
The increase in the number of sampling sites gives this study two advantages over the preceding one (Giovinetto and Zwally, 1997). First, it improves the significance level of various statistics that result from any particular analysis; the number of sites that lie on the conterminous grounded ice increases by 44%, from 296 to 427, and on the area of ice shelves including islands and ice rises, by 23%, from 110 to 135. Secondly, the analyses include data for the sites in the Graham Land-Larsen Ice Shelf-eastern Palmer Land region (a sector spanning 15° of longitude). Although not sampled by the grid, as discussed in the following section, the inclusion of data representative of coastal or maritime regions, i.e. of relatively high isotopic and surface temperatures, and of relatively short distances to open ocean, enhances model sensitivity for the remaining coastal regions sampled by the grid and spanning 345° of longitude. This is an important development since even a cursory view of Figure 1 shows the bulk of data sites are largely representative of conditions in the interior.
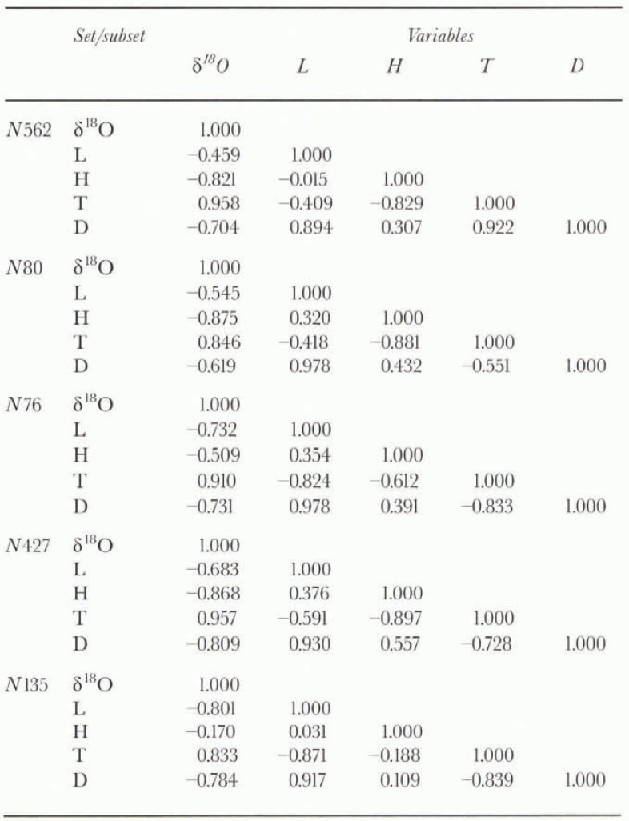
Table. 1. Descriptive statistics for each dataset and subset

The sample-site data consist of δ18O as the dependent variable (Table 1: N562, where N is the number of samples in the dataset or subset) and four so-called independent variables. of these, the first three are obtained from the δ18O sources themselves: latitude (L, in °S), surface elevation (H, in m above mean sea level, obtained for most sites from either surface traverse or flight altimetry) and mean annual surface temperature (T, in K, obtained for most sites from firn temperature measurements at a depth of 10 m). We add a fourth: mean annual shortest distance to open ocean, denoted by the 20% sea-ice concentration boundary in 1973-82 (D, in km). We obta in the data using 15 day mean distributions of the boundary centered on 15 February and 15 September, as compiled by the United States Navy (1985) following a procedure described elsewhere (Giovinetto and Zwally, 1996).
Gridpoint Database
Inversions of the models derived from stepwise analyses ( presented in the following sections) are applied to a 100 km grid database in which each gridpoim location is defined by latitude and longitude, and assigned values of mean annual surface temperature, mean annual shortest distance to open ocean, and surface elevation obtained in two subsets. Information on the grid and the grid data subsets follows.

Fig. 2. Distribution of gridpoint locations (N1351). Grid-lines and grid columns are 100 km apart. Grid sampling excludes the Graham Land Larsen Ice Shelf-eastern Palmer Land region.
The grid sampling provides 1351 gridpoint locations determined overlaying a pattern of gridlines 100 km apart and parallel to meridians 90 wand 90 E, and grid columns 100 km apart and parallel to meridians 0 and 180°, on a polar Stereographic projection with standard line at 71 S (Fig. 2). Grid sampling excludes the Graham I.and-Larsen Ice Shelf eastern Palmer Land region for three reasons. Firstly, ice caps and glaciers in the region are not part of the ice sheet proper. Secondly, field data obtained in the region cannot be interpolated reliably due to its mountainous topography. Thirdly, grid data would not produce reliable contouring since there are relatively few gridpoints on each gridline overlying the region.
Differences between the field and remotely sensed data subsets involve qualitative and quantitative differences, as well as differences in areal and temporal distributions. Briefly, these differences may he classified as “general” and “specific”:
(1) General differences
-
(i) Qualitative differences are defined by the contrast between the field subset, compiled from observations made by hundreds of observers using many techniques and methodologies through periods of diverse duration distributed over several decades, and the remotely sensed subset, collected using relatively few sensors and algorithms and practically without interruption for specific periods ranging from 1 year to approximately two decades.
-
(ii) Differences in areal distribution are defined by the contrast between the field subset, compiled from observations in areas limited by logistics (i.e. near widespread semi-permanent stations or along traverse routes), and the remotely sensed subset, compiled from normally full-area coverage data generally available as mean values for grid squares with side lengths that range from a few km to 30 km.
(2) Specific differences
-
(i) Surface elevation. The elevation values entered in the field subset (Hs, in m) were visually interpolated from 100 m contour lines as drawn from extensive compilations of surface altimetry data obtained by traverse alti-metry leap-frog methods, aircraft surface-altimetry (lata, etc. (Reference Drewry and DrewryDrewry. 1983). The elevation values entered in the remotely sensed subset (Hr, in m) were obtained for locations northward of approximately 81.5° S by bilinear interpolation from ERS-1 radar altimeter data provided by A. Brenner and J. DiMarzio (personal communication, 1997).
-
(ii) Mean annual surface temperature. The temperature values entered in the field subset Ts in K) were visually interpolated from an isotherm pattern manually drawn in increments of 5 K using data for approximately 700 locations (maimed ami automatic weather stations, traverse Bra temperature measurements al diverse depths) representative of mean values for periods of 1-30 years ending on any year between 1948 and 1988 (Giovinetto and others, 1990). The elevation values entered in the remotely sensed subset (Tr , in K) were obtained by bilinear interpolation of Nimbus 7 temperature humidity infrared radiometer for 1979 (Reference ComisoComiso, 1994).
-
(iii) Mean annual shortest distance to open ocean, file two sea-ice-extent distributions used to compile the field and remotely sensed data subsets may be considered to be remotely sensed data. However, the procedures to obta in the distance values for each subset are drastically different. The distribution used to determine distances for the field subset (DS, in km) is the same as that described above for the data base corresponding to δ18O sampling sites. We estimated the distance by summation of factored distances measured to the 20% sea-ice concentration boundary for only two semi-monthly means (one each to the winter maximum and summer minimum sea-ice extents as compiled for 1973-82 by the United States Navy (1985) (Giovinetto and Zwally, 1996)). The other sea-ice-extent distribution used to determine distances for the remotely sensed subset (Dr, in km) involved a single measurement to an in-tegrated 20% sea-ice concentration boundary for 1978—95 as compiled from Nimbus-7 scanning multichannel microwave radiometer dala, and three Defense Meteorologiers; Satellite Program special sensor microwave imager (lata from Cavalieri and others (1997).
Differences between other field and remotely sensed data subsets produced notably different areal distributions of δ18O for the Greenland ice sheet (Zwally and Giovinetto, 1997b), as well as different estimates of net mass accumulation at the surface or surface balance for the Antarctic and Greenland ice sheets (Zwally and Giovinetto, 1997a).
General Model
A common multivariate regression model obtained using N562,
would be implicitly biased by moderate to strong correlation between T,H (R = -0.829). D, L(R = 0.894). and T,D(R = -0.922) (table 2). The covariation problem is minimized by applying stepwise procedures in either the forward or backward mode (Reference CochranCochran, 1957; Reference Davis and SampsonDavis and Sampson, 1973; Reference WilliamsWilliams, 1986; Reference Tabachnick and FidellTabachnick and Fidell, 1989) (table 3).
Table. 2. Correlation matrixes for each dataset and subset
Stepwise procedures are subject to constraints defined by a minimum confidence level desired in the regression model. The constraint is determined by the F value (F statistic under the null hypothesis showing a probability p equal to or less than the selected confidence limit) which is in turn determined from standard mathematical tables on the basis of the number of data entries and the number of so-called independent variables.
Ill this and the following sections, we performed stepwise regression methods, confirming results obtained in the forward mode by repeating all analyses in the backward mode. All statistics are significant at the 99% confidence level (P ≤ 0.01) unless noted otherwise. Variables in any equation based on stepwise regression models are listed in the order in which they entered the particular model.
In the forward mode, at step zero, all independent variables are ranked by the R value obtained running simple regression analysis between the dependent and each one of the independent variables. The variable that produces the largest R value enters the model at step one, and the unexplained variance (residual δ18O) becomes the dependent variable in a reiteration of the procedure with the remaining independent variables. The largest R value obtained determines which variable enters the model at step two, and so on. Reiteration of the procedure ceases when there are no independent variables remaining, or if one or more of the remaining variables does not significantly improve the overall explanation of variance. in some cases, all variables enter the model, but the intercepl value and regression coefficient values for each variable are different from that obtained from common multivariate regression analysis, as will be shown below. It should be noted that the values of the intercept and of the coefficient of each variable that enter the model change at each step. Moreover, if the purpose of a particular analysis is to describe a physical rather than a statistical model, one or more of the variables can be forced into the model at any step; however, we do not do this in the present study.
Table. 3. Summary of stepwise analyses δ18O as the dependent variable)
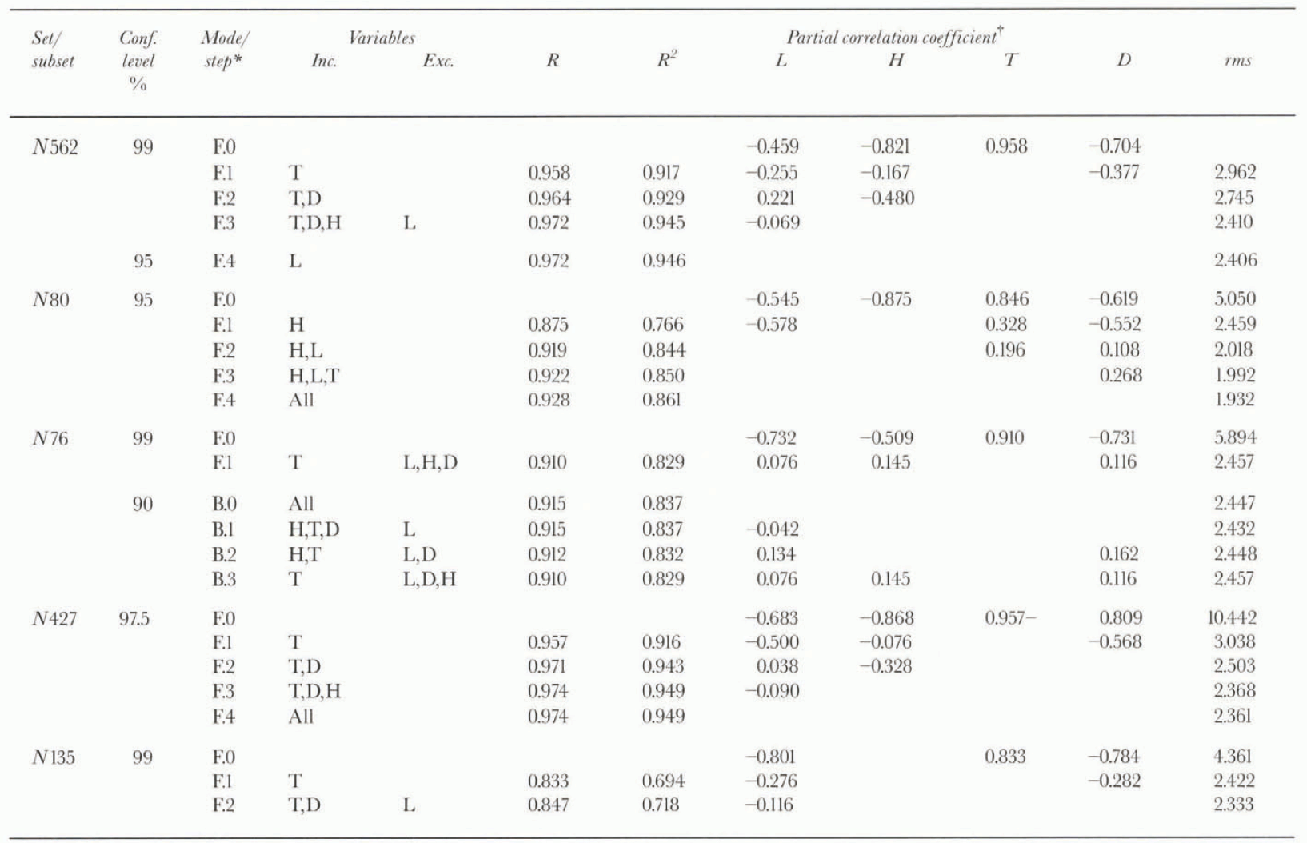
In the backward mode, at step zero, all independent variables are in the model. If a variable does not contribute significantly to the explanation of variance, it will be removed at step one, and so on at each following step. II all variables contribute at the selected significance level, no variable will be removed. The use of the backward mode is recommended when there is no interest in knowing the order in which the variables enter a model. Its use may also be recommended to confirm or question the marginal inclusion or exclusion of a variable in the forward procedure. Examples of this use of the backward mode applied to similar sets of variables can be found in studies of the areal distribution of δ18O in Greenland (Zwally and Giovinetto, 1997b) and in northeastern Canada (Giovinetto and others, 1997). Our analyses are performed using available software (e.g. StalView -![]() (Reference HaycockHaycock and others, 1992)).
(Reference HaycockHaycock and others, 1992)).
In the first stepwise analysis of N562, only three variables entered the model (T, D, H):

However, a confidence level of 99% is unnecessarily high in the case of relatively small datasets widespread over a large area (i.e. N < 104, over an area of the order of 107 km2) and in Which the values of δ18O, T and D are obtained as a mean for different periods that in many eases do not overlap, as described in a preceding section.
The F-to-entcr value for L at the end of step three in the procedure (2.682) is smaller than that set for the model at the 99% confidence level (3.800). We run a second stepwise analysis at the 95% confidence level (F-to-enter = 2.620) and L enters the model:

In an inversion, Equation (4) would be more sensitive to L than Equation (3), where the contribution of L is only through covariation with D and T. The use of Equation (4) would be preferable for Antarctica because, lower confidence level withstanding, the ice sheet extends over 20 of latitude.
We assess the probable regional variations with in the «encrai model comparing two models from physiographic-ally distinct regions. For this purpose we select an “interior” or “continental” region (the Lambert Glacier Amery Ice Shell” drainage system, henceforth referred to as the Lambert-Amery region) and a “coastal” or “maritime” region (the drainage systems in the Antarctic Peninsula region, which includes Graham and Palmer Lands as well as the islands and ice shelves: clockwise from approximately 76.5 W. the George VI, Wilkins, Wordie and Larsen Ice Shelves, henceforth referred to as the Peninsula region) (Fig. 1; lable 1).
In the Lambert-Amery region the data fN80) are characterized by relatively high latitude, high surface elevation, low surface temperature and long distance to open ocean. Precipitation in this area has a large component due to ad-vective uplift, and extensive surface slopes swept by strong katabatic flow redistribute fallen snow over long distances (Goodwin and others, 1994).

Fig. 3. Distribution of δ18O, produced by inversions of entity-specific models applied to field grid-data subsets (N1182 for the conterminous grounded ice, and N169 for the ice-shelf areas).

Fig. 4. Distribution of δ18Or produced by inversions of entity-specific models applied to remotely sensed grid-data subsets (N1182 for the conterminous grounded ice, and N169 for the ice-shelf areas).
In the Peninsula region the data (N76) are characterized by relatively low latitude, low to intermediate surface elevation, high surface temperature, and short distance to open ocean. Precipitation in this region is largely due to cyclonic activity (Reference Turner, Lachlan-Cope, Thomas and ColwellTurner and others, 1995) as well as advective uplift, and surface slopes are relatively short although steep; thus fallen snow transport over long distances is not importan!, although large changes in elevation between the location where a precipitation event occurs and the actual accumulation site introduces uncertainty in the analysis.
In the case of the Lambert Amery, only H and L enter the model at the 99% confidence level (R = 0.919, R2 = 0.844, rms = 2.018), and the F value-to-enter must be reduced to the 95% level for all four independent variables to enter:

In the case of the Peninsula, only T enters the model, and D, L and H do not enter even ai the 90% confidence level (a backward run in the stepwise procedure removes H first, followed by L and D, in this order):

The discrepancy between the models described in Equations (5) and (6) is large, albeit a probable maximum difference between particular models corresponding to regions of drainage-system scale. Nevertheless, the difference indicates the need to establish subregional models for drainage-basin areas, and shows that fiowline studies such as may be needed for detailed intreprctation of δ18O series obtained in deep cores must be narrowly defined.
Entity-Specific Models
We determine the entity-specific models for the conterminous grounded ice (N427) and the ice-shelf areas which include ice rises and islands attached by ice (N135). The N427 model,

is robust. Although L does not enter at the 99% confidence level, it does at the 97.5% level in the form

which we select for application to the grid data for the grounded ice area (M128).The AH35 model,

is also robust and adequate (or application to the grid data for the ice-shelf arcas (N169). Elevation is excluded from the analyses for icc-shclf areas, and L does not enter the model even if the F-to-enter value is reduced well below the 90% confidence level.
Inversions of the entity-specific models applied to the
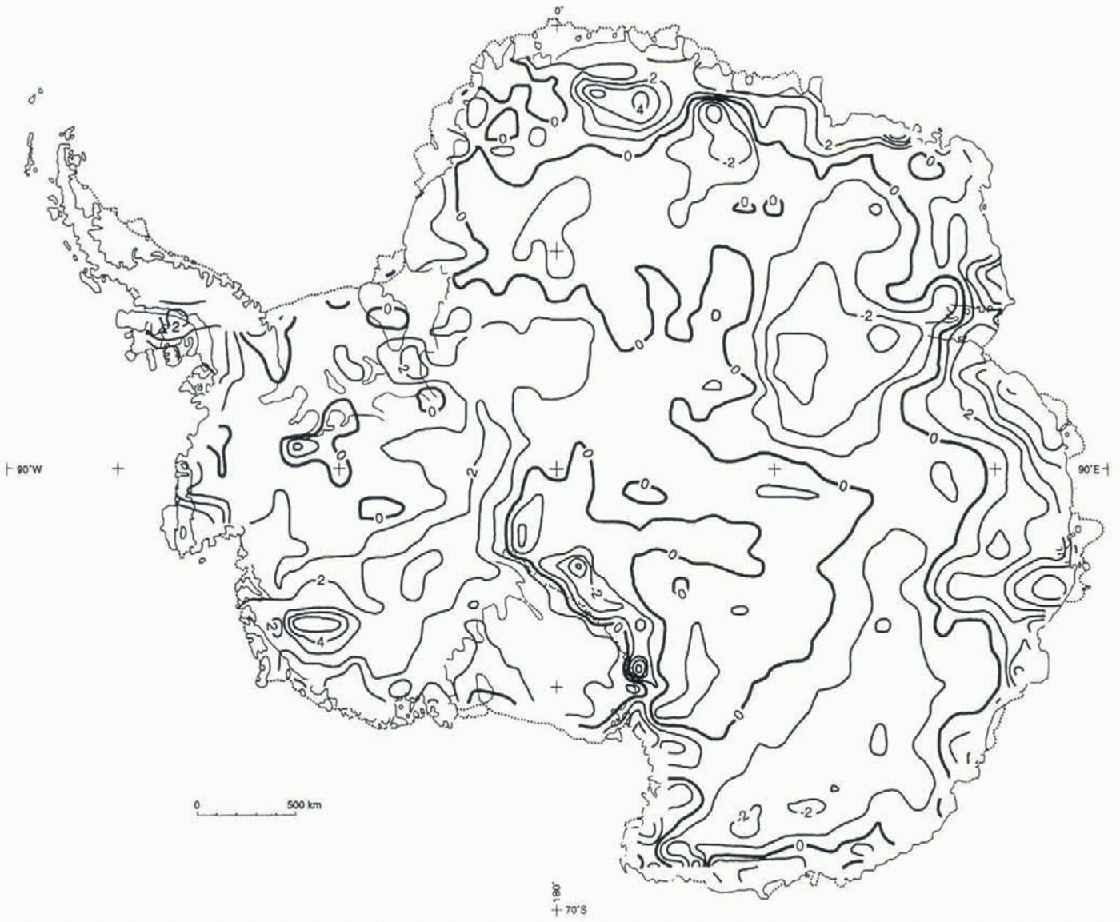
Fig. 5. Distribution of Δ18O; residuals are the difference between δ18Os and δ18Or.
grid-data subsets produce combined contoured distributions of δ18O (Fig. 3; inversion of Equation (8) applied to N1128 (Ts , Ds, Hs,L) and of Equation (9) applied to N169 (TS,DS)), and of δ18O, (Fig. 4; inversions of Equations (8) and (9) applied as stated above and substituting (Tr, Dr,Hr,L) and (Tr,Dr), respectively). Isopleths shown on ice shelves other than the Filchner-Ronne, Amery and Ross should be viewed with caution because the smaller ice shelves are sampled by insufficient gridpoints to produce reliable contours. We use a contouring algorithm based on a closest-neighbor approach involving the eight nearest grid-points (SURFACE III; Sampson, 1988). in our grid, each point value may be deemed to represent the value at the center of a square with side lengths of 100 km, while the surface created in contouring to obta in the interpolated value for the ninth point at the center of the pattern is determined from data distributed in a square with side lengths of 300 km.
Discussion and Conclusions
A visual comparison of the distributions obtained from the field and remotely sensed data shows that both subsets produce the same general pattern, with minor differences. For example, the distribution of δ18O is characterized by relatively smooth isopleths. This is to be expected because prior to the compilation of the field grid-data subset, both isotherms and contour lines are normally drawn to smooth the scatter of in situ temperature and élevai ion data, and are interpolated and extrapolated over long distances (e.g. between and beyond over-snow traverse routes). in contrast, the distribution of δ18O is not affected by smoothing prior to the compilation of the remotely sensed gridpoint data subset as it pertains to interpolation and extrapolation over long distances, and therefore the distribution pattern shows more detail.
The distribution of residuals (![]() ) shown in Figure 5 indicates that
) shown in Figure 5 indicates that ![]() values are relatively small in most of the area of the ice sheet, where they are equal to or less than the summation of rms values (srnis ≤ ±3.3) of any two models used in the inversions. This is to say, on the conterminous grounded-ice area, where Equation (8) is applied, srms =
values are relatively small in most of the area of the ice sheet, where they are equal to or less than the summation of rms values (srnis ≤ ±3.3) of any two models used in the inversions. This is to say, on the conterminous grounded-ice area, where Equation (8) is applied, srms = ![]() ), and on the ice-shelf areas, where Équation (9) is applied, srms =
), and on the ice-shelf areas, where Équation (9) is applied, srms = ![]() ). in general, the
). in general, the ![]() values are larger than srms in mountain regions and/or coastal zones:
values are larger than srms in mountain regions and/or coastal zones:
In West Antarctica, including the Ross and Filchner-Ronne Ice Shelves, an area centered on the mountainous region of the Executive Committee Range (77° S, 123° W; Δ18O = 5).
In East Antarctica, an area along the segment of the li-ansantarctic Mountains lying west of the Ross Ice Shelf (Δ18O = -4), and others along the coastal zone where ![]() , centered at longitudes of approx-imately 10°, 45°, 65°, 80° and 104° E.
, centered at longitudes of approx-imately 10°, 45°, 65°, 80° and 104° E.
All of the areas listed above correspond to mountain regions and/or regions of intense katabatic air flow (e.g. Reference Parish and BromwichParish and Bromwich, 1987). The sign of the residuals shows that for those areas and where ![]() smrs (the Trans-antarctic Mountains area west of the Ross Ice Shelf excepted), the use of remotely sensed data produces ratio values which are isotopically cooler. This is to lie expected since the type of topography and/or the implicit surface slope gradient in those areas, as well as the surface temperature variability induced by katabatic flow (e.g. Wendler and others, 1993), lead to unreliable long-distance interpolation and extrapolation of field data on temperature and elevation. in those areas δ18Or values are generally more reliable than δ18Os values.
smrs (the Trans-antarctic Mountains area west of the Ross Ice Shelf excepted), the use of remotely sensed data produces ratio values which are isotopically cooler. This is to lie expected since the type of topography and/or the implicit surface slope gradient in those areas, as well as the surface temperature variability induced by katabatic flow (e.g. Wendler and others, 1993), lead to unreliable long-distance interpolation and extrapolation of field data on temperature and elevation. in those areas δ18Or values are generally more reliable than δ18Os values.
The characteristics of the models provide a perspective to assess two aspects described by the analyses. One is the impact of including data for 33 sites located in Graham Land, Larsen Ice Shelf and eastern Palmer Land, and which are not sampled by the grid pattern; their inclusion enhanced the representation of the models for the coastal zone of both East and West Antarctica, with no significant decay in diagnostic statistics (cf., respectively, R and rms values for Equations (8) and (9) and (4) and (5) in a preceding study (Giovinetto and Zwally, 1997)).
The other aspect is the regional variation at drainage-system scale that may be expected with in the general model (Equations (3) and (4)) as illustrated by the models for the Lambert Amery and Peninsula regions (Equation (5) and (6), respectively), which suggest a variety of so-called independent variable combinations suffice to attain robust models(R2 ≥ 0.8). Nevertheless, we close with a note of caution as greater model variations should be expected for particular drainage basins and flowlines.
Acknowledgements
The authors gratefully acknowledge the contributions of M. Delmotte (Laboratoire de Modélisation du Climal ei de l'Environnement, Centre d'Études de Saclay) who completed the isotopic analyses for samples from the Lambert-Amery region, and of T. Medhurst, R. Thwaites, B. Hazel-ton, R. Kiernan and M. Higham (all from Australian National Antarctic Research Expeditions), who collected the firn samples for the same region, as well as other contributions by C. Conrad (Massachusetts Institute ofTechnol-ogy), s. Fiegles (Raytheon STX, (formerly Hughes STX)) and D. Phillips (University of Calgary).


