Introduction
This work has been developed within the framework of the European Project for Ice Goring in Antarctica (EPIGA). The main target of EPIGA is to extract an ice core from surface to bedrock (>3000 m depth) at Dome C, Antarctica.
The heat flow transferred through the polar ice sheet can be determined quantitatively by means of precise measurement, in the hole, of the thermal gradient profile dT/dz from the surface to the bedrock, and the punctual measurement of thermal conductivity A of the ice cores.
The Fourier equation Q = λ(dT/dz) for thermal steady-state conditions gives the value of the vertical component of the heat flow Q, provided the very slow movement and compaction of the ice sheet are accounted for and accurately modelled. Anomalies induced by climatic oscillations can be detected in this way, and experimental measurement of the thermal conductivity of ice cores taken from the ice cap is therefore important.
Apart from the heat-flow determination, measured values of A can provide important stratigraphic information. The value of A in natural ice is a variable quantity, depending on temperature, density, porosity and gas content, tephra and dust content, chemical content (salts, clathrate hydrates) and structural anisotropy of the ice including crystal size and c-axes orientation.
The measurement of A could therefore be used to characterise the stratigraphic sequence of the ice core as a function of time (or depth), along with the continuous temperature log of the borehole.
Thermal conductivity can also be matched with other parameters (electrical conductivity measurements, dielectric profiling, etc.) to strengthen the reliability of detection of anomalies.
The Instrument and Theoretical Model
An apparatus has been developed to determine the thermal conductivity of ice using the line-source method. The theoretical model adopted in the design of the apparatus was studied by Reference Carslaw and JaegerCarslaw and jaeger (1959) and developed with many applications (e.g. Reference BlackwellBlackwell, 1954; Reference JaegerJaeger, 1956; Reference Von Herzen and MaxwellVon Herzen and Maxwell, 1959; Reference ZierfussZierfuss, 1963; Reference Jaeger and SassJaeger and Sass, 1964; Reference Ito, Saito and NagumeoIto and others, 1977). The line-source method is suitable for use with cylindrical cores of rocks in which a heater is placed between two surfaces, one the sample to be measured, and the other an insulating medium.
The theoretical basis of the model is the long cylindrical probe method of Reference Carslaw and JaegerCarslaw and jaeger (1959). The probe is fitted with an axial heating wire that produces a single thermal pulse for a finite time with constant heating power, and generates cylindrical coaxial isotherms.
The transient temperature T, after a sufficiently long time t since the start of heat generation, can be written (Reference Jaeger and LeeJaeger, 1965) in the form

where A, B and C are constants that depend on the probe, Q is the heat supply per unit length and per unit time of the heating line-source, A is the thermal conductivity, a is the diffusivity and r is the radius of the heating wire.
If (r2a-1t-1) is small, T can be expressed with good approximation by the simplified form
The thermal conductivity A can be determined by tracking the temperature variations. If temperatures T1 and T2 are measured at times t1 and t2, the conductivity A is obtained from the difference T2 - T1 through the relation
The Probe and the Sensor
The heater is a flat-wire platinum resistor. For practical reasons the heat line-source lays on the plane surface separating two half-cylinders. One half-cylinder is the ice core, cut in half longitudinally. The other is the insulating material of the probe.
The thermal conductivities of the two half-cylinders are "in parallel", i.e. the conductivity of the insulating medium of the probe is added to that of the sample material, and must therefore be considered in the calculation of the final result. Small errors may occur if the diffusivities of the media in the two half-cylinders are different.
Assuming (t2t–1) is constant, we obtain a more simplified form of λ:
where K includes ln(t2t1-1) and other constant terms, P is a parameter proportional to the electric power supplied to the heating flat-wire and H is a constant term that depends on the insulating material of the probe. Both K and H are given by calibration procedures (by means of standard samples with a certified A value) for the precise adjustment of the apparatus.
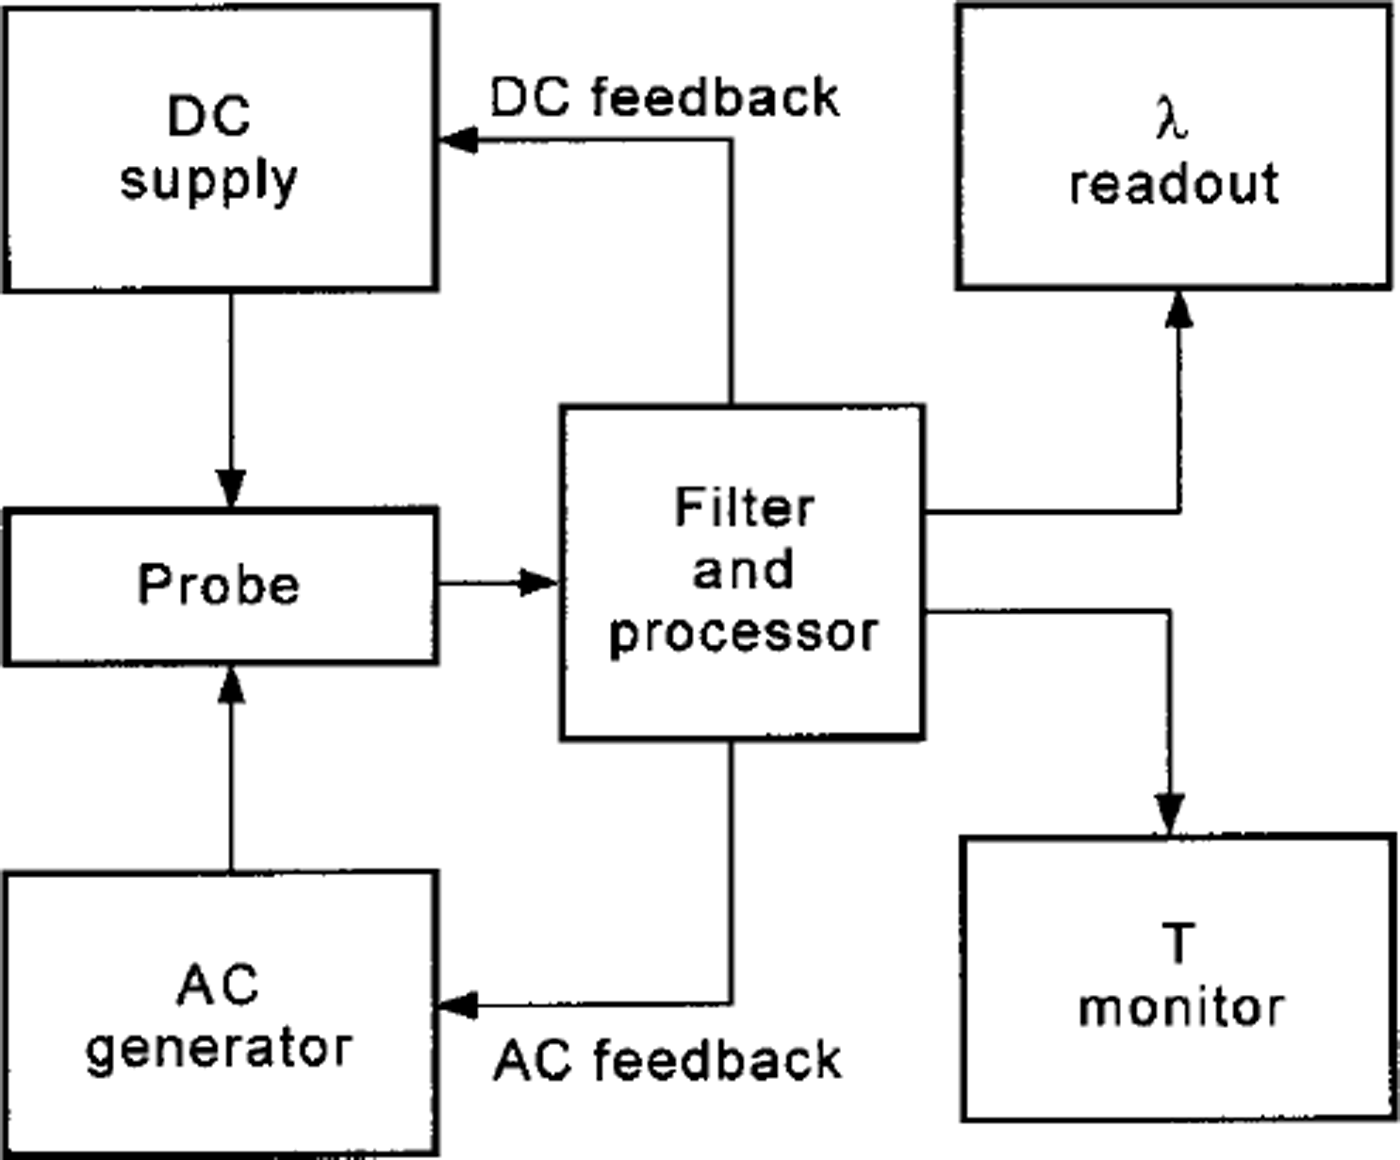
The theoretical model presumes a heating line-source of infinite length in an infinite homogeneous space. The probe must have suitable geometric dimensions to minimise deviations from the cylindrical symmetry and boundary effects. It is also important that the selected times t1and t2 of the measurement cycle are appropriate to keep the behaviour of the physical system within valid limits of the theoretical model. A heat pulse transferred by the probe flat wire to the sample for 40 s gives a temperature increment of about 7-14°C at the contact between the sample surface and the probe. The operation procedure for each measurement requires a few minutes. The heat-sensing element is a platinum resistor (flat-wire) with a double function: heating and temperature measurement. A central segment of the same platinum resistor is, in fact, used as a thermal sensor. The technical solution that permits these two independent functions consists of two electric-power supplies operating independently and simultaneously. A block diagram is shown in Figure 1. To begin, a relatively low a.c. current is supplied to the platinum flat-wire. It is automatically regulated by the a.c. feedback to remain constant. Thus the a.c. voltage, measured on the central segment of the wire, operates as a sensor of the wire temperature. A second d.c. current of suitable intensity is overlapped on the a.c. current on the same platinum wire to operate as a heating unit. It generates a thermal field with cylindrical symmetry, the axis of which coincides with the heating wire. The heating effect of the low-power a.c. supply is negligible (10-3) compared to the d.c. heating power. The d.c. heating power is supplied for 40 s for each measurement cycle, and it is automatically regulated by the d.c. feedback to remain constant. The T2 - T1 value is given by the temperature signal, after filtering from the d.c. heating voltage. The T2 - 7\ value is then processed to directly obtain the conductivity A.

Fig. 1. Block diagram of the apparatus for measuring thermal conductivity.
Experimental Results and Errors
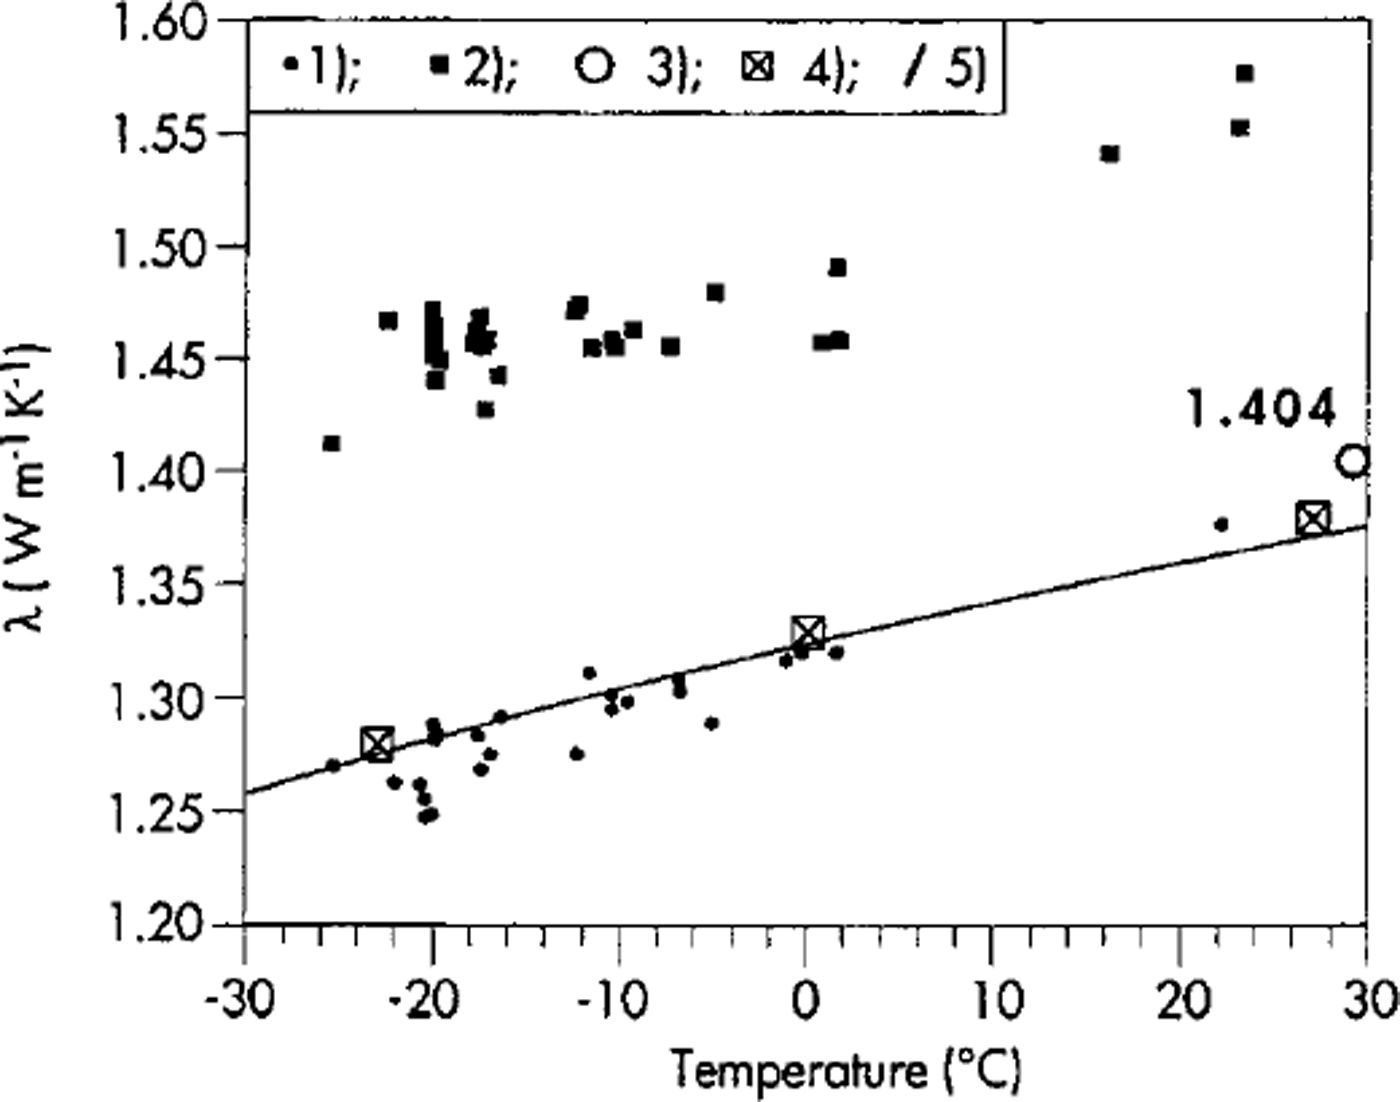
The instrument has undergone calibration and repeatability tests. Some calibration tests and measuring procedures have also been carried out in a cold room at temperatures down to -25°C. Calibration tests were run using different reference samples with certified values of thermal conductivity. In good experimental conditions, measurements are easily reproducible within ±3% of the A value. Figure 2 shows some measurements made with this apparatus, at different temperatures, with reference samples of silica glass and Zerodur glass samples. The accuracy of this relative method depends on whether the instrument has been calibrated by reliable standard samples certified by absolute methods.

Fig. 2. Measurement of λ at different temperatures with: (1) silica glass (fused quartz) standard samples; (2) Zerodur glass samples. For the silica standard samples the reference λ values are also indicated as: (3) certified by Showa Denko K.K., Tokyo, Japan; (4) recommended by National Standard Reference Data System, U.S. National Bureau of Standards 8 (1966); (5) curve of λ as from Reference RatcliffeRatcliffe (1959).
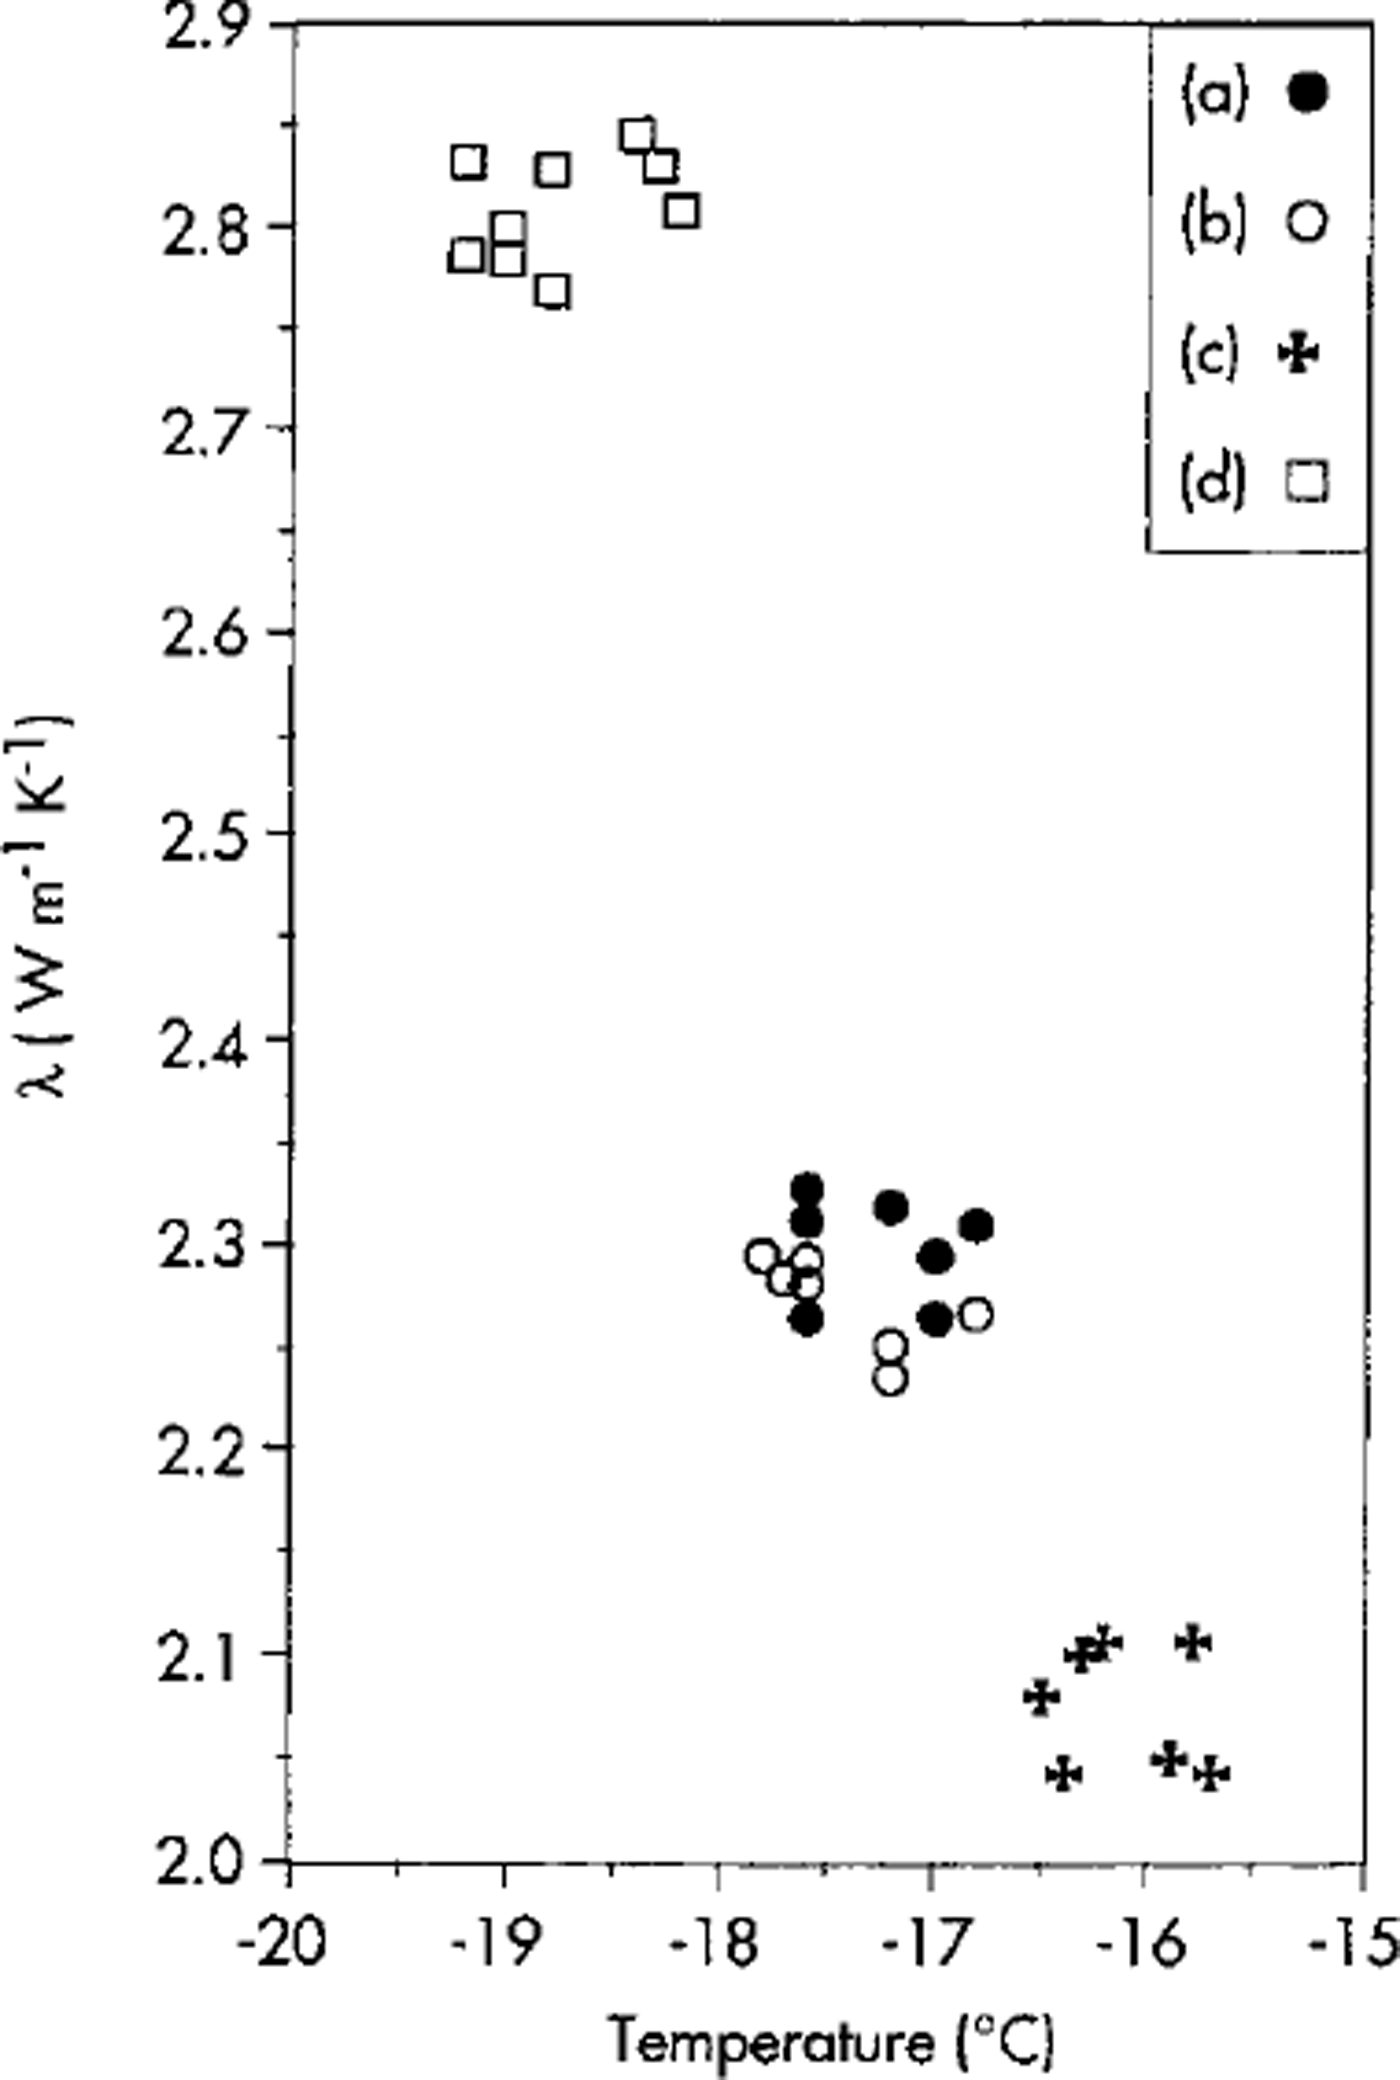
Figure 3 shows an example of the measurements carried out so far in a cold room, giving A values of 21-2.5Wm-11 K-1 at -20°C for samples of ice prepared with tap water and distilled water. These values are consistent with those reported by Reference ClarkClark (1966) and Reference Beblo and AngenheisterBeblo and others (1982). For comparison, Figure 3 also shows the A values measured on a Zirconia (glass ceramic) sample assumed to be a stable reference sample.

Fig. 3. Values of λ measured on two samples of distilled-water ice (a,b), a sample of tap-water ice (c) and a Zirconia reference sample (d).
The main sources of error affecting the measurements are (1) surface roughness of the ice sample and irregular contact between the ice surface and the probe surface (contact resistance), and (2) thermal drift affecting the sample, i.e. the sample not being in a thermal steady-state condition. It is important to know the true temperature reached by the sample during the measurement cycle because the thermal conductivity of the material depends on temperature and may change by several per cent in a few tens of degrees. This is particularly true when measuring standard samples used for calibration. For this reason the temperature trend was experimentally verified during the thermal cycle for the measurement of A on some ice samples prepared with tap water and distilled water. Starting at the steady thermal condition of T0 at initial time t0, the platinum wire of the probe generates a thermal pulse with constant heating power for 40 s. As a typical example, the temperature rise of the wire from the initial value of T0 = -22°C is shown by curve a in Figure 4. Within 1s, the thermal pulse crosses the thin protective Kapton film of the probe surface and begins to heat the underlying surface of the ice sample to which the probe is coupled. Due to the temperature drop through the Kapton film, and the unavoidable thermal contact resistance between the probe and the ice surface, the temperature of the ice surface underlying the heating wire (curve b in Fig. 4) is 6°G lower than that of the heating wire itself.

Fig. 4. Measurement cycle. Typical temperature rise during the 40 s period of heating impulse: (a) temperature measured on the flat wire; (b) temperature at the surface of the sample.
To estimate the typical temperature drop, a test was done by measuring a "heat-sink" (e.g. a thick copper plate with A value two orders of magnitude higher than that of the ice) in place of the test sample. When the measurement cycle started, the observed temperature rise of the heating wire was about 6°C, while the copper plate retained the initial temperature. For an ice sample at -22°C with an observed temperature reached by the heating wire at the end of the thermal cycle of-6°C (as shown by curve a of Fig. 4), the true temperature of the sample surface along the contact line under the heating wire was -12°C, as shown by curve b of Figure 4. Thus the Figure 4 example shows at the end of the cycle a maximum temperature increment of 10°C on the sample surface and 16°C on the heating wire. The thermal front develops progressively and penetrates a few cm into the ice sample without reaching either the lower or the lateral borders. To obtain reliable results it is essential that after the 40 s period of the measurement cycle, the outer edge of the sample retains the initial T0 temperature, as required by the theoretical model of infinite homogeneous space. The conventional reference temperature associated with a measured value of A is given empirically by the intermediate temperature between the maximum value reached on the sample surface and the initial undisturbed T0 value. From Figure 4, the temperature increment during the last part of the heating cycle, from t = 20 s to t = 40 s, is used to measure A. During this 20 s period the temperature rise may be only about PC. It is therefore essential that the sample be in a thermal steady-state condition with the probe and the environment before starting the heating cycle. In order to verify this important condition the apparatus is fitted with a null detector in the front panel (T-monitor; Fig. 1) showing temperature variations as small as 10-2oC on the thermal sensor of the probe. With this detector the initial temperature T0 can be continuously monitored until the thermal steady state is reached.
Measurement of on Ice Gores
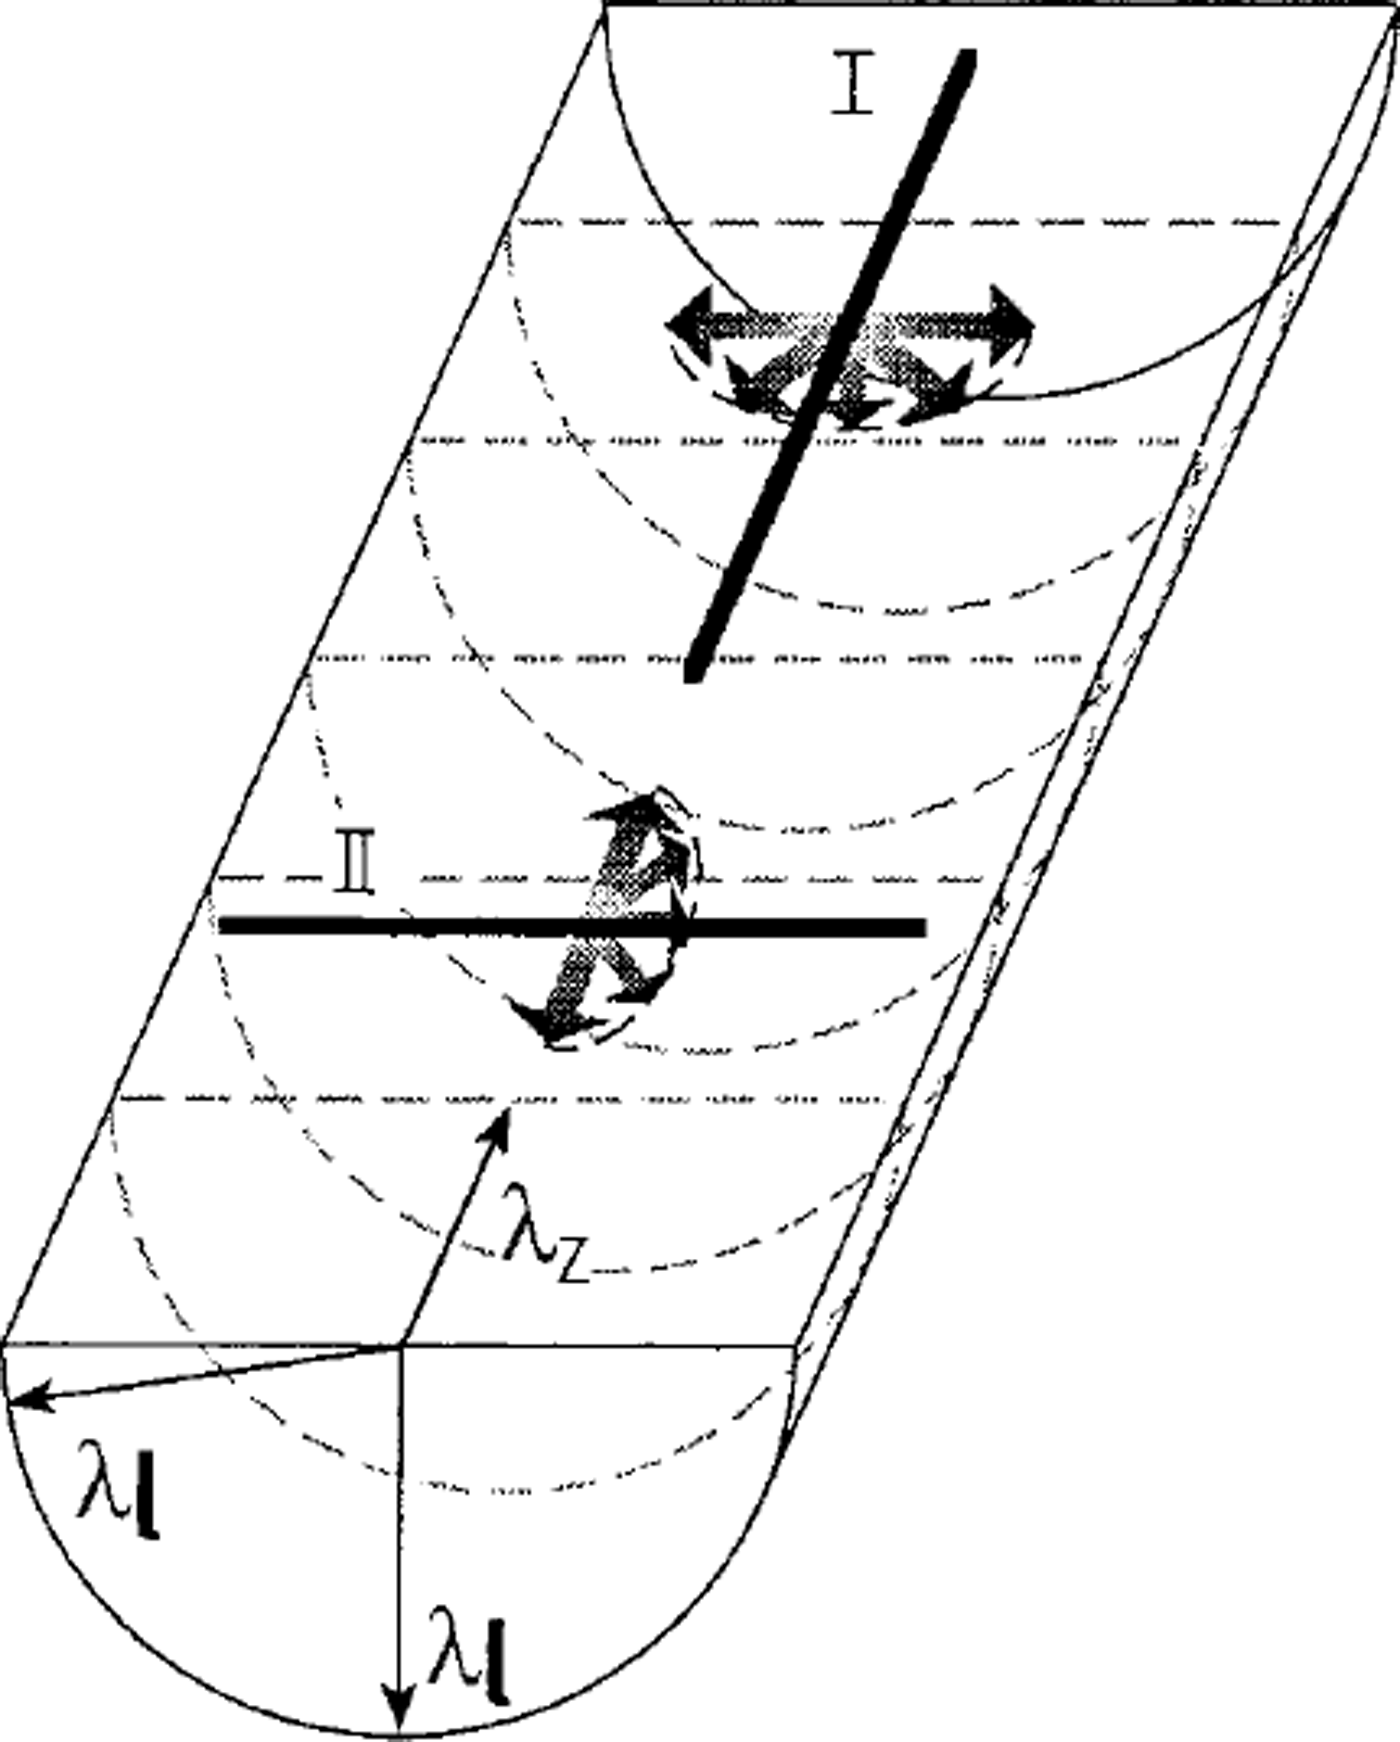
We assume that the heat flow is perpendicular to the surface of the ice cap and to the ice layers. We also assume that the borehole is near vertical. The ice core is layered and anisotropic. We want to determine the vertical component λz of the thermal conductivity by taking two different measurements with the probe applied in the two orthogonal directions (I and II in Fig. 5). In position I the thermal pulse generated by the line-source of the probe lies on the axis of the cylindrical ice core. In this case, the induced thermal pulse propagates in a radial direction, always following the horizontal layering planes. The thermal conductivity of the horizontal layer is then determined (λ1). In position II the heating line-source of the probe lies orthogonal to the axis of the ice core. In this case, the radial thermal wave propagates both horizontally and vertically, and we measure a combined value of thermal conductivity Ac (not shown in Fig. 5). The core samples must be large enough to prevent boundary effects on the measurements made with the probe orthogonal to the core axis, in which case it is more difficult to maintain the condition of cylindrical symmetry and cylindrical coaxial isotherms. The vertical component λz of the thermal conductivity is then given by (Reference Grubbe, Haenel and ZothGrubbe and others,1983)

Fig. 5. Scheme of thermal conductivity measurement of an ice-core sample.
The ice core can be scanned with six measurement points per metre on a flat surface cut with a band-saw along the core axis.
Acknowledgements
This research is part of the project on glaciology and paleo-climatology of the Programma Nazionale Ricerche in Antartide, and is supported by Ente per le Nuove Tecnologie, l’Energia e lAmbiente through a cooperative agreement with the University of Milan.


