


1. Introduction
Japanese Antarctic Research Expeditions (JARE) have collected data on surface elevation, ice thickness, ice velocity, snow accumulation rate, snow temperature–depth profiles, stratigraphic and density profiles, surface snow features and paleo-environmental record from shallow ice cores along the traverse routes from Syowa station to Dome Fuji in east Dronning Maud Land. It is now possible to discuss the variation of proxy climate records of temperature and also precipitation in the Shirase drainage basin, which originates at Dome Fuji. This record is useful for predicting mass-balance change as a result of future global climatic change.
To evaluate the changes in past climate and surface mass balance of the ice sheet, shallow (100–200m depth) ice coring has been conducted at several locations in the last decade. These cores are part of the International Trans-Antarctic Scientific Expedition (ITASE) program, which plans to extend the Antarctic record of change in climate, atmospheric chemistry and surface mass balance back to about 200 years ago, and contribute to an understanding of the interaction between global change and the Antarctic continent.
Studies on shallow ice cores are focused on dating layers and determining the specific layer for absolute dating using unique stratigraphic markers. Development of an annually resolved ice-core series is recognized as an essential component of the ITASE program because of the need for comparison. Several methods have been used to date the ice cores, in order to strengthen the interpretation. These include annual-layer counting of stable isotopes, chemistry, solid electrical conductivity measurements (ECM) and stratigraphic properties. These annual-layer counting methods are calibrated using volcanic and nuclear fallout markers. Stable-isotope measurements of ice (δ18O) have classically been employed as a proxy for temperature and accumulation by annual-layer counting in the dry snow zones of Antarctica and Greenland. Measurements of recent annual accumulation using snow stakes have been undertaken to provide a comparison with direct measurements of snow surface temperature time series and accumulation rate derived from ice-core analysis.
It is essential to determine annual layers to reconstruct the past environment from ice cores. We employed snow-stake data back to AD 1972, tritium content, solid ECM and stratigraphic properties for the H72 ice core. In this paper, we report how we determined the annual layers of the H72 ice core, and present results of surface mass balance and chemical components for the past 167 years from this site.
2. Coring Site and Surface Mass Balance During Recent Decades
The 73 m ice core was obtained in September 1998 at H72, (69˚12’17’’ S, 41˚05’26’’ E; 1214ma.s.l.) in east Dronning Maud Land, Antarctic ice sheet (Fig. 1), by JARE-39 (Japanese Antarctic Research Expedition, 1999). Figure 2 shows the surface mass balance at H72 from AD1973 to 1998 by the stake method. Data from each year have been published in JARE data reports (Reference Yamada, Narita, Okuhira, Fukutani, Fujisawa and ShiratsuchiYamada and others, 1975; Reference YokoyamaYokoyama, 1975; Reference SatowSatow, 1977; Reference FujiiFujii, 1978; Reference NishioNishio, 1978; Reference Wada, Yamanouchi and MaeWada and others, 1981; Reference Kobayashi, Ohata, Ishikawa, Matsubara and KawaguchiKobayashi and others, 1982; Reference Satow, Nishimura and InoueSatow and others, 1983; Reference Nakawo, Narita and IsobeNakawo and others, 1984; Reference TakahashiTakahashi, 1984; Reference Fujii, Kawada, Yoshida and MatsumotoFujii and others, 1986,Reference Fujii, Motoyama and Azuma1995; Reference Ageta, Kikuchi, Kamiyama and OkuhiraAgeta and others, 1987; Reference Nishio, Omae and OsadaNishio and others, 1988; Reference Nishio and OmaeNishio and Omae, 1989; Reference Watanabe, Furukawa and FujitaWatanabe and others, 1990; Reference Kamiyama, Furukawa, Maeno, Kishi and KanaoKamiyama and others, 1994; Reference Motoyama, Enomoto, Miyahara and KoikeMotoyama and others, 1995,Reference Motoyama, Kawamura, Kanao, Hirasawa, Kaneto and Yamanouchi1999; Reference ShiraiwaShiraiwa and others, 1996; Reference AzumaAzuma and others, 1997).
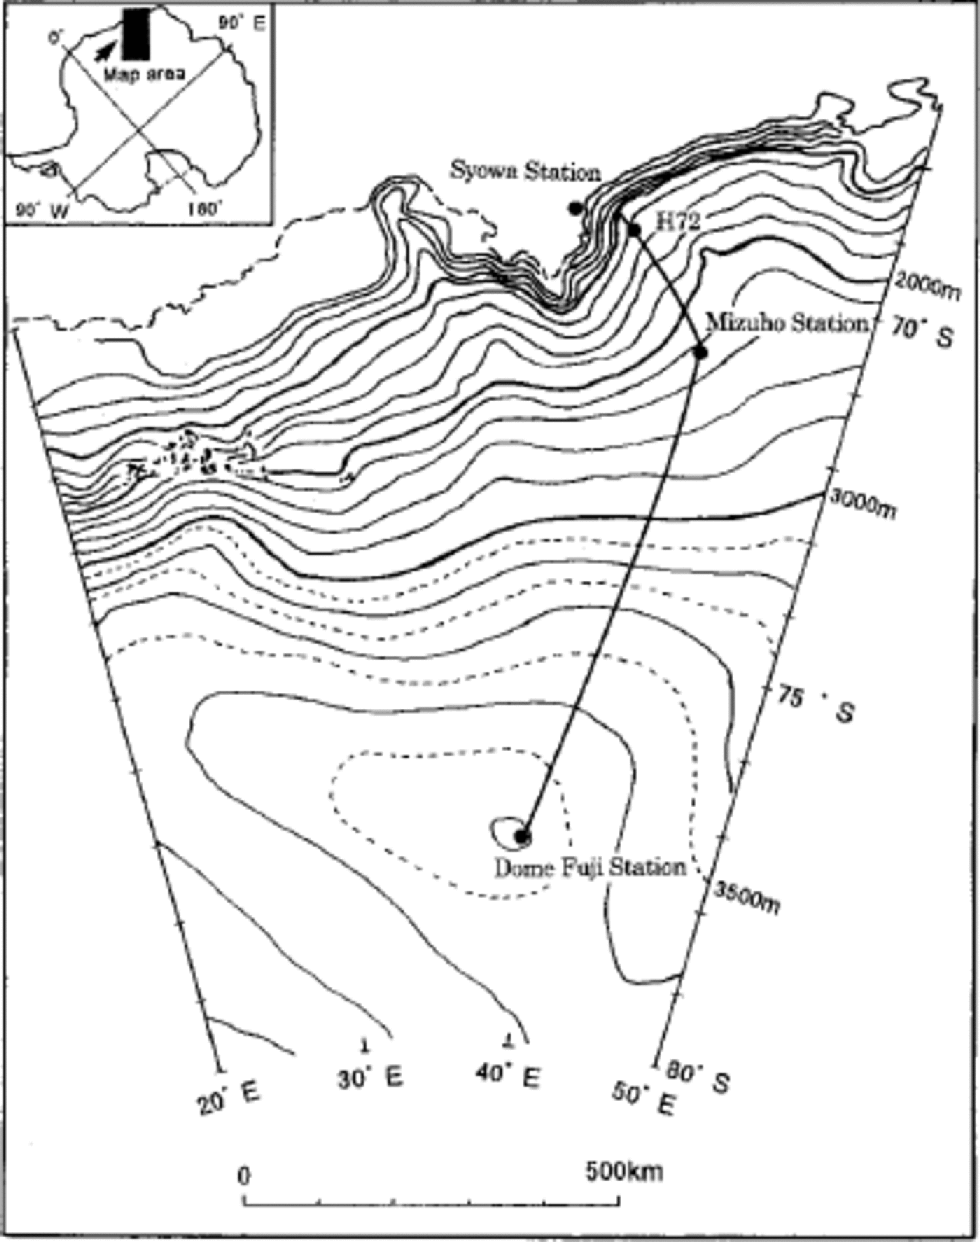
Fig. 1 Map of location of H72 core site, east Dronning Maud Land, Antarctica.
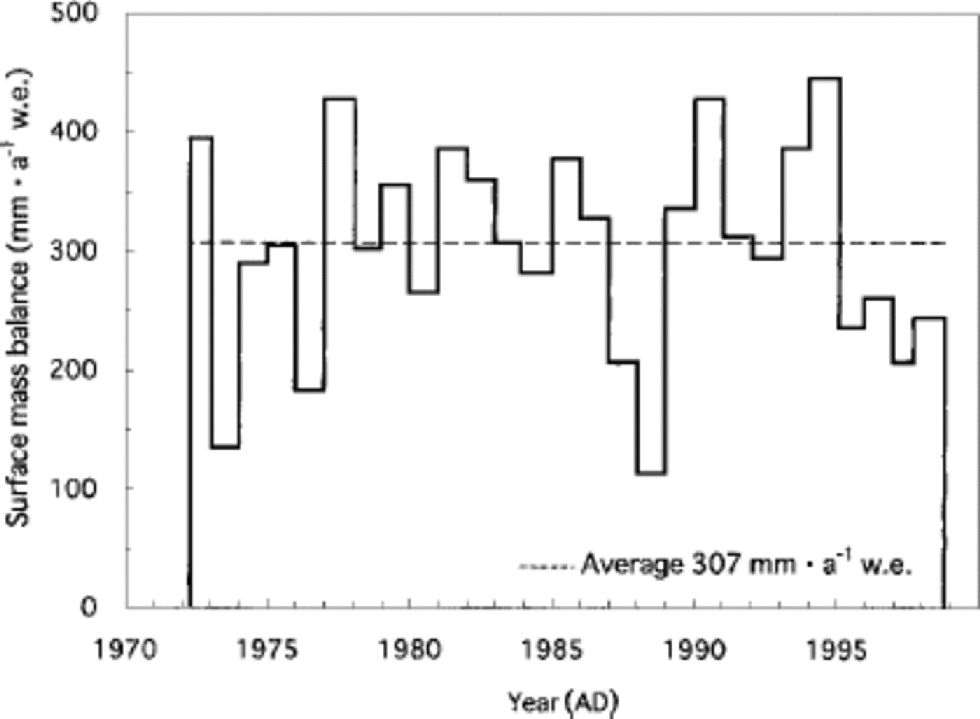
Fig. 2 Surface mass balance at H72 by snow-stake method (April 1972–October 1998).
It is often observed in the coastal region of east Dronning Maud Land that snow does not accumulate every year, due to strong katabatic winds (Reference WatanabeWatanabe, 1978). However, annual surface mass balance at H72 is always positive and the average surface mass balance during the 26 year period April 1972–October 1998 is 307 mma–1 w.e. Because H72 is located at the point where the mean surface slope changes from 0.8˚(H72 to 2 km upstream area) to 0.3˚(H72 to 2 km downstream area), it seems that snow tends to accumulate at the base of this gentle slope. We found only five sites at which >200mma–1 of snow accumulates every year along the traverse route between S16 (550ma.s.l.) and Mizuho station (2260ma.s.l.) using 17 years (AD1973–89) of snow-stake data. These amount to only 4% of the snow-stake sites along the route (Reference OsadaOsada, 1994). Thus, annually resolved climatic and environmental data in east Dronning Maud Land can be obtained from analyses of the H72 ice core.
1n.d. = not detected; the minimum detection level is 0.006 μmol L–1.
3. Age Determination of the H72 Ice Core
3.1. Densification model
The 10 msnow temperature at H72 is estimated to be –20.3˚C based on the 10m depth snow-temperature distribution in east Dronning Maud Land (Reference SatowSatow,1978). Bulk density of the entire ice core was measured using an electronic balance, a scale and a caliper. It was measured from the surface to the core bottom (73.285m depth) at about 40 cm intervals. Figure 3 shows the ice-core density data with a ``best-fit’’ profile by the empirical densification model of Reference Herron and LangwayHerron and Langway (1980). An average surface mass balance of 317 mma–1 w.e. is obtained from the model. for the above calculations, the following values are used: surface snow density (400 kg m–3), 10 m snow temperature (–20.3˚C), ice density ρi (917 kg m–3), k1 (0.0218m–1) and the slope of the second stage of the densification profile (0.0355m–1). the parameter k1 is defined by equation (6b) in Reference Herron and LangwayHerron and Langway (1980), and ``second stage’’ refers to the density region 550–800 kg m–3.
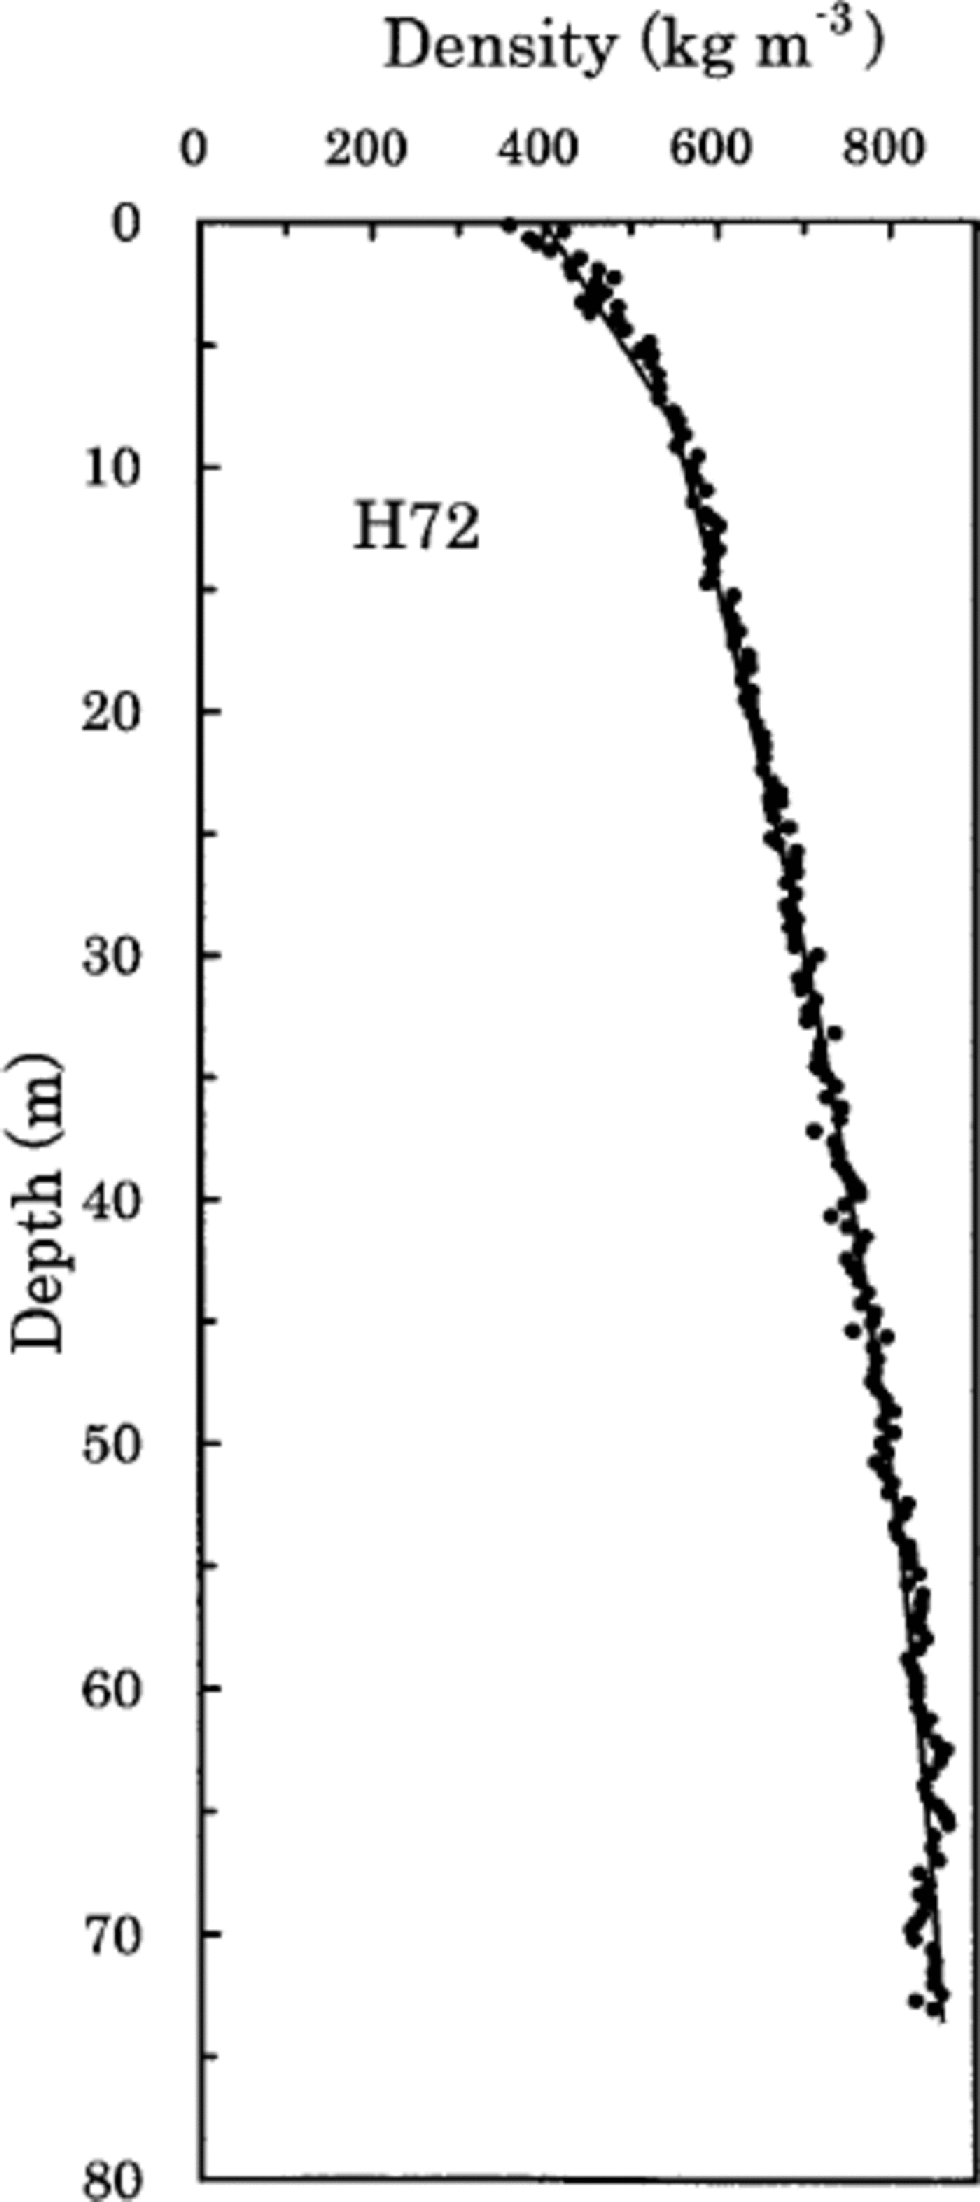
Fig. 3 Depth–density data with calculated profile by Reference Herron and LangwayHerron and Langway (1980).
3.2. Time markers by volcanic events
The acid concentration derived from H2SO4, HCl and HF is higher in the ice-core signals from volcanic eruptions (e.g. Reference HammerHammer, 1980; Reference Legrand and Delmas.Legrand and Delmas, 1987; Reference Moore, Narita and MaenoMoore and others, 1991). We found several high peaks of SO4 2– and Cl– in the H72 ice core, but these signals do not indicate significant peaks of elevated concentration. We consider that the peaks of Cl– are not of volcanic origin but probably originate from sea water since the ratios of Cl– to Na+ at all peaks are similar to that of sea water. the SO4 2– has several origins (e.g. sea water, marine biogenic dimethylsulfide (DMS) and volcanic eruptions). We employed the profile of non-sea-salt SO4 2– (hereafter nssSO4 2–) concentration to detect volcanic signals. the nssSO4 2– in the H72 ice core indicates a periodic seasonal fluctuation caused by marine biogenic DMS, and the maximum value occurs during summer (Reference Ayers, Ivey and GilletAyers and others, 1991; Reference OsadaOsada, 1994; Reference Koga and TanakaKoga and Tanaka, 1996). the highest values are almost the same level as the 2σ level (0.76 μmol L–1) of nssSO4 2– data from the surface to the bottom (73.16m depth).
We found 11 spike-like signals exceeding 2σ in the nssSO4 2– data and assume that these peaks are candidates for volcanic signals. Using pH and methanesulfonic acid (MSA) concentration at the same depth, we classified the spikes into two categories since methanesulfonic acid (MSA) is formed by atmospheric oxidation of DMS (Reference Savoie, Prospero, Larsen and Saltzman.Savoie and others, 1992). the characteristics of the two categories are as follows. In categoryA, the nssSO4 2– value exceeds 2σ, and both pH and MSA are lower than their average values (5.32 and 0.046 μmolL–1, respectively); therefore, these signals show the highest reliability in volcanic signals. In category B, the nssSO4 2– value exceeds 2σ, and either the pH or MSA is higher than its average value. These signals show lower reliability than categoryA as indicators of volcanic signals.
We also employed ECM current to detect volcanic signals since ECM current reflects acidity in ice cores (e.g. Reference HammerHammer, 1980). ECM current depends on ice-core density, showing a lower background current at a shallow depth of 24m (density ~650 kg m–3) than in deeper sections. the spike-like signals in ECM current exceeding 2σ (1.41 μA above 24 m depth, and 2.76 μA below 24 m) are considered to be derived from volcanic acids such as H2SO4, HCl, HF (Reference ClausenClausen and others, 1997). Using H+ concentration at the same depth, we classified these spikes into two categories as follows. In category A, ECM current is >2σ and H+ concentration is high; therefore, these signals show the highest reliability as indicators for volcanic signals. the signals in category B have ECM current >2σ, but the H+ concentration is lower than average (5.01 μmol L–1); they have a lower reliability as volcanic indicators.
Using the two procedures described above, reliability numbers for each volcanic signal are given in Table 1. Reliability ``1’’ is the highest level, with both the nssSO4 2– and ECM signals in category A. Reliability ``2’’ is the second highest level, corresponding to a single A rating for either the nssSO4 2– or the ECM signal. Reliability ``3’’ is the lowest level, corresponding to remaining events with a B rating for either nssSO4 2– or ECM. Probable source volcanoes for each volcanic signal are investigated using Reference Simkin and SiebertSimkin and Siebert (1994) and Reference Kohno, Fujii, Kusakabe and FukuokaKohno and others (1999) as shown in Table 1.
Table 1. Volcanic signals and their chemical compositions found in the H72 ice core, and their probable source volcanoes
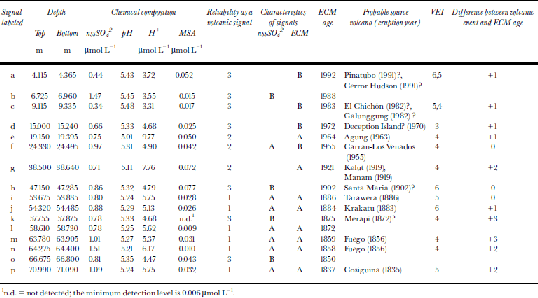
The symbol ``?’’ is added at the end of the names of the source volcanoes for which the reliability of the signals is ``3’’. It is possible that signal b originates from an eruption by Nevado del Ruiz, Colombia, in 1985 (volcanic explosivity index (VEI) = 3), and signal l from Purace, Colombia, in 1869 (VEI = 3). the difference between ages counted by ECM current and volcanic eruption years is also shown in Table 1. the age difference is in the range 0 to +3, which is on the same order as the transportation time from volcanoes to the Antarctic ice sheet.
3.3. Dating by ECM current, visual stratigraphy, tritiumcontent, stable isotopes and major chemical ions
ECM was carried out continuously for the H72 ice core. Reference NishioNishio and others (2001) describe the instrumentation and the analytical procedure used. We can detect the acidity of an ice core with high resolution by ECM current (Reference HammerHammer, 1980), and obtain the total amount of H+ ions (Reference Hammer, Oeschger and LangwayHammer, 1989). There are seasonal variations of acidity in snowfall. for instance, high sulfuric acid related to regional oceanic production of sulfur-rich gases, methanesulfonic acid (MSA), is generally detected in January around the Antarctic coastal region (Reference Legrand, Wolff and WagenbachLegrand and others, 1999). These seasonal characteristics are used to detect summer layers in an ice core by ECM.
The characteristics of visual stratigraphy in the H72 ice core are associated with atmospheric conditions. An example is the number of ice-crust layers contained in the H72 ice core. Ice-crust layers are classified into two types according to whether or not the ice crust includes air bubbles, based on observation by eye from digital video images. One is a multilayered ice crust (CR-1) including air bubbles. the other is a single-layered ice crust (CR-2) without air bubbles, which was probably formed by the melting and refreezing process at the snow surface during the warm period (Reference Narita and WatanabeNarita and Watanabe, 1977). Figure 4 shows profiles of visual stratigraphy, ECM current, δ18O, nssSO4 2–, MSA and NO3 –. Visual stratigraphy is composed of mosaicked pictures, which are continuously taken by digital video camera along the ice core. the high ECM current with ice-crust layer (CR-2) is apparently identified as a summer layer as shown at depths of 19.45–19.50, 20.17–20.21, 20.74–20.79 and 21.09–21.14m. the nssSO4 2– and NO3 – concentrations also indicate high peaks as summer layers at the same depths of ice core; on the other hand, the high δ18O peak is found at slightly shallower depths, so it seems to appear a few months later than the ECM peak. Thus, we count seasonal variations by the high ECM current with ice-crust layer (CR-2) for the whole H72 core, and we define this dating as the ECM age. Althoughthe δ18O peak indicates seasonal variations in Figure 4, the seasonal variation of δ18O becomes unclear below about 40 m depth. When the ECM age and the δ18O age are compared with the time marker of volcanic events listed in Table 1, the dating by the δ18O age is younger than the ECM age. the comparison for ECM age with the time marker of volcanic events is discussed in section 3.4.

Fig. 4 Profiles of visual stratigraphy, ECM current, δ18O, nssSO4 2–, MSA and NO3 – from 19.40 to 21.60 m. Visual stratigraphy is composed of mosaicked pictures continuously taken by digital video camera along the ice core. Ice crust CR-1 is multi-layered and includes air bubbles. Ice crust CR-2 is identified as probably summer layers at depths of 19.45–19.50, 20.17–20.21m, 20.74–20.79 and 21.09–21.14 m. C.B. signifies a break in the core.
Figure 5 shows tritium content, snow-stake record at H72 (as shown in Fig. 2) and ECM current from surface to 25m depth. Solid lines below the ECM age indicate the annual-layer boundary detected by ECM current with CR-2 type ice-crust layer. the ECM age agrees with the snow-stake record back to AD 1972 from the surface to 15 m depth. As shown on the left side in Figure 5, we analyzed tritium content from 2.17 to 24.85 m and detected seven tritium peaks at depths of 14.00–14.25, 15.24–15.49, 16.22–16.46, 17.69–17.94, 19.39–19.57, 20.47–20.68 and 22.60–22.85m. According to AD 1978 pit results at the South Pole (Reference Jouzel, L., Pourchet and LoriusJouzel and others, 1979), we can identify these peaks as AD1973, 1971,1969,1966,1963,1962 and 1958, respectively. ECM ages are closely coincident with tritium ages of AD1963,1962 and 1958, however; the other four tritium ages of AD 1966,1969, 1971 and 1973 are about 1 year older than the ECM ages. the reason for the age difference is not clear, since substances from the Northern Hemisphere (NH) will transfer to the interior of the Antarctic ice sheet through the stratosphere, and transportation time from NH to the South Pole is considered to be shorter than that from NH to the coastal region at the H72 site (Reference Kamiyama, Ageta and FujiiKamiyama and others, 1989).
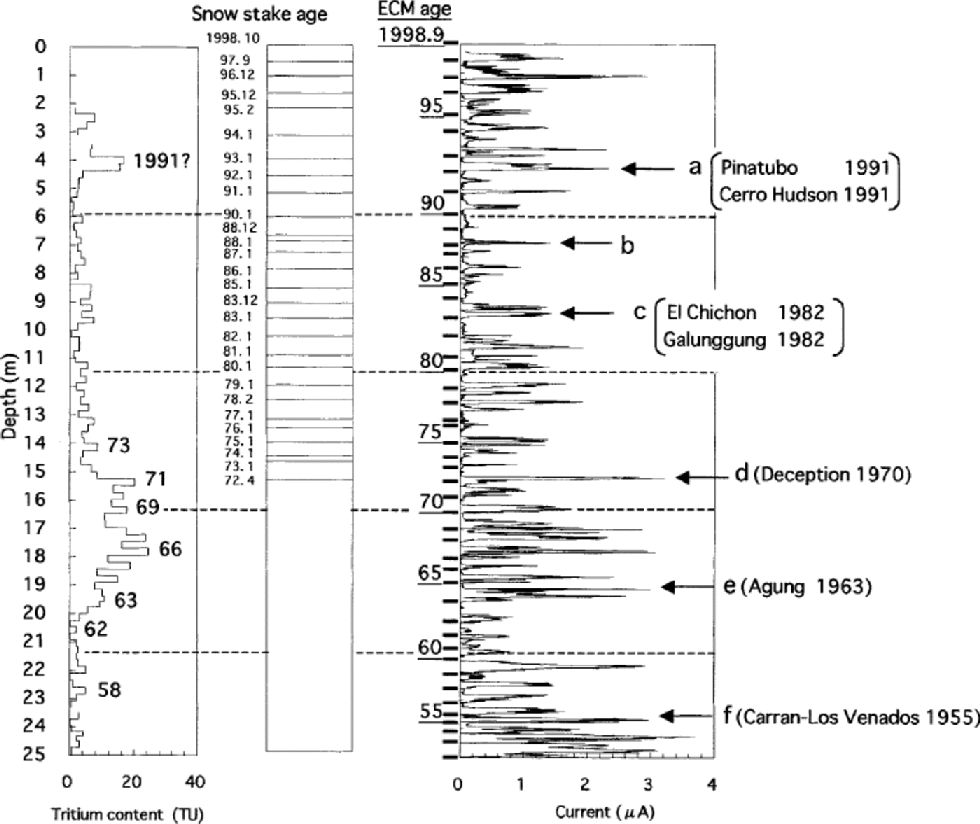
Fig. 5 Comparison of dating with tritium, snow-stake record and ECMfrom snow surface to 25 m depth. the solid line indicates annual boundary detected by ECM current with visual stratigraphy (CR-2). Arrows show the ages measured by snow stakes. the tritium profile is compared with ECM ages from the surface to 25 m depth. Seven tritium peaks are inferred from the South Pole (Reference Jouzel, L., Pourchet and LoriusJouzel and others, 1979) except for the unknown peak of 1991.
3.4. Annual-layer boundary by ECM current profile
As described in section 3.3, ECM current detects the acidity variations of ice due to seasonal signals such as oceanic sea-salt ions, marine biogenic origin material and background nitric acid, and non-seasonal signals caused by volcanic eruptions. Therefore, we must distinguish between seasonal and volcanic components in the ECM-current data.
To discriminate between the non-seasonal signal and the ECM current, the ECM current is compared with visual stratigraphy in Figure 4. Generally, a winter layer has a low ECM current and includes an ice-crust layer (CR-1) in the visual stratigraphy; on the other hand, high ECM currents often appear not merely in summer layers but also in spring or autumn layers due to oceanic acidity, so that high ECM current is sometimes detected twice or more in an annual layer. An annual boundary, determined by ECM current with visual stratigraphy, is identified at the transition boundary between low ECM current and high current as indicated in Figure 4.
Figure 6 shows the dating of the entire H72 ice core obtained by ECMcurrents. the H72 core is dated as AD 1831 by the ECM age at 73.16 m depth. the ECM age agrees with the snow-stake record back to AD 1972 (from the surface to 15 m depth). Furthermore, we compared the ECM age with some time-marker volcanic events to evaluate the ECM age error below 23 m depth. As described in section 3.2, 16 volcanic signals are inferred by ECM current and chemical composition. the ECM age error was estimated by comparing with nine time-marker volcanic events labeled ``e, f, g, i, j, l, m, n, p’’, of which the reliability is 1or 2 and the probable source volcanoes of which are listed in Table1. We found that the ECM age indicates the time difference by 0–3 years with the volcanic eruptions in the probable volcanic signals. the acid fallout travel time from the NH to the Antarctic is 2– 3 years (Reference Jouzel, L., Pourchet and LoriusJouzel and others, 1979), and 0–2 years from the Equator to the Antarctic, so the maximum ECM age error is probably 1–3 years at 73.285 m depth.
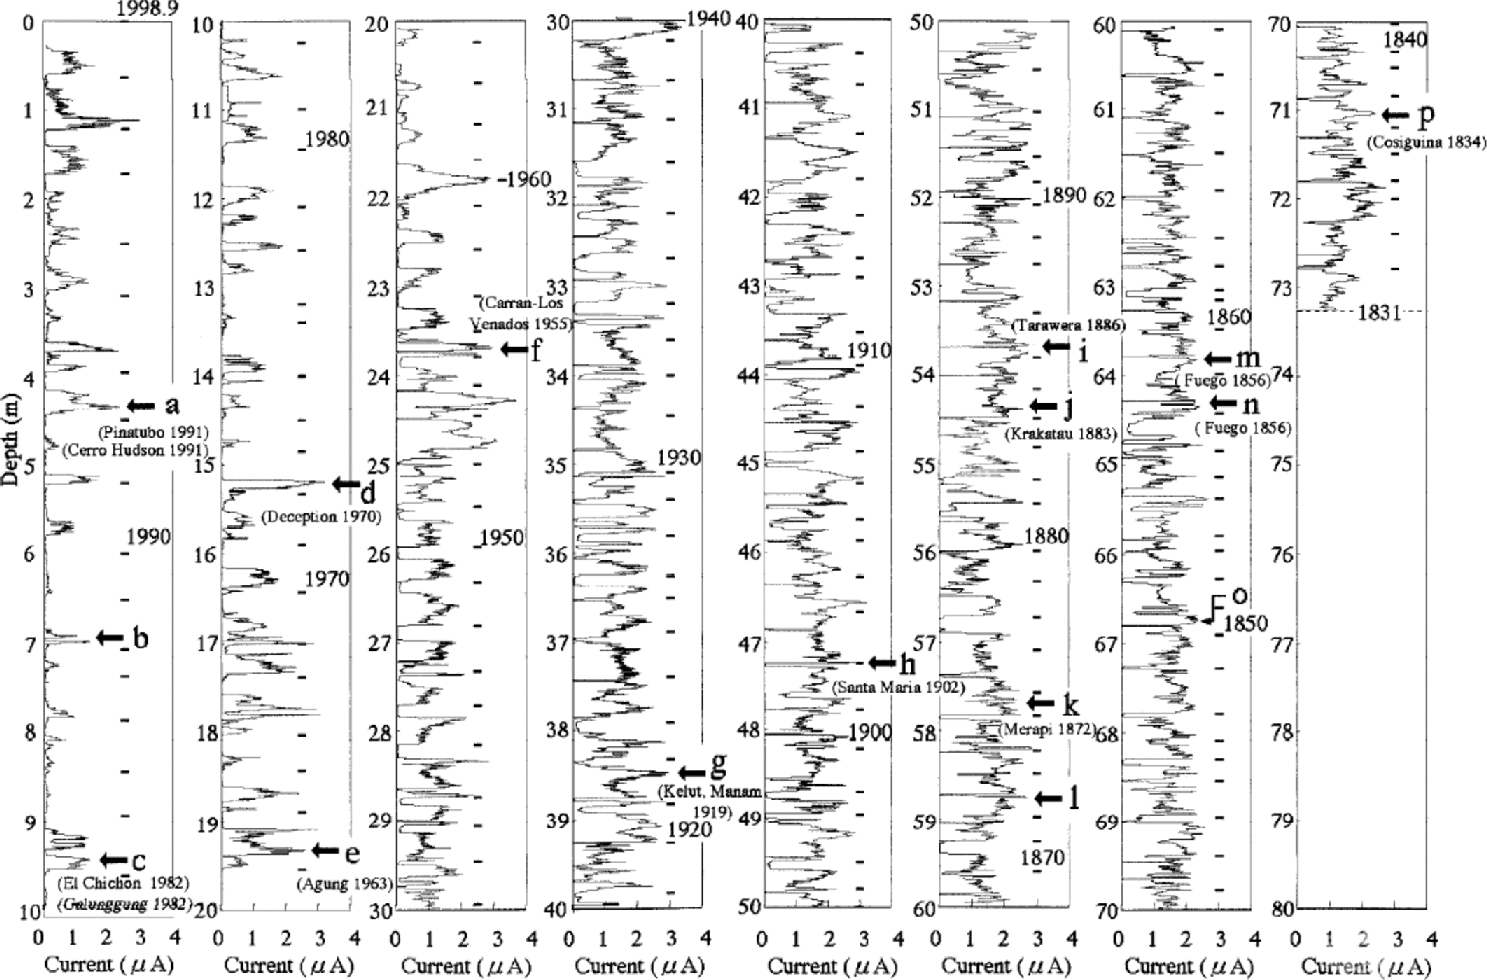
Fig. 6 Profiles of ECM current of the entireH72 ice core.The solid line indicates the annual boundary detected by ECM current with visual stratigraphy.The ECM age was dated as AD1831at 73.16 m depth.
4. Results and Discussion
4.1. Time series of surface mass balance
Using the annual-layer boundaries described in section 3, we can determine the surface mass-balance variation over the past 167 years. Figure 7 shows the time series of annual and 10 year averaged surface mass balance. the time series of the yearly surface mass balance at H72 shows a slight increase, with 19 mm (100 years)–1 w.e. over the last 167 years, but on the basis of t-distribution analysis this trend is not significant. Average surface mass balance is 311 mma–1 w.e. for AD 1831– 1998, which is in good agreement with the annual accumulation of 317 mma–1 w.e. obtained by the empirical densification method described in section 3.1, and the value of 307 mma–1w.e. obtained by snow-stake data for AD1973–98.
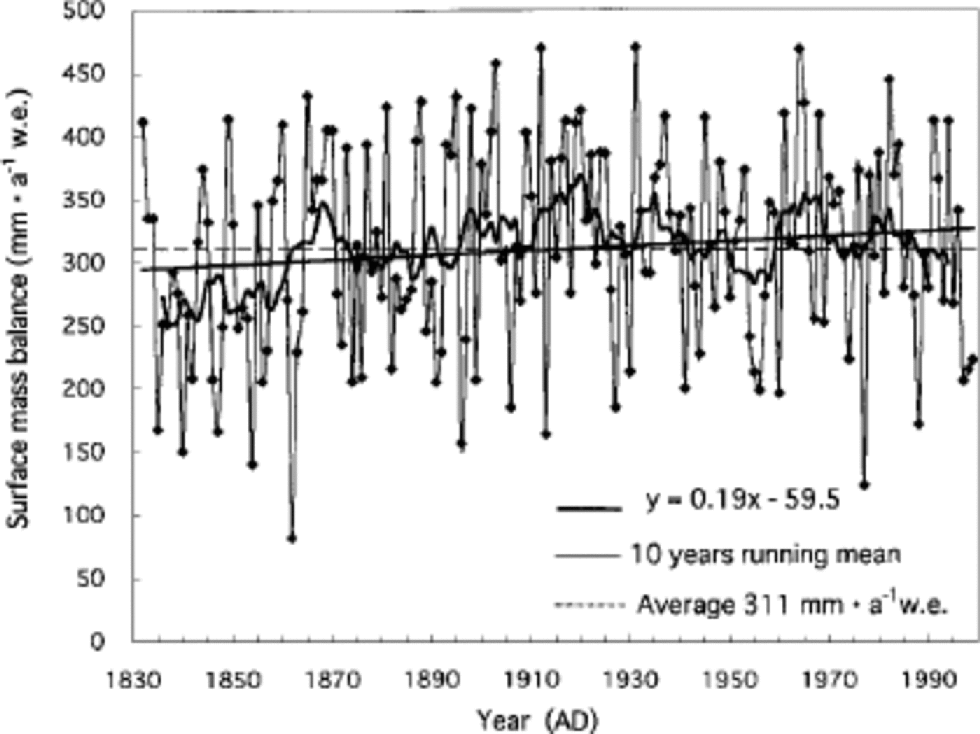
Fig. 7 Surface mass balance in water equivalent at H72, AD 1831–1998. Average surface mass balance is 311 mm a–1w.e. Although the surface mass balance is scattered during the 167 years, the average surface mass balance is almost constant within the 95% confidence limit.
4.2. Characteristics of isotopes and chemical condition for the last 167 years
Figure 8 shows the oxygen isotope ratio (δ18O), nssSO4 2–, pH, MSA and NO3 –. These values were continuously measured from surface to bottom at an average interval of 16.3 cm; a total of 450 samples were measured. Analytical methods are described in detail in Reference NishioNishio and others (2001). In Figure 8, the ages are ECM ages described in section 3; the thin line in the δ18O profile shows raw data, and the thick line indicates the nine-point running mean of raw data. the vertical solid line indicates the average value as –25.5‰. for the oxygen isotope record, a significant trend to lower values, with a negative gradient of 1.7‰ (100 years)–1, can be seen in the H72 ice-core record. More detailed oxygen isotope records show a gradual increase from AD 1840 to 1880, and afterward a gradual decrease to about AD 1900; subsequently, during the 20th century, the isotope record seems to oscillate at an interval of about 20 years. According to previous studies, δ18O in an ice core is related to the temperature (Reference Johnsen, Dansgaard and WhiteJohnsen and others, 1989), sea-ice extent (Reference KatoKato, 1978; Reference Bromwich and WeaverBromwich and Weaver, 1983) and the seasonal variation of snow accumulation (Reference Steig, Grootes and StuiverSteig and others, 1994).
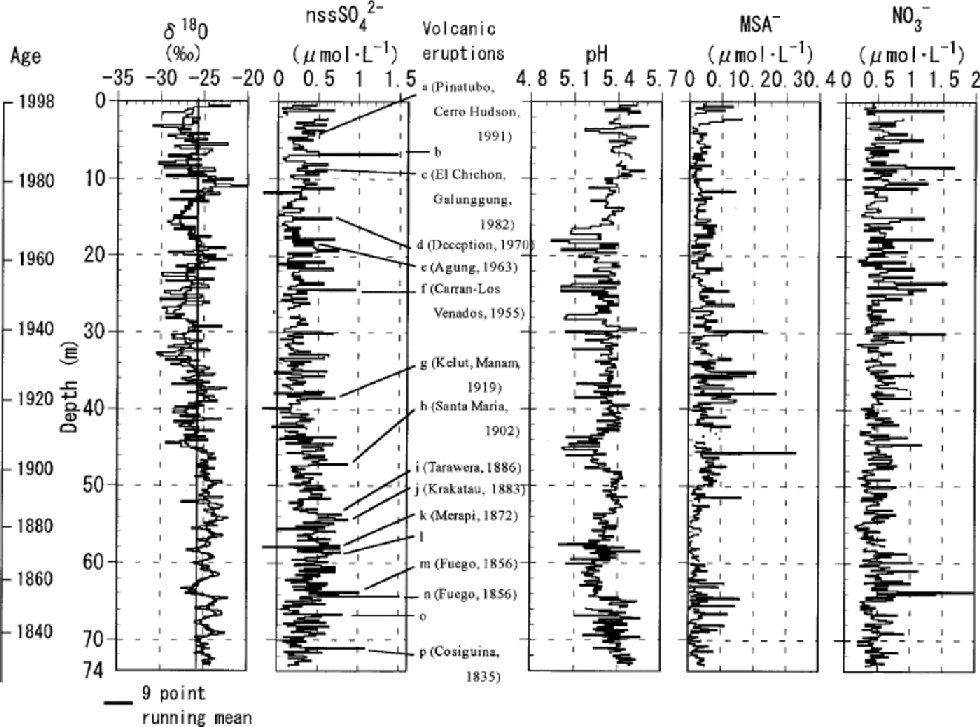
Fig. 8 Profiles of δ18O, chemical constituents (nssSO4 2–,MSA and NO3 –) and pH. Age is due to ECM age. Thick lines in the δ18O profile show nine-point running means. Possible volcanic eruptions that could give high nssSO4 2– peaks (>0.76 μmol L–1) are given to the right of the nssSO4 2–profile.
The concentration of nssSO4 2– shows similar variations to δ18O for AD 1840–1900 and gradually increases from AD 1900 to the present. Some spike-like peaks higher than 2σ (>0.76 μmolL–1) are identified as volcanic eruptions, and the probable source volcanoes are shown in Figure 8. MSA is an atmospheric oxidation product of dimethylsulfide (DMS), which is produced by biological sources in the ocean (Reference Savoie, Prospero, Larsen and Saltzman.Savoie and others, 1992). Fluctuation of MSA is small for all depths, except for some spikes. It appears that the chemical constituents of snow are influenced by the ocean when these anomalous peaks are observed. In previous studies (Fisher and others, 1998), NO3 – has been found to derive from the oxidation of NO and related species that are produced by anthropogenic combustion sources and natural sources, principally soil emissions, lightning and stratospheric processes (Reference Savoie, Prospero, Larsen and Saltzman.Savoie and others, 1992). In the Arctic region, NO3 – concentration increases from about AD 1900 with increased consumption of fossil fuel. Although a number of spike peaks of NO3 – are observed in the H72 core, the basic concentration of NO3 – is almost constant. the pH value has increased over the last 30 years. Therefore, we consider that the NO3 – in the spike-like peaks originates from natural sources, and not from anthropogenic combustion sources.
Acknowledgements
The authors are indebted to the ice-coring team of JARE-39 for their efforts to obtain the ice core at H72. the following persons are acknowledged for their work in the cold room for H72 ice-core analyses at the National Institute of Polar Research: Y. Iizuka, N. Ishihara, J.Okuyama,M. Shirohada, M. Tagami, K. Watanabe and Li Yuansheng. This research was supported by a Grant-in-Aid for Scientific Research from the Ministry of Education, Science, Sports and Culture, Japan (principal investigator: H. Motoyama, 12680537).


