


Introduction
Most ice caps in the Norwegian, Russian and Canadian Arctic melted completely (or nearly so) during the early-Holocene thermal maximum (Reference Koerner and FisherKoerner and Fisher, 2002). In the Canadian Arctic the larger ice caps retreated but survived, as indicated by the presence of pre-Holocene ice in cores. A cooler climate in the late Holocene led to regrowth of ice caps. As a consequence, Pleistocene ice which would otherwise appear at the margins of the larger Canadian ice caps was buried when equilibrium lines dropped. One exception is Barnes Ice Cap, central Baffin Island (Fig. 1), which, like Penny Ice Cap, came into existence when it separated from the northeastern sector of the Laurentide ice sheet about 600014C years ago. This is borne out by geological evidence (isochrones of deglaciation on Baffin Island; Dyke and Prest, 1987; Reference Dyke and HooperDyke and Hooper, 2001) and by Pleistocene-age ice outcropping along the margin of the ice cap (Reference HookeHooke, 1976; Reference Hooke and ClausenHooke and Clausen, 1982). This ice can be identified by its white, bubble-rich aspect, and on air photographs and Landsat imagery appears nearly continuous around the ice cap. In this way Barnes Ice Cap differs from the Queen Elizabeth Islands (QEI) ice caps which were part of a separate late-Pleistocene ice sheet (Dyke and others, 2001). While some QEI ice caps contain ice of Pleistocene age, this did not originate from the Laurentide ice sheet proper. Recession of Barnes Ice Cap during the late Holocene has left exposed the deep ice layers of Pleistocene age along its margin. At present, it is the only ice cap in the Canadian Arctic that allows sampling of relict Laurentide ice for paleoenvironmental research without deep-coring.

Fig. 1 (a) Location map of Barnes Ice Cap, Canadian Arctic. Locations of other ice-core sites mentioned in the text are also shown. (b) South dome of Barnes Ice Cap, showing location of sampling transect A–E (this work) and boreholes studied by Reference Hooke and HudlestonHooke and Hudleston (1980).
Studies on the Greenland ice sheet have shown how δ18O variations in marginal ice can be correlated with those in deep cores from the center of the ice sheet, thereby allowing marginal ice to be dated (Reference Reeh, Oerter, Miller and PeltierReeh and others,1993, Reference Reeh, Oerter and Thomsen2002). Barnes Ice Cap may also preserve an ice-marginal δ18O record that can be correlated with cores. InJune 2000, we made a reconnaissance expedition to the ice cap to collect surface samples in order to establish a preliminary isotopic (δ18O, δD) chronology and evaluate the paleoenvironmental record.
Site Description
The study site (69˚39’N,72˚39’ W) is located along the south-western margin of Barnes Ice Cap’s South Dome (Fig. 1). It was selected for ease of access, lack of crevasses and its wide exposure of white ice, as determined from air photographs. the slope of the ice margin here averages 12˚, and ice layers dip up-glacier at 21–29˚. the lowermost ~50m of the ice-margin zone is littered with rock debris that blends into broad Neoglacial moraines. the white ice is 165–180m wide over ~1km. As observed by Reference HookeHooke (1976), the white ice owes its color to abundant air bubbles. the blue ice (upslope) is comparatively bubble-poor and is thought to have formed as superimposed ice in the early Holocene under conditions as warm as present or warmer (Reference Hooke and ClausenHooke and Clausen,1982). from the dip of foliation, the thickness of the white ice band is estimated to attain 100m (locally), exceeding the 40 m measured by Reference HookeHooke (1976) at another site.
Methods
Air temperature during fieldwork (13–24 July, 2000) varied from –2˚ to 8˚C. Fog, rain or snow were frequent. A total of 555 ice samples were collected on flowline transects extending above and below the white ice. Samples were collected with an ice chisel at 1m intervals from ~20cm below the surface after scraping off any slush or snow. They were melted in sealed polyethylene bags and poured into high-density polyethylene vials with airtight screwcaps whichwere sent to Ottawa and kept frozen until analysis. Samples were measured for stable isotopes of O and H at the University of Ottawa using a Micromass SIRA 12 gas source mass spectrometer with an analytical precision of +0.1‰. Only data for oxygen are reported here. Results are expressed as δ18O relative to Standard Mean Ocean Water.
Oxygen Isotope Stratigraphy
A preliminary δ18O profile across the southwestern margin of Barnes Ice Cap is presented in Figure 2. While some details are yet unresolved, results clearly show that the white ice is consistently isotopically ``colder’’ (i.e. more negative δ18O values) than the blue ice (upslope) or grayish white ice (downslope). the median δ18O in the white ice is –33.1‰, compared with –22.7‰ in blue ice and –24.7‰ in grayish white ice. Our findings therefore support Reference Hooke and ClausenHooke and Clausen’s (1982) contention that the Pleistocene-age ice is laterally continuous around the Barnes Ice Cap margin. Sampling of the grayish white ice was hindered by meltwater near the margin, so the transect only extended ~20m down-slope from the white ice. However, our data reveal that the contact between the grayish white ice (downslope) and the white ice (upslope) is marked by a transition, over a distance of ~5 m, from warmer (–24.2‰) to colder (–33.5‰) δ18O values (Fig. 2). Reference Hooke and ClausenHooke and Clausen (1982) suggested that the relatively ``warm’’ δ18O signature of the grayish white ice may be either primary, reflecting a warmer climatic interval that preceded the formation of the isotopically ``cold’’ white ice, or secondary, reflecting an isotopic enrichment due to regelation at the ice–bedrock interface. They also pointed out that the bubble content of the grayish white ice appears too great for it to have formed as superimposed ice during the warmer, preglacial climate.
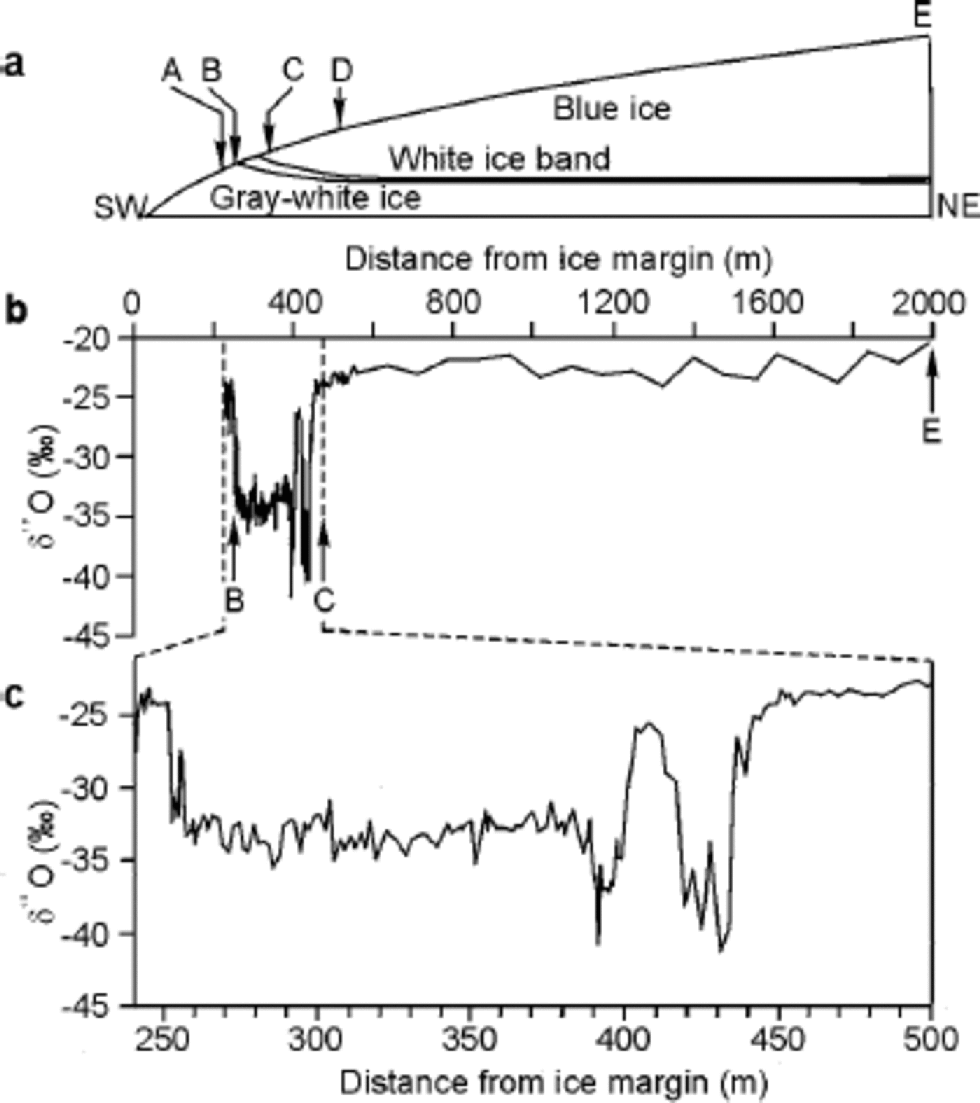
Fig. 2 (a) Schematic southwest–northeast cross-section through the margin of Barnes Ice Cap. A–E are control points on sampling transect. Sampling interval from A to D is 1m, and from D to E is 25m. (b) δ 180 profile along transect A–E. Segment B–C is enlarged in (c).
We have insufficient data to unequivocally resolve how the grayish white ice formed. However, we can gain insights into the early history of Barnes Ice Cap by comparing the preliminary δ18O profile with profiles from ice cores (Fig. 3). the Barnes Ice Cap δ18O profile shows a close resemblance to that from Penny Ice Cap, the only other ice cap to preserve relict Wisconsinan ice from the Laurentide ice sheet (Reference FisherFisher and others, 1998). There is also good agreement between the δ18O profiles from Barnes and Agassiz Ice Caps, although these ice caps were linked to separate ice sheets during the last glaciation (Dyke and others, 2001). At present, noreliable pre-Holocene chronology exists for Canadian Arctic cores owing to the considerable attenuation of Pleistocene ice in them (typically <10m thick). However, comparisons between properties (δ18O, ice texture, impurity content) of deep ice layers in Canadian and Greenland cores suggest that the larger QEI ice caps (Devon, Agassiz) probably began their existence late in the Last Interglacial (Sangamon) or in the Wisconsin glaciation (Reference Koerner and FisherKoerner and Fisher, 1979, Reference Koerner and Fisher2002). Likewise, Barnes and Penny Ice Caps may have formed during the initial growth phase of the Laurentide ice sheet in the late Sangamonian. This hypothesis could account for the relatively high δ18O values (averaging –24‰) found in the deepest layers of all these ice caps (Reference Koerner and FisherKoerner and Fisher, 1979). If so, the relatively bubble-rich, yet isotopically ``warm’’, grayish white ice found at the margin of Barnes Ice Cap could have formed during early glacial time when regional temperatures had not yet dropped to full glacial levels, but the climate had cooled sufficiently to allow for ice accumulation through dry-firn densification.
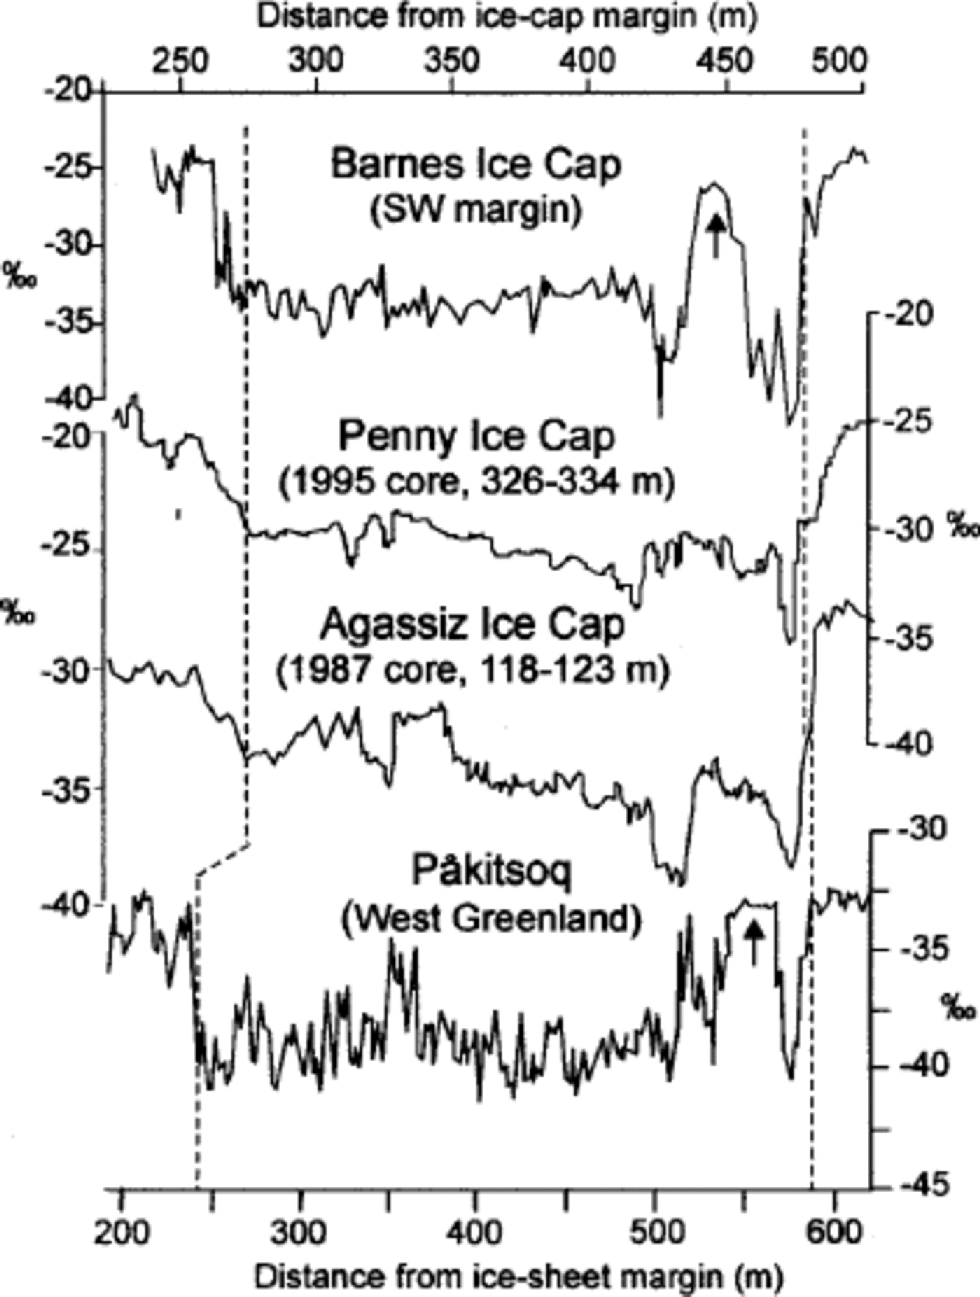
Fig. 3 Comparison of ice-core and ice-marginal δ 180 profiles from the Canadian Arctic and Greenland. Tentative correlations between the profiles are shown as dashed lines. Arrows point to “anomalous” segments in the Barnes Ice Cap and Pâkitsoq δ 180 profiles (see text). Data for Penny Ice Cap: Reference FisherFisher and others (1998); for Agassiz Ice Cap: Fisher (1988); for Pâkitsoq: Reference Reeh, Oerter, Letréguilly, Miller and HubertenReeh and others (1991).
The dispersed dirt in the grayish white ice, which may indicate regelation at the glacier bed (Reference Hooke and ClausenHooke and Clausen, 1982), could also be explained, in part, by deposition of wind-blown dust during the early stages of the ice cap, when its elevation was low. A similar explanation was proposed to account for dirt pockets in the basal layers of the cold-based Devon Ice Cap (Reference Koerner and FisherKoerner and Fisher, 1979). Alternatively, the grayish white ice may also have formed through tectonic mixing of dirt-bearing basal ice with cleaner englacial ice, as described by Reference Souchez, Lemmens and ChappellazSouchez and others (1995).
Between 428 and 430 m from the margin, the Barnes Ice Cap δ18O profile shows an abrupt shift from –41.7‰ to –26.7‰, a difference of 15‰ over ~2m. the δD profile (not shown here) mirrors the δ18O profile closely. the abrupt δ18O shift at the Wisconsin–Holocene transition is a characteristic feature in long (4104 years) ice-core records from the Northern Hemisphere (e.g. Reference DansgaardDansgaard and others, 1982; Reference JohnsenJohnsen and others, 1992). Curiously, the δ18O step in Barnes Ice Cap does not correspond to the estimated point of contact between the white (bubble-rich) and blue (bubble-poor) ice, but occurs ~40m upslope from it. the most likely explanation for this mismatch is that we misidentified the exact location of the white-ice/blue-ice contact. This contact is clearly visible from a distance, but becomes indistinct up close due to surface irregularities and runoff.
A close-up of the δ18O profile across the white ice reveals a shift to near-Holocene δ18O values (Fig. 2c) amidst the isotopically ``coldest’’ part of the sequence. It is tempting to identify this ``warm’’ interval with the Bølling–Allerod event, and the subsequent peak of ``cold’’ δ18O values with the Younger Dryas. However, in Canadian ice cores the Bølling–Allerod/Younger Dryas oscillation is typically faintly expressed (Fig. 3). the ``warm’’ δ18O interval in the Barnes Ice Cap profile stands out as an anomaly with respect to these records. Similar anomalies occurring at or near the Wisconsin–Holocene transition are seen in ice-marginal δ18O profiles from Greenland (e.g. Pâkitsoq (Fig. 3)). They have been attributed to folding of ice due to the large viscosity difference between layers of Holocene and late-Wisconsin age (Reference Reeh, Oerter, Miller and PeltierReeh and others, 1993). the ``warm– cold’’ oscillation in the Barnes Ice Cap δ18O profile could also reflect the presence of recumbent folds in the ice, as hypothesized by Reference HudlestonHudleston (1976). Clearly, caution must be observed in interpreting details of the Barnes Ice Cap marginal δ18O profile that may be of structural, rather than climatic, origin. Stratigraphic disturbances need not be continuous around the ice-cap margin, however, and a careful site selection may yield an undisturbed δ18O record.
The Barnes Ice Cap δ18O profile shows an unusually large isotopic shift at the late-Wisconsin–Holocene transition (15‰). This shift is greater than in other Canadian Arctic and Greenland cores (8–11‰), except for Penny Ice Cap (about 14‰; Reference FisherFisher and others, 1998). Part of this shift could be accounted for by differences in δ18O of precipitation formed under late-Wisconsin and Holocene climatic conditions. Reference Fisher and AltFisher and Alt (1985) used a multiple-source, global isotope model to investigate changes in the δ18O of precipitation as a function of latitude under Last Glacial Maximum (LGM) and present conditions (Δ18O= δ18OLGM – δ18O PRESENT). If the model-predicted Δ18O–latitude relationship is compared with Δ18O values in Canadian Arctic and Greenland records (Fig. 4), it becomes apparent that the Δ18O in Penny and Barnes Ice Caps exceeds markedly the expected range of values.
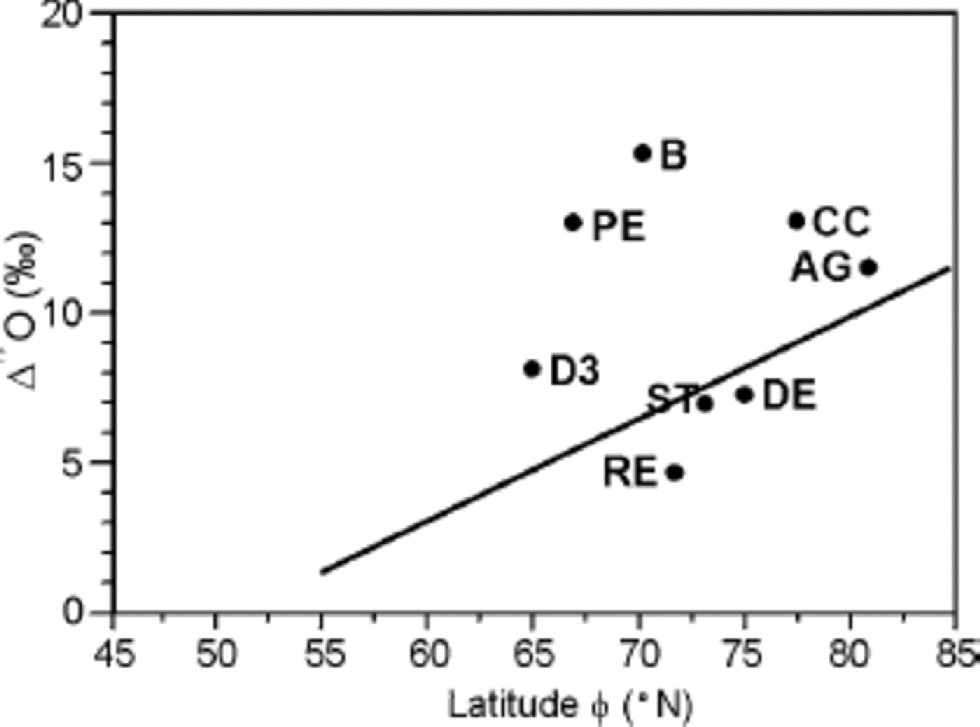
Fig. 4 Variations of Δ 180 (= δ 18OLGM – δ 18O PRESENT) in ice cores from the Canadian Arctic (AG, B, DE) and Greenland as a function of latitude ϕ . AG, Agassiz Ice Cap; B, Barnes Ice Cap; CC, Camp Century; DE, Devon Ice Cap; D3, Dye 3; RE, Renland ice cap; ST, Summit (GRIP). the solid line is the theoretical Δ 180– ϕ relationship for ϕ4 55˚N. Modified from Reference Fisher and AltFisher and Alt (1985).
Reference Hooke and ClausenHooke and Clausen (1982) estimated that 5‰ of the 15‰ Wisconsin–Holocene δ18O shift in Barnes Ice Cap can be accounted for by the paleo-elevation isotope fractionation effect on precipitation that fell in Late-glacial time, when the ice cap was an extension of the Laurentide ice sheet and its surface was considerably higher than at present. We take this inference further by considering the hypothetical topography of the Laurentide ice sheet during the LGM. We use a steady-state reconstruction of the Laurentide ice sheet that assumes non-deformable subglacial sediments in the Hudson Bay region (Reference Fisher, Reeh and LangleyFisher and others, 1985). This reconstruction gives an LGM ice-sheet configuration that agrees well with geologically constrained reconstructions (Dyke and Prest, 1987). Assuming a standard altitude fractionation effect of –0.6‰ per 100 m, the model suggests that late-Wisconsin ice in Penny and Barnes Ice Caps may have originated thousands of km from their modern location, up on a ridge that extended from the ancestral Foxe Dome (≥2400m above present sea level) to the central Keewatin Dome (3200ma.s.l.; Fig. 5). These paleo-elevationestimates are supported by a reappraisal of the Laurentide ice-sheet configuration during the LGM which gives greater and thicker ice cover than previously thought (Reference Dyke and HooperDyke and Hooper, 2001; Dyke and others, 2001). Our extended-flowline hypothesis has the additional merit of providing a plausible interpretation for δ18O and major-ion chemistry records in Penny Ice Cap, which differ markedly from those of QEI ice caps (Reference FisherFisher and others, 2002).
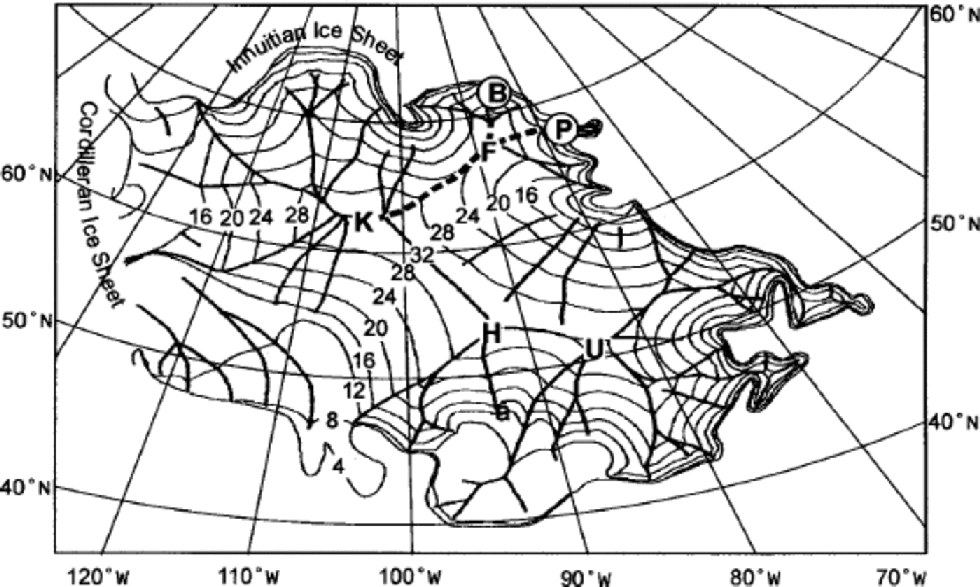
Fig. 5 Steady-state model reconstruction of the Laurentide ice sheet for the LGM, showing topography (contour lines in hundreds of metres) and major ice flowlines (bolder lines). Ice centres: F, Foxe; K, Keewatin; H, Hudson; U, Ungava.Modern location of Barnes (B) and Penny (P) Ice Caps is shown. After Reference Fisher, Reeh and LangleyFisher and others (1985, fig. 2).
Conclusions and Future Work
Marginal strata on Barnes Ice Cap preserve a paleoenvironmental record that may extend into early-Wisconsin or Sangamonian time.The oldest ice in Barnes Ice Cap is speculated to have formed during initial build-up of the Laurentide ice sheet. the Barnes ice-marginal δ18O profile is strikingly similar to that from Penny Ice Cap, which supports a common origin in the northeastern sector of the Laurentide ice sheet. the unusually large Wisconsin–Holocene δ18O shift (15‰) suggests a high-elevation point source for Late-glacial ice in Barnes Ice Cap, possibly on the Foxe–Keewatin sector of the Laurentide ice sheet. This extended-flowlinehypothesis also provides the basis for a plausible interpretation of δ18O and major-ion records from Penny Ice Cap.
Some features of the Barnes δ18O profile suggest stratigraphic disturbances in the record, probably due to folding of ice layers. More exhaustive sampling along the ice margin is needed to confirm our preliminary findings and establish a robust chronology for the δ18O record. Future work should include measurements of other parameters such as trace gases (CO2, CH4) or radionuclides (e.g. 10Be, 36Cl) that can be used to constrain the age of ice strata through correlation with Greenland ice-core records.
Acknowledgements
Fieldwork was supported by the Geological Survey of Canada (GSC) Central Baffin Project, the Canada–Nunavut Geoscience Office and the Polar Continental Shelf Project. We thank R. LeB. Hooke, A. S. Dyke and two anonymous reviewers for helpful criticism. This paper is a contribution of the GSC.


