Introduction
Wet, dry and fog deposition are the mechanisms by which particles and gases are removed from the atmosphere (e.g. Reference Davidson, Bergin, Kuhns, Wolff and BalesDavidson and others, 1996). If the deposition takes place on the cold ice sheets of Antarctica and Greenland, the chemical constituents are embedded in the glacial ice when more snow accumulates on top of the previous layer, and records of deposition over time are preserved. Many deposition records have been extracted from polar ice sheets and have contributed much to our present understanding of changes in atmospheric composition in the past (e.g. Reference Barnola, Raynaud, Korotkevich and LoriusBarnola and others, 1987; Reference Legrand, Lorius, Barkov and PetrovLegrand and others, 1988; Reference HanssonHansson, 1994; Reference SteffensenSteffensen, 1997; Reference Fuhrer, Wolff and Johnsen.Fuhrer and others, 1999). However, interpretation of ice-core deposition records spanning large climatic changes requires understanding of the various parameters within the air–snow transfer functions. the dry-deposition velocity is one of these parameters and it is dependent on local meteorological conditions and thereby also affected by climate changes. the dry-deposition velocity is strongly size-dependent (Reference Davidson, Bergin, Kuhns, Wolff and BalesDavidson and others, 1996), with a clear minimum for particles about 0.1 μm in diameter (i.e. accumulation mode). Larger particles have higher dry-deposition velocities due to sedimentation and impaction processes, and so have the smaller particles due to Brownian diffusion. Particles with higher dry-deposition velocity will therefore be over-represented in the deposition records in the ice compared to the atmospheric concentrations (Reference Unnerstad and HanssonUnnerstad and Hansson, 2001).
Previously reported data on dry-deposition velocities over snow surfaces are sparse and highly varying between different species (e.g. Reference Ibrahim, Barrie and Fanaki.Ibrahim and others, 1983; Reference Cadle, Dasch and Mulawa.Cadle and others, 1985; Reference Davidson, Santhanam, Fortmann and Olson.Davidson and others, 1985; Reference Hillamo, Kerminen, Maenhaut, Jaffrezo, Balachandran and Davidson.Hillamo and others, 1993; Reference BerginBergin and others 1995). Impurities in ice cores are usually measured in the soluble phase (as ion concentrations) or in the insoluble phase (as elemental concentrations, or as total dust mass or number concentrations). These two fractions are combined in the atmosphere, either internally or externally mixed, but most probably interacting and determining the aerosol particle-size distribution together.
The aim of this study was to characterize dry deposition of aerosol particles to surfaces in Antarctica in relation to surface roughness, turbulent flow, boundary-layer structure and the aerosol number and size distribution. An eddy-covariance (EC) method was used which offered away to measure the turbulent transport (vertical flux) of a compound by correlating the fast fluctuations of its number concentrations with the vertical wind speed. This method has previously been successfully applied with a similar instrumentation in the Arctic over sea and pack ice (Reference Nilsson and RannikNilsson and Rannik, 2001) and over a Scots pine forest in southern Finland (Reference Buzorius, Rannik, Mäkelä, Vesala and KulmalaBuzorius and others, 1998, Reference Buzorius, Rannik, Mäkelä, Keronen, Vesala and Kulmala2000).
Measurements and Methods
Sites
The Swedish station Wasa and the Finnish station Aboa in Dronning Maud Land (DML), Antarctica, are situated on the nunatak Basen (73˚03’ S, 13˚25’ W). Basen lies in the northeastern part of Vestfjella, which is a 135 km long range of nunataks. the mountain range is almost parallel to the coast and located about 120 km from the coast. Basen reaches 584ma.s.l.
The EC measurements inJanuary 2000 were made at two different sites, LillaVardet and Aerosol Hill, over periods of 4 and 19 days, respectively. LillaVardet is situated 1km east of the research stations, and the measurements were performed over a smooth snow surface that had a considerable fetch over snow in the main wind direction (i.e. east-northeast). the footprint of the EC system consisted entirely of a snow-covered area. Aerosol Hill is located a few hundred metres east-northeast of the research stations, and the ground on which the EC system was standing consists mainly of rocks in the 5–20 cm diameter range. the footprint of the EC system at Aerosol Hill was dominated by a rocky surface interrupted by snow patches.
The EC flux system
A Gill Solent 1012R research model ultrasonic anemometer was mounted at 5.25 m above the ground on a mast. A TSI 3010 Condensation Particle Counter (CPC) was located in an isolated aluminium box at the foot of the mast, with its sampling intake located just below the sensing heads of the ultrasonic anemometer. the box also contained a heating system together with a computer and an interface to the ultrasonic anemometer. the sampling flow rate was 1 L min–1 through a 7.8 m heated stainless-steel sampling tube with an inner diameter of 4 mm.
The anemometer measured the vertical wind component (w) together with temperature (T) and the horizontal wind components (u and v) at 20.8 Hz. the CPC measured the number concentration (N) of aerosol particles with a dry diameter (Dp) larger than 10 nm. the maximum concentration that this device could measure was 10 000 particles cm–3.
EC flux calculations
The fast measurements by the system allow us to separate N and w into mean values hNi and hwi (resulting from the mean flow defined by a 120 s running average) and turbulent fluctuations ![]() and
and![]()
The aerosol flux as well as momentum and turbulent sensible-heat fluxes were calculated following Reference Buzorius, Rannik, Mäkelä, Vesala and KulmalaBuzorius and others (1998) and Reference Nilsson and RannikNilsson and Rannik (2001). A three-dimensional co-ordination of wind vector to the local streamlines was performed according to Reference Kaimal and Finnigan.Kaimal and Finnigan (1994). the turbulent vertical aerosol number flux (F) is given by
where the covariance ![]() was calculated over 30 min periods from the turbulent fluctuations
was calculated over 30 min periods from the turbulent fluctuations ![]() and
and ![]() By convention, a positive value for F implies an upward flux. the aerosol deposition velocity (vd) was calculated from the measured flux normalized by the mean aerosol number concentration at a certain reference height:
By convention, a positive value for F implies an upward flux. the aerosol deposition velocity (vd) was calculated from the measured flux normalized by the mean aerosol number concentration at a certain reference height:
A positive deposition velocity is defined as being downwards. the response time of the CPC was of the order of 1Hz. the peak contribution to the aerosol flux will be at frequencies of 0.1 Hz or lower. the underestimation of particle-number flux due to the limited frequency response of the CPC was corrected for according to Reference MooreMoore (1986). the correction factor was typically <10%, since eddies at frequencies >1Hz are responsible for a relatively small part of the flux.
Themomentum flux and friction velocity (u*) were calculated from u, v and w, while the turbulent sensible-heat flux (H) was calculated from w and T. Th. Monin–Obukhov length (L) was subsequently calculated from u* and H. Th. surface roughness height (z0) was solved numerically from:

where κ is von Kármán’s constant (κ =0.4), (U) is the averaged wind speed, z is the height of measurement, ϕ = (1 – 15z/L)1/4 and ϕ0 = (1 – 15z0/L)1/4.
Differential-mobility particle sizer
A differential-mobility particle sizer (DMPS) system at Aerosol Hill was continuously monitoring the aerosol particle-size distribution from 3 to 850 nm in diameter during the period 5–20 January 2000. the measured aerosol particle-number concentrations (for Dp >10 nm) from the DMPS system agrees well with the CPC data from the EC measurements. We have utilized the DMPS data to separate the EC measurement data from Aerosol Hill into groups dominated by one of three particle-size modes − ultrafine, Aitken, or Aitken plus accumulation mode−and have thereby been able to identify dry-deposition velocities for the different particle-size modes. the results from the DMPS measurements will be reported extensively elsewhere (paper in preparation by I.K.Koponen).
Dry-deposition velocity
The dry-deposition velocity can also be expressed in terms of resistances (e.g. Reference Seinfeld and Pandis.Seinfeld and Pandis, 1998):
where ra is the aerodynamic resistance, rb is the resistance in the quasi-laminar sub-layer and vs is the settling velocity due to gravitation (e.g. Reference HindsHinds, 1982).
The aerodynamic resistance is a function of u*, z0, z and stability (z/L). It can be expressed as (e.g. Reference Seinfeld and Pandis.Seinfeld and Pandis, 1998):
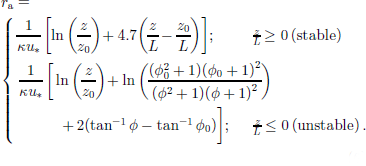
The sub-layer resistance rb is a function of Dp, z0, u*, the diffusion coefficient (D) and kinematic viscosity (ν). This resistance increases with increasing surface roughness and decreasing diffusivity of the aerosol. for fine particles, the influence of Brownian diffusion increases, and rb decreases with decreasing particle size. Reference Schack, Pratsinis and Friedlander.Schack and others (1985) give an expression for rb for neutral conditions and a completely rough surface:
A and B are empirical constants of proportionality and depend on the shape of the elements composing the collecting surface. the right side of the equation is for the diffusion and interception ranges, respectively. the dry-deposition velocity is indirectly dependent on (U), z/L and z0 through the u* dependency of Equation (4).
Results and Discussion
Snow-covered area at Lilla Vardet
The EC measurements at Lilla Vardet were performed during 4 days at the beginning ofJanuary, andthemeasured and calculated variables are shown in Table 1. Both downward and upward particle fluxes were registered, but the downward flux was one order of magnitude larger on average. Ninety per cent of the aerosol particle-number concentrations were found in the range 307–444 particles cm–3. the stratification of the surface boundary layer was near neutral most of the time, as indicated by a median for z/L of –0.005. Ninety per cent of the dry-deposition velocities ranged from 0.08 to 1.89 cm s–1, with a median of 0.33 cm s–1, for all particle sizes (Dp >10 nm).
Table 1. Measured and calculated variables at Lilla Vardet, given as arithmetic mean plus or minus 1σ, the median, the range where 90% of the data are found and the number of data points (0.5 hour averages)

Snow-free area at Aerosol Hill
The EC measurements at Aerosol Hill were performed over a 19 day period later inJanuary, andthemeasured and calculated variables are shown in Table 2. At Aerosol Hill the downward and upward particle fluxes were of the same order of magnitude, with a small net flux downwards. A frequency analysis showed that two-thirds of the measured particle fluxes were negative, which also indicates that deposition dominated. the positive fluxes, i.e. upward fluxes, may be explained as resuspension of particles from the ground. However, it should be noted that upward fluxes were also measured over the snow surface at LillaVardet. Particle-number concentrations at Aerosol Hill were found in the range 270–750 particles cm–3.The low albedo of the nunatak on which the EC system stood favours unstable conditions in the surface boundary layer. This is indicated by the negative values for z/L in 90% of cases. An explanation for this is the relatively large net radiation, which at noon peaked at approximately 90Wm–2. the average wind speed for the different measuring periods was higher at Aerosol Hill than at Lilla Vardet, and reached >10ms–1 during 8% of the measuring period. Ninety per cent of the dry-deposition velocities ranged from 0.2 to 2.4 cm s–1, with a median of 0.80 cm s–1, for all particle sizes (Dp >10 nm).
Table 2. Measured and calculated variables at Aerosol Hill, given as arithmetic mean plus or minus 1σ, the median, the range where 90% of the data are found and the number of data points (0.5 hour averages)

Diurnal cycles
Figure 1 shows 0.5 hour averages in meteorological variables from the period of measurement at Aerosol Hill. the turbulent sensible-heat flux (Fig. 1a) had a diurnal cycle that peaked at noon when the solar zenith angle was at minimum, with an average H maximum of 260 Wm–2.The temperature cycle (Fig. 1b) lagged the H cycle by about 2 hours, and the average diurnal temperature variation ranged from –6.6˚ to –3.7˚C. During the morning hours, the surface boundary layer was close to neutrally stratified, but an unstable boundary layer was formed during the day due to the radiative warming at the surface (Fig. 1c). When the wind speed increased during the day (Fig. 1d) and the stability diminished, the friction velocity increased (Fig. 1e). the particle concentration increased rapidly during the morning hours and culminated at noon (Fig.1f). A similar but more scattered trend was seen in the downward aerosol particle flux (Fig.1g).
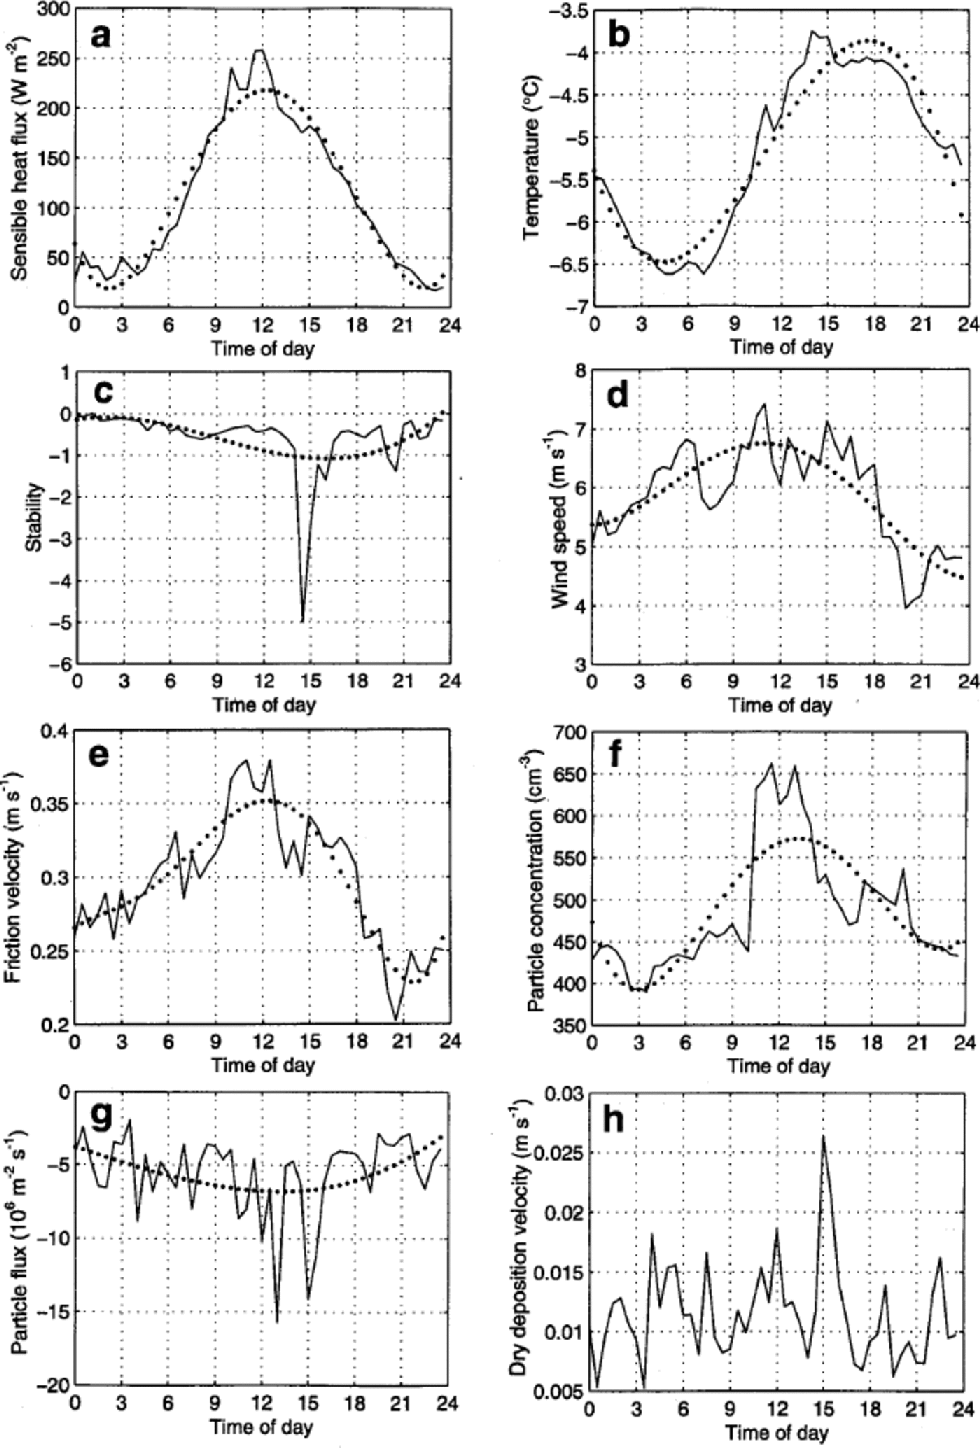
Fig. 1 Averaged diurnal cycles at Aerosol Hill of (a) turbulent sensible-heat flux (H), (b) temperature (T), (c) surface boundary-layer stability (z/L), (d) wind speed (U), (e) friction velocity (u*), (f) particle-number concentration (N), (g) particle flux (F) and (h) dry-deposition velocity (vd). Full lines connect 0.5 hour averages, and dotted lines are polynomials fitted to the diurnal averages.
Hence, we can see a clear diurnal cycle in the surface boundary-layer stability, temperature and fluxes. This is not due to the contrast between night and day, since we had sunlight 24 hours d–1. Instead, the driving force must be the diurnal cycle in the solar zenith angle, which is still rather large at 73˚ S. This agrees with the measurements by Reference Nilsson and RannikNilsson and Rannik (2001) over the pack ice of the Arctic Ocean, although the diurnal amplitudes were smaller in their case due to the higher latitude (>80˚N). the dry-deposition velocity, or normalized flux, had no significant trend (Fig. 1h). Since most of the large downward fluxes occurred simultaneously with high values of aerosol particle concentrations, the value of the normalized flux remains practically the same when data points are compared.
Because the measurements over the snowfield at Lilla Vardet lasted only a few days, the average diurnal cycles are much too influenced by the weather conditions on individual days to produce a figure corresponding to Figure 1.However, the data from Lilla Vardet indicate a diurnal behaviour similar to that for Aerosol Hill, with some differences. At Lilla Vardet, H was negative at ``night’’ and positive at noon, with a smaller amplitude of the diurnal cycle. This is in agreement with a more stably stratified surface boundary layer and obviously caused by the higher albedo of the snowfield and the smaller absorption of solar radiation as compared to Aerosol Hill. the downward aerosol fluxes and the dry-deposition velocity over the snowfield were smaller than at Aerosol Hill, except in the afternoons.
Dry-deposition velocities
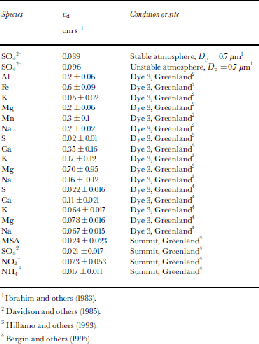
Previously reported dry-deposition velocities show a large variability depending on the atmospheric conditions and characteristics of the deposited species. Examples of dry-deposition velocities for different species to snow surfaces on Greenland are shown in Table 3. None of these studies were made with the EC method. All these previous studies emphasized the dry-deposition velocity for the size range that is most important for mass deposition, rather than number deposition, hence they refer to a larger size range. the dry-deposition velocities in this study are generally higher than the values in Table 3, especially the ones measured over the snow-free surface at Aerosol Hill. However, an order-of-magnitude difference is found in the reported values for K, Mg and Na from Dye 3, hence the absolute value of the dry-deposition velocity can vary strongly between different situations.
Table 3. Examples of dry-deposition velocities (+1σ) to snow surfaces
The dry-deposition velocity is dependent on the turbulence intensity, atmospheric stability and particle size (see Equations (5–7)). Unlike Reference Nilsson and RannikNilsson and Rannik (2001), we were unable to identify an increased dry-deposition velocity with increased friction velocity in this dataset. the reason is probably a large scatter in vd due to changes in the aerosol size distribution, but also the variability in z0 and z/L.
The large surface elements on Aerosol Hill gave a median surface roughness height of 0.11 cm, while the median surface roughness height at Lilla Vardet was 0.03 cm. the median dry-deposition velocity was >100% higher over the rougher surface than over the smooth surface at Lilla Vardet. A study by Reference Schack, Pratsinis and Friedlander.Schack and others (1985) consists of a number of wind-tunnel experiments over various surfaces, weighting the diffusion and interception effects with the empirical constants A and B(see Equation (7)). They report a surface that consisted of gravel in the 3.8–5.1cm size range, which resulted in surface roughness heights of 0.3–0.6 cm and deposition velocities ranging from 0.05 to 33 cm s–1. the constants A and B for gravel were according to them 4.0±0.4 and 121±8, respectively.To calculate the quasi-laminar sub-layer resistance rb at Aerosol Hill, the empirical parameters had to be approximately 10 times larger (A = 75, B =1000) to parameterize themedian dry-deposition velocity.
Analysis of the DMPS data showed that there were three distinct particle-size modes in the sub-micron aerosol (Fig. 2). These number modes had a geometric mean diameter of around 14, 42 and 134nm, referred to as ultrafine, Aitken and accumulation-mode, respectively. This agrees approximately with the range found by Reference Covert, Wiedensohler, Aalto, Heintzenberg, McMurry and LeckCovert and others (1996) in the Arctic marine boundary layer. the data from the EC measurements at Aerosol Hill were divided into three different categories based on the aerosol number size distributions:
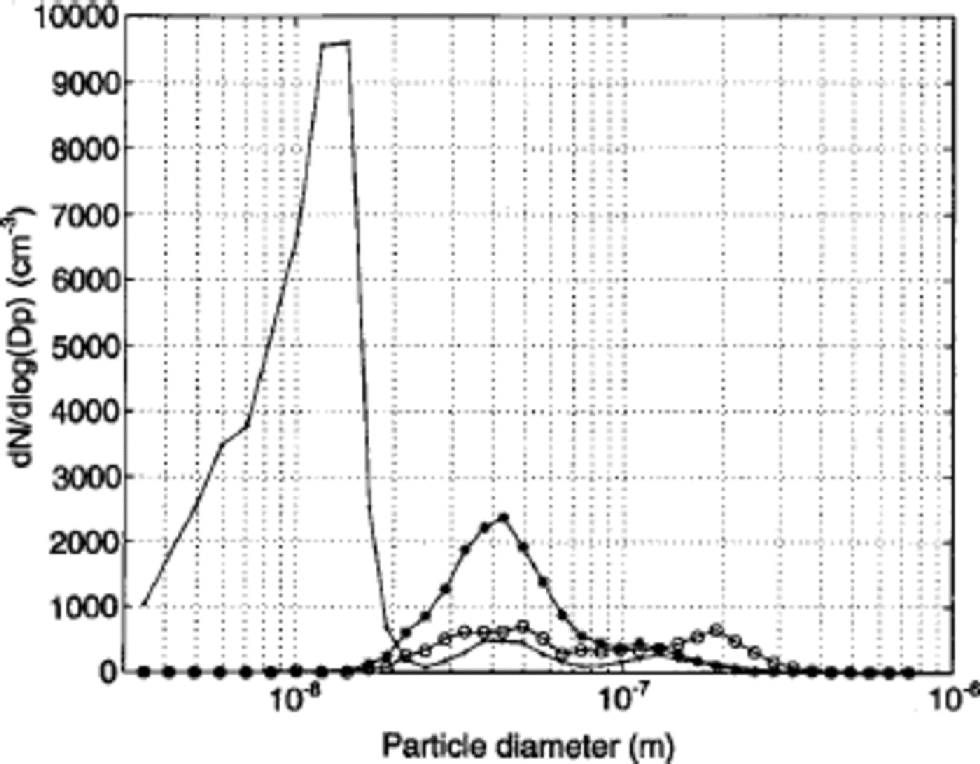
Fig. 2 Three examples of particle-number size distributions, dN/d log(Dp), showing the three categories into which the EC dataset was divided: ultrafine mode (solid line), Aitken mode (solid line with stars) and Aitken plus accumulation mode (solid line with circles).
(a) ultrafine (Dp =10–20 nm) whenever there was an ultrafine mode present
(b)Aitken (Dp =20–90nm) when there was an Aitken mode but no ultrafine or accumulation mode present; and
(c) Aitken plus accumulation (20 nm< Dp <200 nm) when both modes were present at the same time.
There were no cases with only an accumulation mode present. Reference Nilsson and RannikNilsson and Rannik (2001) used a similar approach for the vd over the Arctic Ocean pack ice and also could not separate a specific dry-deposition velocity for only accumulation-mode particles. Since Aitken mode was present most of the time, the third category could not consist of a pure accumulation mode but had to be a combination of both. This was also the case for the ultrafine mode, where an Aitken and an accumulation mode were also present. Since the measured F includes a wide range of particle sizes, it is difficult to relate vd to Dp. the number of Aitken-mode particles may have dominated the category with the accumulation mode, while the number of ultrafine-mode particles probably dominated the category of ultrafine mode.
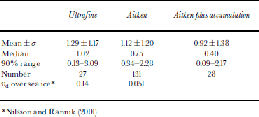
Median dry-deposition velocities to the snow-free surface at Aerosol Hill were 1.02, 0.75 and 0.40 cms–1 for the ultrafine, Aitken and Aitken plus accumulation-mode category, respectively. These are larger than the values given by Reference Nilsson and RannikNilsson and Rannik (2001) over sea ice (Table 4). the measured median dry-deposition velocity of each size category agrees with that calculated from Equations (5–7) with A and B set to 75 and 1000, respectively, through empirical evaluation. Since we have tuned A and B in Equation (7) to fit the observations, the agreement between the magnitude of the measured and calculated vd is not a solid result. However, the dvd/dDp slope is much less influenced by the choice of Aand Bthan is vd. the dvd/dDp slope between the dry-deposition velocities of the ultrafine and Aitken modes as measured (–0.7×105 cm s–1m–1) and given by Equations (5–7) (–1.1×105 cm s–1m–1) agrees well. This is a confirmation from field data that indeed the small ultrafine-mode particles have a higher deposition velocity than the larger Aitken-mode particles, as predicted by theory, owing to a stronger Brownian diffusion.
Table 4. Dry-deposition velocity (cm s–1) at Aerosol Hill for the three size categories ultrafine, Aitken, and Aitken plus accumulation, given as arithmetic mean plus or minus 1s, the median, the range where 90% of the data are found and the number of data points (0.5 hour averages)
Conclusions
The rate at which aerosol particles or gases deposit at the surface is affected by different physical and meteorological conditions, (e.g. surface structure, the level of atmospheric turbulence and physical and chemical properties of the depositing species). the factors that primarily affected dry-deposition velocity during the measurement period in January 2000 in DML were the stratification of the surface boundary layer (z/L), the surface albedo, the surface roughness height (z0) and the aerosol particle size (Dp).
The stratification of the surface boundary layer over the smooth, snow-covered area at LillaVardet with a high albedo was less unstable than over the snow-free, low-albedo, rocky surface at Aerosol Hill. the different conditions at the sites resulted in median dry-deposition velocities, for all particle sizes (Dp >10 nm), >100% larger at Aerosol Hill than at Lilla Vardet: 0.80 and 0.33 cm s–1, respectively. the diurnal variation in solar zenith angle caused diurnal variations in surface boundary-layer stability, temperature and fluxes. the diurnal variations were larger over the snow-free area than over the snowfield. An increase in friction velocity was observed when the stability diminished during the day.
The dry-deposition fluxes were dominated, in terms of number, by the ultrafine and Aitken modes since they were present and numerous most of the time and had larger dry-deposition velocities than the accumulation mode. We were not able to isolate the flux of accumulation-mode or larger particles, and although we expect them to contribute less to the number concentration, their influence on the mass concentration in the ice may be large for some species. Themedian dry-deposition velocities for the three size categories, ultrafine, Aitken, and Aitken plus accumulation mode, to the snow-free surface at Aerosol Hill were 1.02, 0.75 and 0.40 cm s–1, respectively. the dvd/dDp slope between the dry-deposition velocities of the ultrafine andAitkenmodes as measured and calculated agreed well.
To use dry-deposition velocities in the interpretation of ice-core deposition records requires not only an understanding of the local meteorological conditions and their variations with time, but also better knowledge of the particle-size mode in which different species are deposited. This may also have changed between different climatic stages due to a changed matrix of the atmospheric aerosol.
Acknowledgements
This project was carried out as part of the Swedish and Finnish Antarctic Research Programmes (SWEDARP and FINNARP) 1999/2000. We thank the Swedish Polar Research Secretariat and the crews at Wasa and Aboa for logistic support during the field campaign. the Swedish Natural Science Research Council and the Finnish Academy are acknowledged for financial support, and Ü. Rannik for his help with the flux calculations. We would like to thank the Department of Physics at the University of Helsinki for lending us the ultrasonic anemometer, and the Institute of Applied Environmental Research at Stockholm University for lending us the CPC.


