Introduction
The relatively high anthropogenic pollution levels in Svalbard biological life have been documented and discussed during the last few decades (e.g. Reference Bernhoft, Wiig and SkaareBernhoft andothers, 1997). Many organic contaminants, including polycyclic aromatic hydrocarbons (PAHs), show higher concentrations in the Arctic than the global background (Reference NilssonNilsson, 1997). However, because PAHs do not accumulate for long periods of time in living tissues, they have not received as much attention as many other organic pesticides, despite the fact that many PAHs are carcinogenic or mutagenic (e.g. Reference ZedeckZedeck, 1980; Reference BarrieBarrie and others, 1992).
Natural sources of PAHs include biomass burning, volcanoes, natural losses or seeps of petroleum or coal deposits and diagenetic production in soils and sediments (e.g.Reference Wakeham, Schaffner and GigerWakeham and others, 1980; Reference Baek, Field, Goldstone, Kirk and LesterBaek and others, 1991; Reference MacdonaldMacdonald and others, 2000; Reference Masclet, Hoyau, Jaffrezo and CachierMasclet and others, 2000). Many of the PAHs, including naphthalene (NAP), have anthropogenic sources, chief among which are the combustion of organic fuels and materials (Reference Baek, Field, Goldstone, Kirk and LesterBaek and others, 1991). the emission of PAHs from anthropogenic sources has increased dramatically along with the increased combustion of fossil fuels during the past century (Reference Wakeham, Schaffner and GigerWakeham and others, 1980).
PAHs are semi-volatile and can be transported many thousands of kilometers (Reference MacdonaldMacdonald and others, 2000), mainly in the particulate form over long distances in the atmosphere (e.g. Reference Jaffrezo, Clain and MascletJaffrezo and others, 1994; Mascalet and Hoyau, 1994). the residence times of PAHs in atmosphere are variable, ranging from hours to several months (Reference Masclet, Hoyau, Jaffrezo and CachierMasclet and others, 2000), and are strongly dependent on temperature and chemical species. NAP becomes the increasingly predominant PAH in colder, more polar environments due to global fractionation and cold condensation (Reference Wania and MackayWania and Mackay, 1993; personal communication from A. J. Peters, 2000).
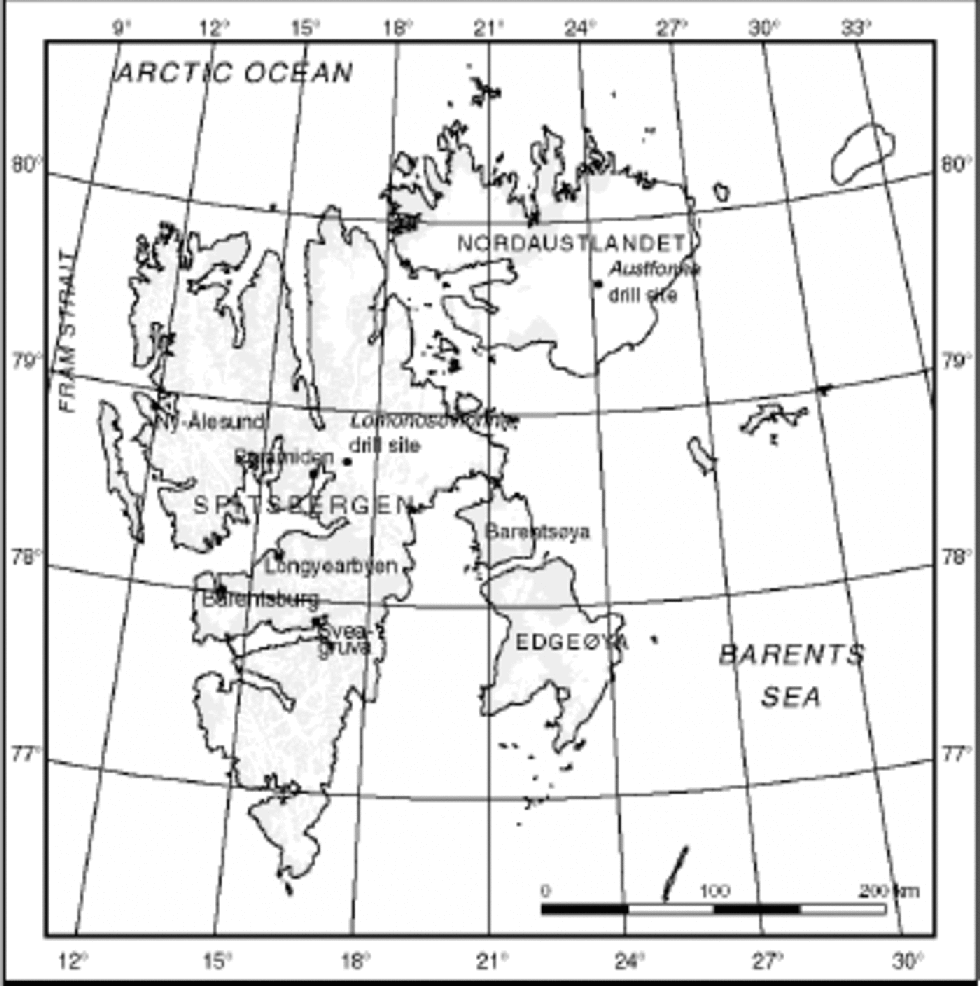
PAHs are continuously measured every week in air samples at Ny Ålesund, Svalbard (Reference Tørseth, Berg, Hanssen and ManøTørseth and others, 1999) (Fig. 1). There is a clear seasonal variation, with the highest concentration during the winter months and early spring, in direct response to the long-range transport of air masses from the Eurasian continent (Arctichaze). NAP and biphenyl contribute to 70% of the measured PAH compounds in Ny Ålesund.

Fig. 1 Map of Svalbard with the geographical names mentioned in the text.
In the Arctic atmosphere, practically all PAHs are adsorbed on particles (Reference Masclet and HoyauMasclet and Hoyou, 1994). In the snowpack, PAHs (including NAP) can be preserved for long periods, especially those adsorbed on particles (Reference Masclet, Hoyau, Jaffrezo and CachierMasclet and others, 2000). Until recently, studies of organic compounds in snow and ice have been limited because of the large samples required. By presenting a 400 year long PAH record from a Greenland ice core, Reference Kawamura, Suzuki, Fujii and WatanabeKawamura and others (1994) showed that it is possible to develop long records of PAH from ice cores. Also, Reference Jaffrezo, Masclet, Clain, Wortham, Beyne and CachierJaffrezo and others (1993, Reference Jaffrezo, Clain and Masclet1994), Reference Masclet and HoyauMasclet and Hoyau (1994) and Reference Masclet, Hoyau, Jaffrezo and CachierMasclet and others (2000) have studied snow and ice from Greenland. More recently (Reference Peters, Gregor, Teixeira, Jones and SpencerPeters and others, 1995; personal communication from A. J. Peters, 2000), a 200 year record in snow from Agassiz Ice Cap, Canada, has been studied. PAH studies of ice from Svalbard have not been presented before, and in this paper we present a record of NAP, spanning the last century from Lomonosovfonna, Svalbard (Fig.1).
Lomonosovfonna is remote from major pollution sources, with the exception of coal mines at Barentsburg, Sveagruva, Pyramiden (the closest, 35 km from the drill site, in operation between 1947 and 1998) and Longyearbyen (the largest settlement, 100 km from the drill site, in operation since 1911) (Fig.1).
Dating of Ice Core and Preservation of the Record
In 1997, a 122 m ice core was retrieved from the summit of Lomonosovfonna, the highest icefield in Spitsbergen (1255ma.s.l.) (Reference IsakssonIsaksson and others, 2001). the time-scale of the core was based on a simple age–depth model based on pure shear (Reference NyeNye, 1963) and tied with the known dates of prominent reference horizons (1963 radioactive layer and 1783 Laki (Iceland) volcanic acid layer). Studies so far indicate that the core contains a reliable record of isotope and chemical concentrations that can be successfully used in climate studies (Reference Jauhiainen, Moore, Perämäki, Derome and DeromeJauhiainen and others, 1999; Reference O’DwyerO’Dwyer and others, 2000; Reference IsakssonIsaksson and others, 2001; Reference PohjolaPohjola and others, 2002).
Analysis of other chemical species suggests that the distribution of NAP at Lomonosovfonna may be slightly altered by meltwater percolation.The degree of redistribution of the different chemical species by meltwater seems to be dependent on their physical chemistry (Reference PohjolaPohjola and others, 2002). Acids are vulnerable to percolation in the snowpack, but it is limited to two or three annual layers and run-off is zero. Sea salts and insoluble dust appear to be less mobile.
Analytical Procedure
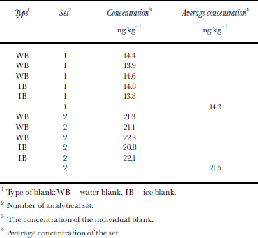
In an initial analysis, 16 commonly analyzed PAHs were measured (cf. Reference Peters, Gregor, Teixeira, Jones and SpencerPeters and others, 1995), but NAP alone was chosen for later work since no other PAHs were detected in the small sample size available (average 55.6 g). Thirty-three ice-core samples at 6.05–104.55m depth and four ice blanks were cleaned by removing the outer 5–20mm of the ice core, packed in polyethylene plastic bags in a cold room under a laminar hood at about –20˚C (Reference Jauhiainen, Moore, Perämäki, Derome and DeromeJauhiainen and others, 1999) and transported to the chemical laboratory in Rovaniemi, Finland, in frozen condition. Ice blanks were prepared from frozen ultra-pure water ``cores’’ that were then processed identically to the real ice cores. Additionally a set of six ultra-pure ``water blanks’’ were prepared in the analytical laboratory for further assessing contamination and instrument detection and determination limits. Ice samples (34–81g) were transferred to ultra-pure glass bottles and melted in a laminar hood at room temperature. An internal standard (ISTD) was added to the melted samples. Samples were extracted twice with 2 mL of hexane using a mechanical stirrer. the hexane fraction was collected and reduced in volume by air blow-down to a final volume of 50 μL to analyze PAHs. Samples were analyzed by high-resolution gas chromatography with mass spectrometry. the injection volume was 2 μL and measured in single-ion-monitoring-mode. PAHs were quantified relative to ISTD and the calibration curve. A recovery study, at somewhat higher concentrations than we find here, found that 94% of NAP was extracted by this method. the detection limit for NAP was 1pg μL–1 of the extract, which resulted in a theoretical-method detection limit of 1ng kg–1 of ice. the instrument detection limit is defined as the concentration of injected analyte that produces a peak with a signal-to-noise ratio (S/N) of 3, and the determination limit as that which produces a S/ Nof 10. However, in the real samples the detection and determination limits were defined as 3 and 10 times (respectively) the standard deviation of both the ice and water blank-sample results. the average of blank samples was also subtracted from the results of NAP, which represents contamination during subsampling, sample preparation and analyses. the average blank value in the first set of samples was 14.3 ng kg–1, and in the second set 21.5 ng kg–1 (Table 1).
Table 1. NAP concentrations in blanks

1 Type of blank: WB = water blank, IB = ice blank.
2 Number of analytical set.
3 the concentration of the individual blank.
4 Average concentration of the set.
Results and Discussion
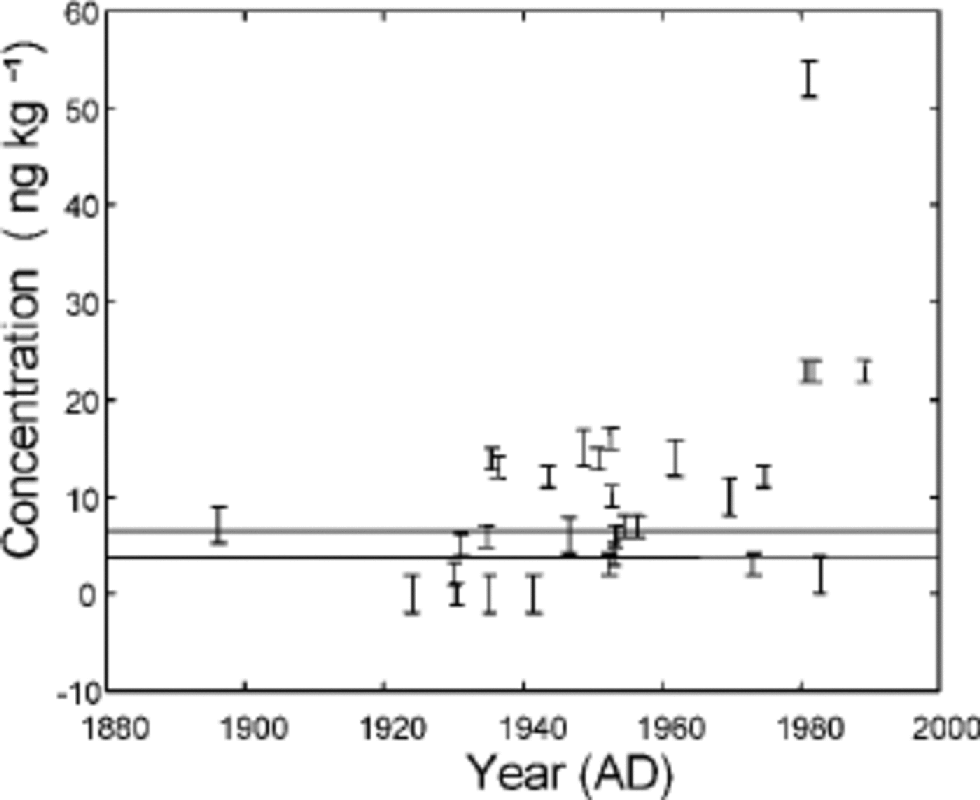
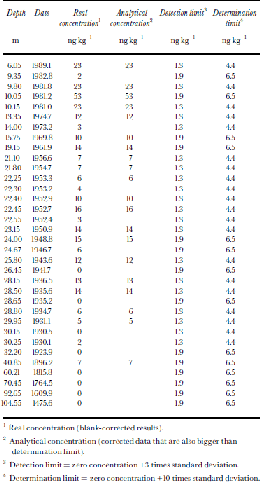
NAP concentrations in the samples were 0–53ng kg–1 (average 10 ng kg–1) over the period of the last century (Table 2; Fig. 2). the NAP data showed very low concentrations up to the mid-1930s, with higher values around 1980. the overall pattern is in general agreement with the increase and then stabilizing of SO2 emissions in Europe and North America (Reference Lefohn, Husar and HusarLefohn and others, 1999) and the aerosol record from Ny Ålesund (Reference Tørseth, Berg, Hanssen and ManøTørseth and others, 1999). However, this general picture is also consistent with the increase during the late 1940s of the population and mining activities in Svalbard (Reference ArlofArlof, 1996).

Fig. 2 NAP concentration along the Lomonosovfonna ice core. the error bars shown are the detection limits from Table 1. the determination limits for the two sets of samples are shown as the two horizontal lines on the plot. Dating is from the Nye time-scale.
Table 2. NAP concentrations in samples

NAP was the most abundant PAH compound in snow and ice cores from the Canadian Arctic (Reference Peters, Gregor, Teixeira, Jones and SpencerPeters and others, 1995), while other PAHs seem to be more common in Greenland (Reference Jaffrezo, Clain and MascletJaffrezo and others, 1994). A. J. Peters (personal communication, 2000) found average values of NAP at Agassiz Ice Cap much higher than in Lomonosovfonna (60 and 10 ng kg–1, respectively), and a very high concentration in the 1960s (up to 640 ng kg–1) which is 12 times the Lomonosovfonna maximum which occurred in the 1980s. However, we have only two samples in the 1960s, so we may not have sampled the peak. Reference Jaffrezo, Clain and MascletJaffrezo and others (1994) reported concentrations in Greenland with much lower levels (max. 0.5 ng kg–1).
Correlation of the results of the NAP analysis with ions, oxygen isotopes and density analyzed in the ice core (Table 3) may provide insight into the origins and post-deposition processes of NAP in the core. for 15 samples we have ion chemistry and density data from samples taken at exactly the same depth as the NAP samples, while for the others we have data from samples from within 5 cm of the NAP samples. the correlation was in general better for the samples taken at the same depths (Table 3) than for the samples where we calculated mean chemistry (based on all samples within 5 cm of the NAP sample). We computed an ion balance−therefore giving the H+ concentration− only for the samples with chemical data for the same depth.
Table 3. Correlation coefficients of NAP and H+ with other core parameters

As expected, there is a significant correlation with depth and consequently age. There are significant correlations between NAP, NH4 +, δ18O, Cl– and H+ at the 99% level. NAP is also correlated at the 95% level with NO3 – and with density (which varies rapidly) for the 15 same-depth samples. Arctic haze is probably responsible for a substantial part of the transport of NAP (Reference Jaffrezo, Clain and MascletJaffrezo and others, 1994), so we expect the best correlations with other Arctic-haze ions. This seems to be the case for NH4 + and to a degree NO3 –.
Most surprisingly, NAP is not correlated with either SO4 2– or the non-sea-salt SO4 2–. There might be several reasons for this, and without high-resolution data on species across several seasonal cycles we are limited to suggesting two possibilities. Sulphate is one of the first ions to migrate when meltwater is introduced (Reference Davies, Vincent and BrimblecombeDavies and others, 1982), and may therefore have been relocated in the snow at Lomonosovfonna (Reference PohjolaPohjola and others, 2002). However, this would also be true of H+ and NO3 –. Another possibility is that NAP and SO4 2– are relocated within the ice in a similar way to the observed migration of MSA and non-sea-salt SO4 2– (Reference Mulvaney, Pasteur, Peel, Saltzman and WhungMulvaney and others, 1992), or NO3 – and non-sea-salt SO4 2– (Reference Röthlisberger, Hutterli, Sommer, Wolff and MulvaneyRöthlisberger and others, 2000).
1 Real concentration (blank-corrected results).
2 Analytical concentration (corrected data that are also bigger than determination limit).
3 Detection limit = zero concentration +3 times standard deviation.
4 Determination limit = zero concentration +10 times standard deviation.
Arctic haze is a wintertime phenomenon, so if the ions are preserved in the snowfall without redistribution, they will be in isotopically lighter winter snow: this is observed with the significant anticorrelation of NAP with δ18O. the observation that H+ is less well correlated with δ18O also suggests that NAP remains more localized in the ice than acids. As Cl– is a sea-salt ion, it peaks during periods of storminess, and a winter peak is to be expected, again supporting the notion of relatively little sea-salt-ion translocation in the core. NAP is also hydrophobic, especially compared with H+ or SO4 2–, and so may be expected to resist movement by percolating meltwater. Although meltwater may percolate 2–3 annual layers, it is clear that most of the meltwater must refreeze within the previous winter layer to preserve the seasonality we observe in both isotopes and ions (Reference IsakssonIsaksson and others, 2001; Reference PohjolaPohjola and others, 2002). the filling of pore space in the spring/winter snow by melting summer snow leads to spring layers having higher density than other layers, giving the correlation of NAP with density. We may also speculate that the changes in ice fabric may prevent percolation via changes in grain-size and capillarity associated with rime layers or depth hoar, leading to a preference for refreezing in the spring layer.
One other possible significant post-deposition effect is revolatilization in the snowpack and loss after deposition (Reference Masclet, Hoyau, Jaffrezo and CachierMasclet and other, 2000). the samples closest to the surface are below ice layers, and the concentrations do not show any large increase near the surface, so this effect cannot be seen in our data.
One difficult problem in interpreting NAP data from Svalbard is the probable existence of local sources of emission associated with coal mining and local organic fuel burning. However, the levels of NAP in Lomonosovfonna compared with values in Agassiz Ice Cap suggest that, for NAP at least, these sources are not significant. This is also consistent with directions of advected air masses across Svalbard (Reference NiedzwiedzNiedzwiedz, 1997). In winter and spring, 63.1% of air masses come from the northeast, east, southeast, north and northwest directions where there are no local sources; only 13.9% of the winter and spring air comes from directions of local sources. Reference Rose, Rose, Boyle and ApplebyRose and others (in press) have studied PAH concentrations in sediments from lakes on the western coast of Spitsbergen (downwind of the sources). They find higher concentrations at the site closest to Longyearbyen (about 15 km away), but no trend with distance in the PAH concentrations at five other sites 60–200 km away from Longyearbyen. This is evidence that local sources play some role on Svalbard, but probably this is more important for high-molecular-weight PAH, in low-altitude lakes that are close to, and downwind of, coal burning, than for NAP at the high-elevation Lomonosovfonna glacier site.
In future we plan to study the flyash record in the ice core, which we hope will provide more insight into source and transport processes of PAHs. More work on several different organic compounds on the same Svalbard glacier is also in progress. Based on our work, we believe that some ice cores from Svalbard are good archives for studying the environmental pollution history.
Acknowledgements
We are grateful to all members of the Lomonosovfonna ice-coring project. the Finnish Forest Research Institute (Rovaniemi) provided facilities for processing the ice samples, and Juvegroup Oy (Rovaniemi) did the PAH analysis. M. K. Hermanson provided valuable comments on earlier versions of the paper, and R. M. Koerner provided an excellent review that significantly improved the paper. We are grateful to K. Azuma for handling our paper so efficiently. A. Igesund prepared Figure 1. Financial support came from the Finnish Academy, the Finnish Snow and Ice graduate school, Norwegian Polar Institute and the Nordic Arctic Research Programme of the Nordic Minister Council.


