


Implications
Sow BW and back-fat depth at service and during early gestation were less critical for subsequent reproductive success, but nevertheless should be monitored to enable appropriate sow management during gestation. Heavier sow live-weight and greater back-fat depth in late gestation was associated with improved reproductive performance. Heavier and fatter sows, regardless of parity, weaned heavier piglets, despite eating less during lactation. Further work to identify optimum targets for sow live-weight and back-fat depth during gestation would provide a potential benchmarking tool to monitor and improve the productivity of modern sow herds.
Introduction
Genetic selection within the pig industry to achieve higher production has aimed to provide consumers with lower cost meat products. This has resulted in the hyper-prolific sow being able to wean up to 31.3 pigs/year. However, pigs weaned per sow per year still varies greatly across the EU, with many EU countries having sub-optimal performance (e.g. United Kingdom: 26.0, Ireland: 26.1 v. Denmark 31.3 pigs weaned/sow per year, respectively) (InterPIG, 2015). Many factors, such as breed, parity, semen quality, nutrition management and environment, can influence reproductive success. In particular, sow back-fat depth and body condition have been identified as crucial to optimise numbers born alive and subsequent reproductive success in prolific sows (Maes et al., Reference Maes, Janssens, Delputte, Lammertyn and De Kruif2004). Published research on the body condition of replacement gilts recommended back-fat depths of between 18.0 and 23.0mm for gilts at first service (Filha et al., Reference Filha, Bernardi, Wentz and Bortolozzo2010; Roongsitthichai and Tummaruk, Reference Roongsitthichai and Tummaruk2014). However, Amdi et al. (Reference Amdi, Giblin, Hennessy, Ryan, Stanton, Stickland and Lawlor2013) reported no significant difference in total born, born alive or born dead between gilts considered fat or thin (19.0 v. 12.0mm back-fat depth, respectively) at service.
Recommendations regarding optimal sow live-weight and back-fat depth at service, based on historic data from less prolific sows, may no longer be appropriate for modern multiparous sows. It is generally recommended that sows should gain between 25.0 and 30.0 kg during gestation to allow for maternal and conceptus growth (Williams et al., Reference Williams, Close and Cole1985; Yang et al., Reference Yang, Eastham, Phillips and Whittemore1989). Although sow live-weight and back-fat depth are indicative of metabolic state, more subtle measures such as body protein mobilisation and energy balance may be more closely associated with subsequent sow fertility (Clowes et al., Reference Clowes, Aherne, Schaefer, Foxcroft and Baracos2003; Willis et al., Reference Willis, Zak and Foxcroft2003). Despite this, it is important to identify appropriate targets for sow live-weight and back-fat depth during gestation, as these easily obtained direct measures can be used as a practical on-farm tool to optimise sow productivity.
Association analyses of data accumulated from multiple studies offer the opportunity to increase the statistical power of comparisons as well as the detection of possible interactions. In a meta-analysis of 23 studies and five production data sets, Douglas et al. (Reference Douglas, Szyszka, Stoddart, Edwards and Kyriazakis2014) quantified the association between multiple factors and their interactions on gestating sow performance. The number of piglets born alive per litter was associated with initial and final sow live-weight during gestation, with a positive linear relationship between sow live-weight at the end of gestation and number born alive. Piglet birth weight was also associated with sow live-weight at the end of gestation. Piglet wean weight was associated with sow parity as well as both the initial and final sow live-weight during gestation.
Although it is important to understand the association of sow parity and live-weight with subsequent reproductive performance, back-fat depth should also be taken into consideration as it gives a representation of lean body mass. Quantifying parity, live-weight and back-fat depth associations in tandem could help identifying new approaches to sow herd management, which would improve sow productivity and piglet performance. The objective of the present study was to quantify the association of sow parity, live-weight and back-fat depth with sow reproductive performance and litter characteristics at birth and weaning by using individual sow information from 10 different studies.
Material and methods
Data
Data were obtained from the research farms at both the Teagasc Pig Development Department, Moorepark, Co. Cork, Ireland (52°7N; 8°16W) and the Agri-Food and Bioscience Institute (AFBI), Hillsborough, Co. Down, Northern Ireland (54°0N; 6°1W) from the years 2005 to 2015 inclusive. Over 70% of the data originated from the Teagasc Moorepark research centre. Sows and piglets were originated from 10 different experimental studies which evaluated gestation and lactation diet composition, feed allowance and timing of feed increments during gestation (Lawlor and Lynch, Reference Lawlor and Lynch2005; Lawlor and Lynch, Reference Lawlor and Lynch2007; Lawlor et al., Reference Lawlor, Lynch, O’Connell, McNamara, Reid and Stickland2007; Markham et al., Reference Markham, Latorre, Lawlor, Ashton, McNamara, Natter, Rowlerson and Stickland2009; Ryan et al., Reference Ryan, Lynch and Lawlor2009; McNamara et al., Reference McNamara, Giblin, Markham, Stickland, Berry, O’Reilly, Lynch, Kerry and Lawlor2011; Buzoianu et al., Reference Buzoianu, Walsh, Rea, O’Donovan, Gelencsėr, Ujhelyi, Szabȯ, Nagy, Ross and Gardiner2012; Cottney, Reference Cottney2012; Lawlor et al., Reference Lawlor, Ryan, O’Connell and Lynch2012; Walsh et al., Reference Walsh, Geraert, Maillard, Kluess and Lawlor2012; Amdi et al., Reference Amdi, Giblin, Hennessy, Ryan, Stanton, Stickland and Lawlor2013; Craig et al., Reference Craig, Henry and Magowan2016). A total of 13 827 piglet records and 1058 sow records from 24 treatments were used in the analysis. Sows ranged from parity 1 to 6 and number of sows per parity was distributed as follows: 232, 277, 180, 131, 132 and 106, respectively. Two gestation and two lactation trials in Moorepark were liquid fed and used the Big Dutchman feed systems (Vechta, Germany), whereas one gestation and one lactation trial were dry fed and used hoppers. One trial used both liquid and dry feeding during lactation. All trials in AFBI involved dry feeding and used a Nedap electronic sow feeder (Groenlo, The Netherlands) during gestation and wet and dry hoppers during lactation. Individual feed intake was recorded daily, in all trials. Each piglet was weighed at birth and given an identification marking, an ear notch or tattoo, which was subsequently replaced with an ear tag at 2 weeks of age. Each piglet was then weighed again at weaning, at ~28 days old. Cross-fostering was carried out within 24 h of birth with gestation trials standardising litters within treatment and lactation trials standardising litters across all animals. Three trials in Moorepark standardised litters to a minimum of nine pigs per sow, whereas one trial ensured 10 pigs/sow. One trial in Hillsborough standardised litters to 14 pigs/sow. Cause of pre-weaning mortality was not recorded in each trial but when recorded the most common causes included stillbirths, lain on by sow and weakened by starvation.
Information was available on the number of piglets born (TB), born alive (BA), piglet birth weight (BtWT), pre-weaning mortality per litter (PWM), piglet wean weight (WnWT), number of piglets weaned (Wn), wean to service interval (WSI), piglets born alive in subsequent farrowing and sow lactation feed intake. Calculated variables from the available information included the within-litter CV in birth weight (LtV), pre-weaning growth rate per litter (PWG), total litter gain (TLG), lactation efficiency and litter size reared. LtV was calculated as the within-litter standard deviation of piglet birth weight divided by the respective litter mean piglet birth weight. PWG was calculated by dividing the difference between mean litter birth weight and wean weight by the respective age at weaning; TLG was the difference between total litter wean weight and birth weight. Lactation efficiency was calculated by dividing the sow net energy input during lactation by total litter gain (kg), where net energy input was calculated by adding the total energy gained from feed during lactation to the energy gained from weight lost during lactation (assuming every 1 kg loss=12.5 MJ digestible energy) and energy from creep feed (every 1 kg=1.1 MJ DE×lactation days) (Close and Cole, Reference Close and Cole2000). Litter size reared was calculated by subtracting the piglets fostered out of the litter from total born alive and adding any piglets fostered in. BtWT, WnWT and PWG were analysed on a mean per litter basis. Information was available for each sow regarding parity, live-weight and back-fat depth, which was recorded using a back-fat scanner (Renco Lean Meater, Renco corporation, Golden Valley, MN, USA and Pig Scan-A-Mode back fat scanner, SFK Technology, Herlev, Denmark) at the P2 site (65 mm from the midline at the level of the last rib). Sow live-weight and back-fat depth were recorded at service, days 25, 50, 80 and 110 of gestation and at weaning. The two data sets used in analysis complemented each other as each trial collected similar baseline data, which enabled the information to be easily merged and analysed. However, sow genetic merit at each site differed and although all sows were Landrace and/or Large white based, a genetic effect could not be analysed.
Statistical analyses
The association of each dependent variable (i.e. TB, BA, BtWT, PWM, WnWT, Wn, WSI, piglets born alive in subsequent farrowing, lactation feed intake, LtV, PWG, TLG and lactation efficiency) with sow parity, live-weight and back-fat depth (independent variables) was determined separately using multiple regression mixed models in PROC MIXED (SAS Institute Inc., Cary, NC, USA). Parity (1, 2, 3, 4, 5 and 6), month and year of farrowing were included as fixed effects in the model, whereas sow was included as a repeated effect with the appropriate covariance structure among records within sow. In a separate analysis, the association of each dependent variable with sow live-weight was quantified, with back-fat depth also included as a covariate in the model. Whether the detected associations differed between gilts and sows (i.e. parity >1) was also investigated.
In a separate series of analyses, when the dependent variable was either BtWT or LtV, litter size was also included as a fixed effect. Furthermore in the analysis of Wn, WSI and piglets born alive in subsequent farrowing, litter size reared was included as a fixed effect in the model. When analysing PWM, PWG and TLG, litter size reared and the lactation diet (n=20) were also included as fixed effects in the multiple regression mixed model. When the dependent variable was WnWT, lactation feed intake or lactation efficiency, then litter size reared, lactation diet and lactation length were also included as fixed effects in the model, along with parity, month and year of farrowing.
Results
Descriptive statistics
Descriptive statistics for the dependent and independent variables are summarised in Table 1. On average, across all data, sows gained 72.6 kg during gestation and had an average live-weight loss of 32.9 kg during lactation. Mean sow parity differed between the studies and sites; however, the modal parity number in the entire data set was 3. Gestation length (mean=114.7 days) and lactation length (mean=27.7 days) did not differ between sites. On average 1.0 (SD=1.36) piglet was born dead per litter and average pre-weaning mortality was 11.2% (SD=12.09%). Piglets had an average weaning weight of 7.8 kg (SD=1.88 kg).
Table 1 Number of observations (N), mean and standard deviation of variables in the entire sow data set
Sow parity associations
Gilts had less TB and BA (P<0.05) than third and fourth parity sows (Figure 1a). Average piglet BtWT was lowest (P<0.05) in gilts, with piglets weighing 0.1 kg less than those born to parities 3 and 4 sows (1.5 v. 1.6 kg). Gilts also weaned the lightest piglets (mean of 8.2 kg); 0.3 kg lighter (P<0.05) than piglets from parities 2, 3 and 6 sows (Figure 1b). Gilt feed intake was lower (P<0.001) during lactation compared with all older sows with the feed intake of gilts being on average 156.8 kg (Figure 2b). Similarly, lactation efficiency was less (P<0.05) in younger sows compared with older sows (Figure 2b). Average piglet BtWT in parity 2 sows was not different (P>0.05) from parities 3, 4 or 5 sows. Parities 2 and 3 sows weaned more (P<0.01) piglets per litter than parities 5 and 6 sows (Figure 1a). Total litter gain was greater in litters from parity 2 sows compared with litters from gilts and parity 4 sows (Figure 2b). The number of piglets born alive in subsequent farrowing was significantly higher (P<0.05) for gilts, parities 2 and 3 sows compared with parity 6 sows (Figure 2c). LtV was greater (P<0.01) in litters born to parity 5 sows than in those born to younger sows, with 21.0% variation between litter mates in the former. Similarly, PWM was greater (P<0.05) for parities 5 and 6 sows, than for parities 2 and 3 sows (Figure 1c). Overall, the highest PWG was observed in piglets from parity 6 sows and this was on average 13.0 g/day greater (P<0.05) than that of piglets from gilts (Figure 2a). The WSI was shorter for older parity sows than for younger parity sows, and this was significant for parity 5 v. gilts (P<0.05).
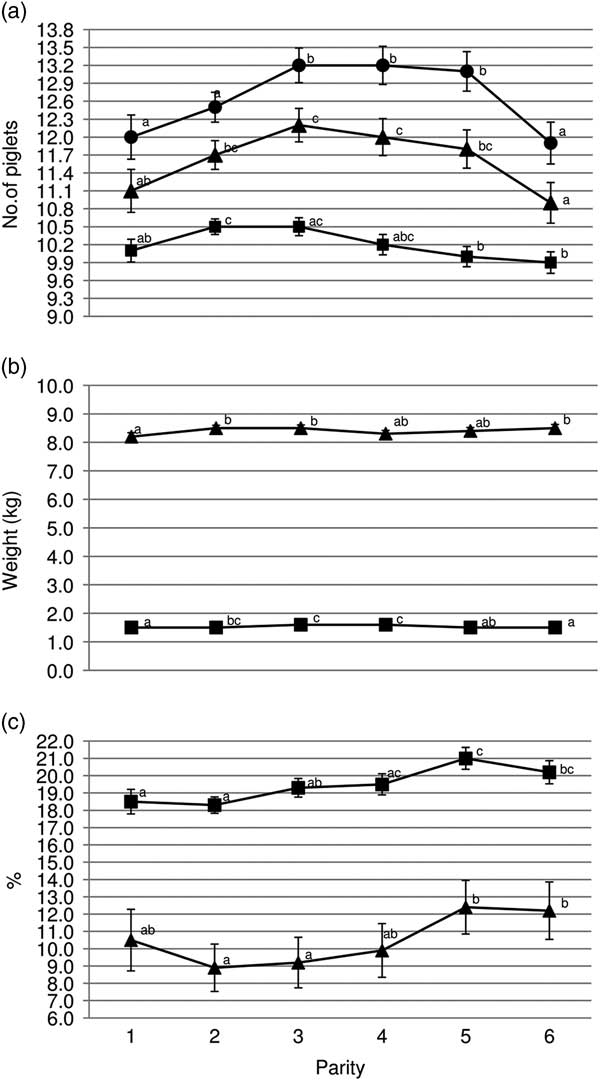
Figure 1 Sow parity and associated (a) mean total born (●), born alive (▲) and number weaned (■); (b) mean piglet birth weight (■) and wean weight (▲); (c) within-litter variation in birth weight (■) and percentage pre-weaning mortality (▲). a,b,cValues within trait with different superscripts differ significantly from each other (P<0.05).
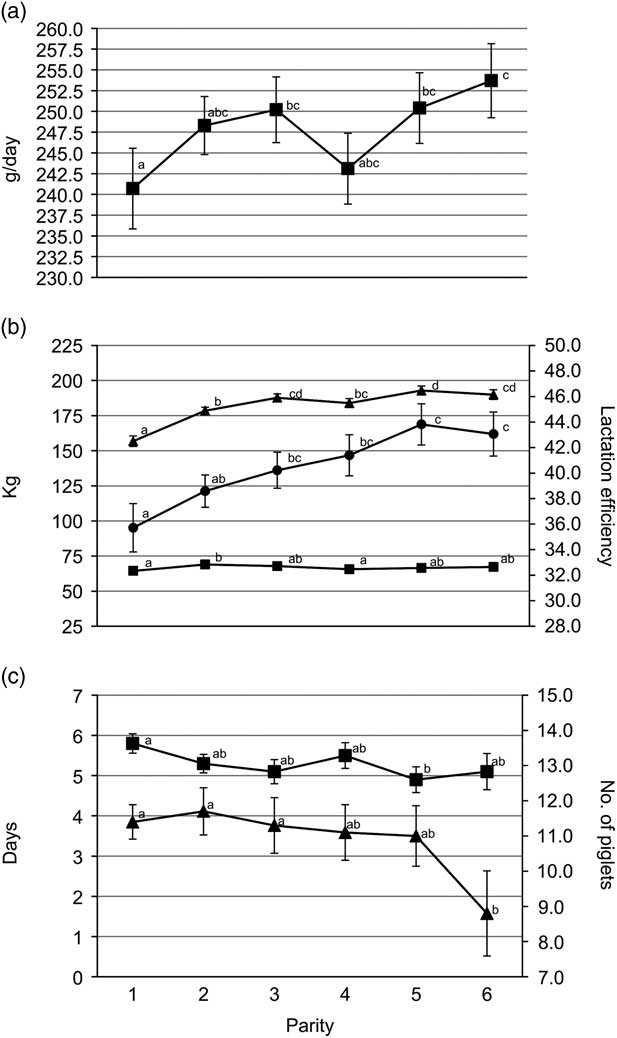
Figure 2 Sow parity with associated (a) pre-weaning growth rate (■); (b) total litter gain (■), lactation intake (▲) and lactation efficiency (●); (c) wean to service interval (■) and number born alive in subsequent farrowing (▲). a,b,c,dValues within trait with different superscripts differ significantly from each other (P<0.05).
Sow live-weight associations
Sow live-weight, whether adjusted for sow back-fat depth or not, at service, days 25 and 50 of gestation was not associated with TB, BA, BtWT and LtV (Table 2). Heavier sow-live-weight at day 110 was associated with an increase in TB and BA. When adjusted for back-fat depth, significant associations existed between sow live-weight at day 80 (P=0.028) and 110 (P<0.001) with TB, and between live-weight at day 110 and BA (P<0.001). The association between sow live-weight at day 80 with BtWT was linear but the associations between sow live-weight at day 110 and BtWT were non-linear. When adjusted for back-fat depth, independent of parity and litter size, each incremental 10 kg increase in sow live-weight at days 80 and 110 was linearly associated with an increase of 0.02 kg in individual piglet BtWT. Sow live-weight at weaning was positively associated with LtV even when adjusted for back-fat depth at weaning.
Table 2 Linear and quadratic (where different from 0; P<0.05) regression coefficients (standard error in parentheses) of the association of sow live-weight and back-fat depth on total born, born alive, average birth weight (kg) and within-litter CV in birth weight (%)
1 Coefficients expressed per 10 kg increase in sow live-weight, that is, at service a 10 kg increase in sow live-weight was associated with a 0.037 increase in total born.
2 Service=sows inseminated; d25, d50, d80 and d110=days 25, 50, 80 and 110 of gestation .
3 Coefficients expressed per 1 mm increase in sow back-fat depth, that is, at service a 1 mm increase in sow back-fat depth was associated with a 0.023 decrease in total born.
*P<0.05, **P<0.01, ***P<0.001.
Heavier sow live-weight at service, days 25, 50, 80 and 110 and weaning was associated with increased PWM with both linear and quadratic associations detected (Table 3). However, when adjusted for back-fat depth, all previously observed non-linear associations between sow live-weight and PWM were linear. Sow live-weight at service, days 25, 50, 80, 110 and weaning were negatively non-linearly associated with Wn, but when adjusted for back-fat depth, observed non-linear associations between sow live-weight and Wn were linear. Sow live-weight at both day 110 and weaning were positively associated with both PWG and WnWT, with or without adjustment for back-fat depth.
Table 3 Linear and quadratic (where different from 0; P<0.05) regression coefficients (standard error in parentheses) of the association of sow live-weight and back-fat depth on pre-weaning mortality (%), number weaned, pre-weaning growth rate (g/day) and average wean weight (kg)
1 Coefficients expressed per 10 kg increase in sow live-weight, that is, at service a 10 kg increase in sow live-weight was associated with a 1.081% increase in pre-weaning mortality.
2 Service=sows inseminated; d25, d50, d80 and d110=days 25, 50, 80 and 110 of gestation.
3 Coefficients expressed per 1 mm increase in sow back-fat depth, that is, at service a 1 mm increase in sow back-fat depth was associated with a 0.304% increase in pre-weaning mortality.
*P<0.05, **P<0.01, ***P<0.001.
Each 10 kg increase in sow live-weight at weaning was associated with 0.4 kg less TLG (P=0.043), but when adjusted for back-fat depth, each 10 kg increase in sow live-weight at service, days 50, 80 and 110 was associated with a decrease in TLG of 1.3, 1.2, 1.1 and 0.5 kg, respectively (Table 4). Heavier sow live-weight from service to day 110 was associated with greater lactation feed intake, although when adjusted for back-fat depth, only sow live-weight at days 50, 110 and at weaning remained significant. No association existed between sow live-weight and lactation efficiency even after adjusting for back-fat depth. WSI reduced by 0.1 days for each 10 kg increase in sow live-weight at day 50 of gestation. When adjusted for back-fat depth, each 10 kg increase in sow live-weight at service and day 50 reduced WSI by 0.13 days. Each 10 kg increase in sow live-weight at days 25, 50 and 80 of gestation was associated with 0.2 less piglets born alive in the subsequent farrowing but, when adjusted for back-fat depth, these associations no longer remained.
Table 4 Linear and quadratic (where different from 0; P<0.05) regression coefficients (standard error in parentheses) of the association of sow live-weight and back-fat depth on total litter gain (kg), lactation intake (kg), lactation efficiency, wean to service interval (days) and number of piglets born alive in subsequent farrowing (BASF)
1 Coefficients expressed per 10 kg increase in sow live-weight, that is, at service a 10 kg increase in sow live-weight was associated with a 0.535 kg decrease in total litter gain.
2 Service=sows inseminated; d25, d50, d80 and dd10=days 25, 50, 80 and 110 of gestation.
3 Coefficients expressed per 1 mm increase in sow back-fat depth, that is, at service a 1 mm increase in sow back-fat depth was associated with a 0.117 kg increase in total litter gain.
*P<0.05, **P<0.01, ***P<0.001.
Sow back-fat depth associations
Sow back-fat depth at service, days 25 and 50 were not associated with TB, BA, BtWT or LtV (Table 2). Non-linear associations existed between back-fat depth at weaning and TB. Each 1 mm increase in sow back-fat depth at days 80 and 110 was associated with a decrease of 0.1 and 0.08 BA, respectively. Each incremental 1 mm increase in sow back-fat depth at day 80 was associated with a 0.007 kg increase in BtWT. At day 110, each 1 mm increase in sow back-fat depth was associated with a 0.09 decrease in TB but an increase (P<0.01) in BtWT of 0.005 kg. There was no association between sow back-fat depth and LtV.
Sow back-fat depth at service, days 25, 50, 80 and 110 was not associated with PWM or Wn (Table 3). Each 1 mm increase in sow back-fat depth at weaning was associated with a 0.4% increase in PWM and a 0.06 decrease in Wn. There was no association between sow back-fat depth and PWG, but there was a significant association between sow back-fat depth at day 110 and greater WnWT. Each 1 mm increase in sow back-fat depth at day 110 was associated with a 0.3 MJ/kg reduction in lactation efficiency (Table 4). Greater sow back-fat depth at each time point between day 25 to weaning was negatively associated with lactation feed intake. Sow back-fat depth was not associated with either TLG, WSI or the number of piglets born alive in subsequent farrowing.
Discussion
Sow parity
Corroborating the observation of fewer TB in gilts in the present study, Milligan et al. (Reference Milligan, Fraser and Kramer2002) reported that first and second parity sows also had fewer TB than middle-aged (parities 3 to 5) or older sows (parities 6 to 8). Likewise, these authors also found that the numbers born alive was greatest for middle-aged sows because stillbirth rate increased with age. Our analysis showed that first and second parity sows produced litters with less variation in piglet BtWT than older sows. It has been suggested that litters from younger sows are more uniform with regards to BtWT as a result of the associated lower litter size (Quesnel et al., Reference Quesnel, Brossard, Valancogne and Quiniou2008), which could explain this result. In the present study, a higher level of piglet birth weight variation was observed in older sows and may be explained by increased ovulation rate. Increased embryo numbers exceed uterine capacity resulting in ‘uterine crowding’ and as a consequence variation in placental development impacts piglet development and subsequent performance (Foxcroft et al., Reference Foxcroft, Dixon, Novak, Putman, Town and Vinsky2006).
In the present study, gilts had lower lactation feed intake, TLG and PWG compared with litters and piglets born to older sows. Indeed, first parity sows with lower lactation feed intake also experienced poorer lactation efficiency and extended WSI. Voluntary feed intake of primiparous sows during lactation is often inadequate to meet the nutritional demands of maintenance and growth as well as supporting milk yield (Noblet et al., Reference Noblet, Dourmad and Etienne1990). Pluske et al. (Reference Pluske, Williams, Zak, Clowes, Cegielski and Aherne1998) suggested that primiparous sows may partition more energy to growth than milk production compared with higher parities, although many gilts still experience an increase in lactation weight loss and as a result delayed return to oestrus, reduced conception rate and embryonic survival (Eissen et al., Reference Eissen, Kanis and Kemp2000).
Pre-weaning mortality is on average 11.0% in pigs (Kilbride et al., Reference Kilbride, Mendl, Statham, Held, Harris, Cooper and Green2012), similar to the level of 11.2% in this study. In agreement with Milligan et al. (Reference Milligan, Fraser and Kramer2002), the present study found that second and third parity sows experienced reduced PWM, and consequently weaned more piglets per litter than older sows. Although the cause of death was not used in the present analysis, Weary et al. (Reference Weary, Phillips, Pajor, Fraser and Thompson1998) reported a greater probability of crushing of newborn piglets as sows aged. However, the suggestion that older heavier sows are less agile and less responsive to piglet distress calls is not conclusive. Regardless of parity, several factors can contribute to increased PWM by crushing, such as housing system, large litters, low piglet birth weight, sow breed and her individual nature (Andersen et al., Reference Andersen, Berg and Bøe2005).
We found that parity 3 sows had more TB, more BA and heavier piglets than younger sows. Indeed Sasaki and Koketsu (Reference Sasaki and Koketsu2008) reported reduced born alive in both gilts and parity 2 when compared with older sows. To be profitable a sow must persist in the herd for more than 3 parities (Lucia et al., Reference Lucia, Dial and Marsh2000; Stalder et al., Reference Stalder, Lacy, Cross and Conatser2003). The average parity of sow removal in a commercial herd in the United States ranging from 3.1 to 4.6, with the most common cause of removal in older parity sows being udder problems, low productivity and old age (Engblom et al., Reference Engblom, Lundeheim, Dalin and Andersson2007).
Koketsu et al. (Reference Koketsu, Dial, Pettigrew and Marsh1996) reported that gilts had significantly lower lactation feed intakes than multiparous sows. Similarly, the present study found that lactation feed intake increased with increasing parity, and lactation efficiency also increased. As a result, piglets born to parity 6 sows gained more during the suckling period than parities 1 to 5 sows. This could also be explained by the smaller total litter size of parity 6 sows, contributing to potentially more milk available per piglet. Although it has been reported that parities 4 to 7 sows produce less colostrum than their younger contemporaries (Decaluwė et al., Reference Decaluwė, Maes, Declerck, Cools, Wuyts, De Smet and Janssens2013) and that milk yield tends to be greater for parities 2 and 3 sows compared with gilts and older sows, greater lactation feed intake in older sows enables greater milk production throughout lactation (Eissen et al., Reference Eissen, Kanis and Kemp2000).
Sow live-weight and reproductive performance
With increasing parity, sows develop a greater proportion of lean mass, and as a consequence become heavier (Whittemore and Kyriazakis, Reference Whittemore and Kyriazakis2008). Therefore, in the analysis in the present study, sow live-weight was adjusted for back-fat depth to more accurately reflect size, as a heavier sow does not necessarily have greater back-fat depth. Heavier sow live-weight in late gestation was associated with increased TB and BA, corroborating the findings of Douglas et al. (Reference Douglas, Szyszka, Stoddart, Edwards and Kyriazakis2014). With an average total born of 12.9 in our study, the sows are comparable to commercial counterparts with a UK average of 13.2 total born between the years 2010 and 2016 (Agriculture and Horticulture Development Board, 2016). Sow live-weight at service to day 50 of gestation, whether corrected for back-fat depth or not, was not associated with reproductive performance. This may suggest that sow body condition at service may not be as critical to the reproductive success of modern sows as was previously thought. Previous research found that a weight loss of >10.0% before service reduced subsequent reproductive performance (Thaker and Bilkei, Reference Thaker and Bilkei2005). The effect was more pronounced in younger parity sows as they continue to generate lean mass post weaning.
Nevertheless, sow body condition at service and during early gestation may be more influential during lactation with regards to weaning output since, our study found that greater sow live-weight and back-fat depth during gestation was associated with reduced lactation intake but with no repercussion on WnWT. One explanation may be that sows with greater BW and back-fat depth at farrowing can mobilise body reserves more readily to meet the demands of litter (Whittemore and Kyriazakis, Reference Whittemore and Kyriazakis2008). However, maximising sow lactation feed intake is still crucial to limit loss of sow body condition during lactation and minimise any detrimental effect on the subsequent reproductive performance, for example, longer WSI (Thaker and Bilkei, Reference Thaker and Bilkei2005).
Sow back-fat depth and reproductive performance
As sow live-weight increases with parity it is not necessarily accompanied by an increase in back-fat depth (Whittemore and Kyriazakis, Reference Whittemore and Kyriazakis2008). Contrary to our results, Maes et al. (Reference Maes, Janssens, Delputte, Lammertyn and De Kruif2004) reported no significant relationship between back-fat depth between day 80 of gestation and farrowing with BA, whereas we found that greater back-fat depth at days 80, 110 and weaning was associated with decreased BA. It is likely a smaller litter size, as evidenced by a smaller BA, requires less energy to maintain during pregnancy, and thus the sow can partition proportionately more energy towards the accumulation of back-fat. It is well documented that sows that are too fat at parturition suffer longer farrowing duration and greater risk stillbirths (Oliviero et al., Reference Oliviero, Heinonen, Valros and Peltoniemi2010).
In the present study, greater back-fat depth at weaning was negatively associated with number weaned. Contrary to this, Maes et al. (Reference Maes, Janssens, Delputte, Lammertyn and De Kruif2004) found that lower back-fat depth at the end of lactation was associated with more pigs weaned. Our analysis showed that increasing back-fat depth was associated with lower lactation feed intake; similarly Dourmad (Reference Dourmad1991) reported that increasing the body fatness of gilts at farrowing was associated with a reduction in lactation feed intake. In the present study, greater back-fat depth during late gestation was negatively associated with lactation efficiency, suggesting fatter sows at parturition did not mobilise reserves to meet the demands of the litter. However, a back-fat loss of 1 mm between days 85 and 109 of gestation has been found to increase colostrum yield by 113 g/sow in the first 24 h post-farrowing (Decaluwė et al., Reference Decaluwė, Maes, Declerck, Cools, Wuyts, De Smet and Janssens2013).
Reproductive benefits and trade-offs associated with sow live-weight and back-fat depth
It is difficult to conclusively determine the effect of both sow live-weight and back-fat depth during gestation on reproductive performance as the latter can be influenced by many factors; yet the need to optimise both measures is apparent. For instance, heavier sow live-weight in late gestation was associated with improved reproductive performance but was accompanied by an increase in PWM and a reduction in number weaned. An increase in PWM could be expected as with increasing litter size the proportion of low-birth weight, unviable piglets’ increases (Wolf et al., Reference Wolf, Żȧkovȧ and Groeneveld2008). Greater back-fat depth during gestation reduced lactation feed intake, but was accompanied by an increase in piglet weaning weight. Similarly, Amdi et al. (Reference Amdi, Giblin, Hennessy, Ryan, Stanton, Stickland and Lawlor2013) reported that gilts that were fat at service experienced increased back-fat loss during lactation and increased piglet growth during the suckling period, however, with no difference in lactation intake. These results indicate that sows with more back-fat may have improved ability to mobilise body reserves to meet the demand of the litter for milk.
Overall this study has quantified the association of sow parity, live-weight and back-fat depth with the reproductive performance of modern sows. Increased litter size and numbers born alive was associated with greater sow live-weight and back-fat depth in late gestation. Heavier, fatter sows had heavier piglets at birth and also weaned heavier piglets, but did so with less lactation intake as sows mobilised body reserves to meet the demands of the litter. Thus, sow live-weight and back-fat depth at service, or indeed during early gestation, appear not to be critical to reproductive success, but may be important later on in gestation and during lactation. We were unable to determine optimal target sow live-weights and back-fat depths during gestation, or to make conclusions about the effect of diet composition or allocation level on reproductive success. Therefore, these should be the focus of future meta-analyses of experimental studies.
Acknowledgements
This work was part of a PhD project funded by the Department of Agriculture, Food and the Marine, Ireland (DAFM) and the University of Leeds. The authors gratefully acknowledge the funders. Part of this work was previously presented at the British Society of Animal Science annual conference 2017 Advances in Animal Biosciences.
Declaration of interest
The authors declare that there is no conflicts of interest.
Ethics statement
Ethical approval was granted by the appropriate local authorities for each original experiment included in this meta-analysis.
Software and data repository resources
All data reside with the authors and data files can be requested from Peadar Lawlor (Teagasc) and/or Elizabeth Magowan (AFBI).


 Open access