


The Importance of Legislative Voting Procedures
Voting records are a key window into legislative processes around the world. Scholars use individually recorded legislative votes, or roll-call votes (RCVs), to study the influence of legislative parties on voting behavior (unity), the preferred outcomes of parties on key issues (position taking), and the character of legislative conflict (polarization). These studies regularly rely on measures of legislator ideal points, party cohesion, and/or the dimensionality of the policy space that are derived from the RCV record.Footnote 1 It is only infrequently noted that legislators in most assemblies can vote by multiple methods (e.g., voice votes), making the RCV record a sample of legislative voting behavior.
The quality of any measurement strategy using RCV results depends crucially on how well the RCV record captures relevant aspects of all legislative voting behavior. The process that generates RCVs is thus a potential source of selection bias, a concern that that has largely been overlooked or dismissed in past studies.Footnote 2 This omission may be justified. First, legislatures where roll-call voting is the standard operating procedure will likely generate large voting records through roll call. Second, where RCVs are discretionary, the rules governing the use of RCVs may make it easy to invoke the process, perhaps generating a sufficiently representative sample of votes. For example, Poole and Rosenthal (Reference Poole and Rosenthal2007), in their study of the U.S. Congress, state that “[t]he selection-bias story is logically correct but empirically irrelevant” (Poole and Rosenthal Reference Poole and Rosenthal2007, 68). They discount its practical relevance because, for the U.S. Congress, they contend that the composition of the RCV record is sufficiently heterogeneous to generate estimates of legislators’ ideal points and the dimensionality of the policy space.Footnote 3
In this paper we examine the roll-call vote selection process and its sample properties in three steps. First, we present a novel dataset of legislative voting rules that significantly expands our understanding of the voting methods available to legislators and the institutional rules for choosing among them across contemporary legislatures. The key conclusion from our catalogue is that roll-call votes are not the standard operating procedure (SOP) in most legislatures, leaving open the possibility that sample bias is widespread.
In a second step, we present data on the prevalence of RCVs among legislative votes taken by multiple methods for a subset of these catalogued legislatures. While the raw frequency of RCVs seems to increase as thresholds for invoking the method decrease (Carey Reference Carey2009), we show that the prevalence of RCVs is generally not higher in legislatures with the lowest thresholds for invoking the method. Thus, one cannot infer from procedures that make it easy to invoke an RCV or even from a large volume of RCVs that we will automatically have a useful sample of votes taken via roll call. Unfortunately, absent the observation of individual legislator-level choices on non-RCVs, we cannot directly evaluate the sample properties of the RCV record.Footnote 4 Instead, one must turn to theory.
As a third step, we do so, examining theoretically whether position-taking incentives—a common informal argument for what gets roll-called—affect the character of the RCV sample. Using a formal model and simulations, we demonstrate that measures of ideal points, indicators of party unity, and efforts to capture the dimensionality of the policy space will be plagued by estimation problems if position-taking is the motivating story. Critically, this model is built on a set of assumptions that help maximize the chances an RCV sample is representative of all votes.Footnote 5 We demonstrate that the estimation problems are in fact a function of the prevalence of RCVs, not the total number of them cast. For plausible levels of RCV prevalence, we find serious estimation problems. In this paper, we seek to make clear the scope of the problem and to show that some of the currently accepted assumptions about benign data-generating processes do not hold.
Previous Efforts to Examine Vote Procedures Across National Legislatures
We currently lack a systematic and comparable description of the types and frequency of voting methods employed in contemporary legislative chambers around the world. Apart from a few important exceptions described below, roll-call vote studies typically focus on one legislature and provide at best a cursory discussion of voting procedures and the rules governing their use. Further, we are aware of only a handful of studies that describe or evaluate the sample properties of roll-call votes (Carrubba et al. Reference Carrubba, Gabel, Murrah, Clough, Montegomery and Schambach2006; Clinton Reference Clinton2007; Crisp and Driscoll Reference Crisp and Driscoll2012; Hug Reference Hug2010; Lynch and Madonna Reference Lynch and Madonna2013; Roberts and Smith Reference Roberts and Smith2003; Saalfeld Reference Saalfeld and Doring1995; Van Doren Reference Van Doren1990).Footnote 6 That said, scholars have compiled notable—but still limited—cross-national comparisons of legislative voting procedures. We briefly review them below, as they provide an important reference for our analysis of an original catalogue of voting rules presented in the next section. In addition, a discussion of these studies highlights several important empirical claims that we hope to engage with our new dataset.
The Inter-Parliamentary Union (Inter-Parliamentary Union 1986) produced an impressive catalogue of legislative voting rules, based on a survey of legislative staff in 1985. More recently, four region-specific studies report the rules governing roll-call votes and their use. Based on interviews and the published standing orders in the early 2000s, Carey (Reference Carey2009) catalogued the SOP and the frequency of RCVs for 24 legislatures in the Americas. Crisp and Driscoll (Reference Crisp and Driscoll2012) provide a slightly more recent description of most of the legislatures covered in Carey (Reference Carey2009) along with several additional ones from Latin America.
Two studies have focused on European legislatures. Saalfeld (Reference Saalfeld and Doring1995) catalogued voting rules and reported the frequency of RCVs in 19 Western European legislatures as of the mid-1980s. Hug, Wegmann, and Wüest (Reference Hug, Wegmann and Wüest2015) provide a recent and more comprehensive review of voting procedures in  $ 54 $ European parliaments. Based on an expert survey, they catalogue the SOP for votes on final passage of legislation and provide information on how alternative voting methods could be invoked.
These studies all reach three fairly similar conclusions. First, vote results recorded at the level of the individual legislator are rarely the only form of legislative voting available. Second, when considering votes on most legislative business, voting by roll-call is rarely even the standard operating procedure. Thus, RCVs are almost always a sample of all votes taken, raising the potential that selection bias in RCVs is widespread. Third, the raw number of roll-call votes varies significantly across legislatures and, in general, it is inversely related to the technological and procedural obstacles for invoking an RCV.
Hansen and Debus (Reference Hansen and Debus2012, 715) contend that any selection bias should be minor in a legislature where the procedural rules for requesting recorded votes are low because the ease of invoking RCVs should ensure a relatively large and diverse sample of votes. Thus, exactly the chambers where RCVs are plentiful, and therefore attractive for empirical study, are likely those where the selection bias is small. However, whether this contention holds remains an open question. None of the studies described above reports the prevalence of RCVs among all of the forms of votes taken.Footnote 7 Consequently, we return directly to this contention in our ensuing empirical and theoretical analyses—finding, in both cases, that it does not hold.
A Catalogue of the Procedures for Choosing among Vote Methods in Contemporary Legislatures
We have systematically assembled and coded information on legislative voting procedures for  $ 145 $ legislative chambers across $ 105 $ countries spanning Europe, Africa, the Americas, and Asia.Footnote 8 This procedural information was collected from the current (circa 2018) official standing orders (cameral rules of procedure) published by each legislature.Footnote 9 We selected these legislatures because the standing orders where available in digital form from their official government website and were published in a language in which we had literacy.Footnote 10 Our dataset allows for an evaluation of contemporary rules governing the choice of legislative voting methods for a significantly larger set of cases than were included in previous studies.
Further, for a subset of these legislatures, we collected both the raw number of roll-call votes and the prevalence of those votes as a share of votes taken by all available methods. Note that the calculation of prevalence requires a comprehensive count of all legislative votes. We are aware of no legislature that publicly reports this number. However, a careful reading of the plenary minutes or related documents for some legislatures provides the relevant information. We therefore surveyed the legislatures in our dataset for electronic versions of their plenary minutes that provided this information in a consistent format and in a language in which we had expertise. Beyond four chambers that have been identified in previous studies, we found an additional 11 legislative chambers that fit these criteria.Footnote 11
This sample of legislatures is not enormous, but it allows a much larger view of RCV prevalence than has been reported in any previous study. Again, reporting prevalence in RCV studies is extremely rare, and even those rare instances typically involve only a single legislature. Furthermore, the available legislatures vary significantly in terms of the threshold for invoking an RCV. This variation allows us to examine the relationship between the size of the threshold and RCV prevalence, which is central to the argument by Hansen and Debus (Reference Hansen and Debus2012, 715) for why the selection process for RCVs is benign. Particularly, the argument claims that if legislators and parties are focused on position-taking for their constituents, the low threshold should generate a relatively large and diverse share of votes. Our data will engage this argument more directly than has any study to date. We will also engage it in the simulations that follow, showing that prevalence is critical to the sample properties.
We rely on cameral rules for defining voting methods. These rules govern the procedures for legislative debate and decision making, including voting rules. In some instances, the rules identify a single vote procedure (e.g., rising in places), suggesting that all of a legislature’s business will be conducted under that procedure. Other cameral rules define multiple voting procedures and their application to different types of decisions. For example, votes confirming presidential appointees may be set aside as decisions to be taken via a secret vote. In other cases, the cameral rules may single out a vote on the final passage of legislation for roll call, while applying other methods to votes on earlier parts of the legislative process (e.g., amendments to or votes on individual articles within a larger bill). Finally, cameral rules that permit multiple methods of voting define the mechanisms by which the SOP—whichever form of voting it is—can be set aside in favor of an alternative form of taking a vote.
For the SOP, we report voting methods defined for most legislative business—that is, any type of decision not explicitly singled out for the use of a specific, special voting method. For the purposes of this catalogue, we defined the voting method as an RCV if it produces a record of individual-level votes that is accessible to the public (e.g., through vote tables). Non-RCV methods are those that fail to meet this definition and commonly include voting by voice, rising in places, or secret ballot.
One might argue that only final votes on the passage of an entire piece of legislation merit attention. However, if we are interested in describing how individual legislators vote on legislative business and the character of legislative conflict, then final passage votes are only one of many types of relevant votes. This comprehensive view of votes is consistent with much of the empirical literature that employs roll-call vote data to learn about legislative behavior (e.g., Bräuninger, Müller, and Stecker Reference Bräuninger, Müller and Stecker2016; Carey Reference Carey2007; Carson et al. Reference Carson, Koger and Young2010; Crespin and Rohde Reference Crespin and Rohde2010; Jenkins Reference Jenkins2008; Poole and Rosenthal Reference Poole and Rosenthal2007). After all, votes setting the day’s agenda or determining the fate of a single (poison) amendment can significantly affect the substance of legislative business and elicit legislator’s ideological positions, the influence of party leadership, and other relevant aspects of legislative behavior. Singling out votes of final passage for attention would ignore all the critical business that occurs before what may end up being a pro forma vote on a carefully selected and highly vetted item. Consequently, for each chamber in our sample we collected the following information:
• whether the SOP is RCV or non-RCV as well as the precise method of casting a vote (electronic, voices, show of hands, rising in places, etc.),
• whether legislative actors can invoke a voting method that departs from the SOP (from RCV to non-RCV or non-RCV to RCV), and
• the legislative actors who can invoke a voting method that departs from the SOP.
Section A of the Online Appendix presents this information in Table OA.A1 for all  $ 145 $ chambers.
Before discussing the results, we first evaluate the validity of our catalogue of voting rules compared with another recent source based on an expert survey: the Hug, Wegmann, and Wüest (Reference Hug, Wegmann and Wüest2015) project. Of the  $ 48 $ chambers where our studies overlap, our classifications agree for the vast majority ( $ 43 $).Footnote 12 For the five instances of disagreement, we found that our classification comported best with the actual practices reported in the plenary minutes as of $ 2018 $. We know that in one case of apparent disagreement (Sweden), voting procedures actually changed between the time of the expert survey and our cataloguing of cameral rules. In general, this exercise gives us confidence in the quality of our dataset.Footnote 13
We now turn to the survey of 145 legislatures. Two empirical patterns are particularly noteworthy. First, for 105 (72%) of the legislatures, the SOP for most legislative business is a non-RCV method.Footnote 14 Second, RCVs are the exclusive vote method in only 18 (12%) of the legislatures.Footnote 15 Thus, in 88% of the chambers, non-RCVs are either the SOP or they can be invoked by various legislative actors—making RCVs a sample of all votes taken.
These findings, by themselves, do not necessarily raise a serious issue for research on legislative politics. It is possible that the legislatures of most interest to scholars are largely those where RCVs are mandatory, or at least the SOP. To see if this is so, we counted the number of articles in the Social Sciences Citation Index that reference each legislative chamber. In Table OA.B1 (presented in Section B of the Online Appendix) we present a list that includes each chamber, the number of articles focused on it, and the share of total articles these represent.Footnote 16 The results indicate that the RCV-selection concern is a potential issue for the overwhelming majority of research on legislative politics. The vast majority (81%) of all articles focus on chambers using non-RCV methods as the standard procedure.Footnote 17 And, interestingly, the chambers where the selection issue is absent—those with mandatory RCVs—have not uniformly attracted scholarly attention. Indeed, a third of these were the focus of two or fewer publications during the 19-year period.
It is worth noting that the bulk of legislative research involves only a fraction of the 145 chambers catalogued here. The 30 most studied legislative chambers account for about 89% of all articles about legislative politics. Only four of these feature a mandatory RCV procedure, and they account for a small share (7%) of all articles that focus on this set of chambers. Similarly, chambers that feature an RCV method for the SOP, but allow non-RCVs, represent only six of the top 30 chambers and are seldom the focus of published research.Footnote 18 In contrast, legislatures with non-RCV procedures as the SOP attract the lion’s share of scholars’ attention—around 82% of the articles focusing on the 30 most-studied chambers. In sum, the potential selection problems for RCV analysis apply to a large share of the legislatures that are the focus of scholarly research.
We therefore need to understand the rules for invoking RCVs—and the norms for their use—to determine the severity of any selection-bias issues. As we report in Table OA.A1 in the Online Appendix the rules vary considerably. In some instances, the procedural threshold to invoke an RCV is quite high. For eight chambers, a majority of those present or even a majority of total members need to agree to a roll call in order for one to be held. In an additional 10 chambers, at least 20% (but less than 50%) of the chamber needs to approve a request for the use of roll-call procedures. High procedural thresholds are not the norm though. Indeed, 32 legislatures require only a request by a single legislator to invoke an RCV. The widespread use of low or modest thresholds may mitigate or even eliminate the selection problem, provided the low procedural obstacles to invoking RCVs generate a large and diverse sample of votes. We turn to that question next.
In Table 1, we present RCV prevalence information for 15 legislative chambers where the SOP is a non-RCV method and the thresholds for invoking an RCV are relatively low. Five of these chambers require the bare minimum—a single member of parliament—to invoke roll-call voting. Several others require the support of a very small share of the legislature. For example, the 6-member threshold in Mexico’s lower chamber corresponds to slightly over 1% of the total membership. The highest threshold in our sample of cases is one-third of members in attendance, required in Uruguay’s lower house. Finally, some legislatures, such as the French Senate, do not define a preset number of members as a threshold, allowing a range of institutional actors (e.g., parties, committees, or the government) as well as regular members of parliament to request an RCV.
Table 1. Voting Procedures and Practices for Most Legislative Business
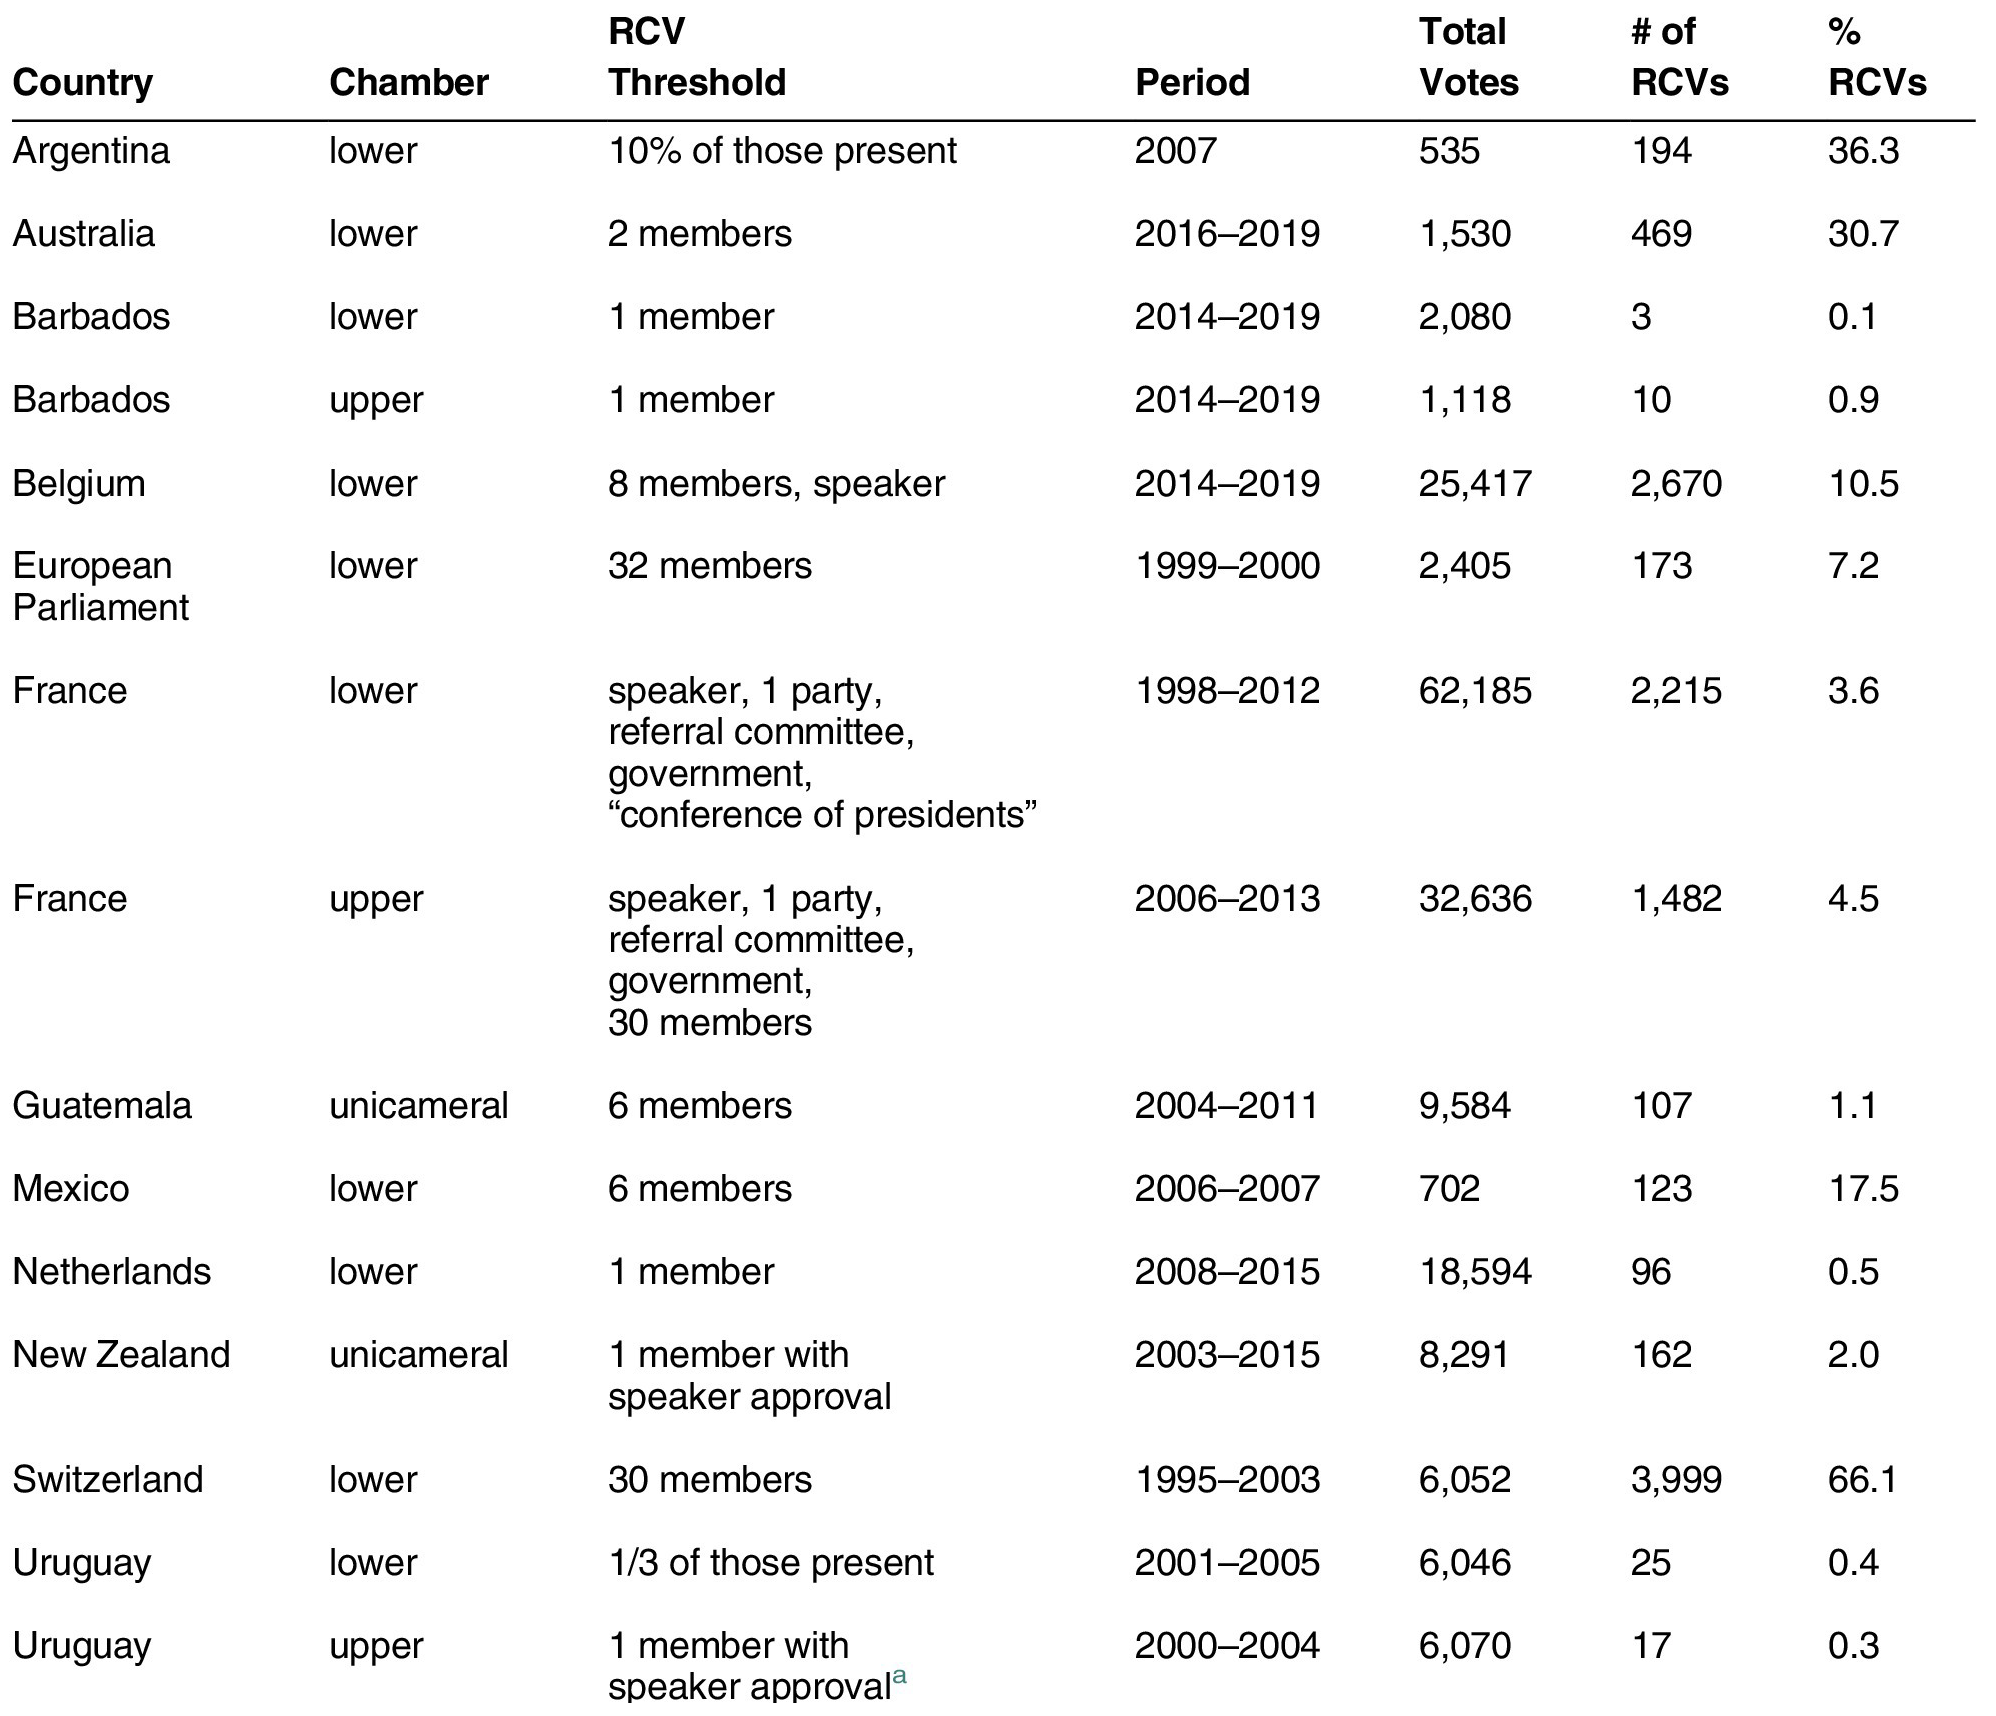
Note: The entry for the Swiss lower chamber and Guatemala’s unicameral legislature reflect older standing orders. The rules have since been revised, and the current SOP in both chambers is an RCV (open) method (see Table OA.A1). For this exercise, we use the older rules because we have data on RCV prevalence for periods during which a non-RCV method was the SOP in these chambers. This enables us to examine the relationship between thresholds for invoking an RCV and the prevalence of such votes.
a We determined this from the observed practice described in the plenary minutes. The chamber’s rules of procedure do not indicate how to invoke a roll-call vote.
The table also presents information on the share of votes by roll call (i.e., the prevalence of RCVs) in these legislatures. As described earlier, we successfully identified information on the universe of legislative votes for significant periods in 11 chambers where the publicly available documents (e.g., the plenary minutes) present sufficient detail of legislative proceedings for us to identify systematically votes of all sorts. To these, we add the relevant information for the four legislatures (the European Parliament, the lower chambers of Argentina and Mexico, and the Swiss lower chamber) presented in past studies (Carrubba et al. Reference Carrubba, Gabel, Murrah, Clough, Montegomery and Schambach2006; Crisp and Driscoll Reference Crisp and Driscoll2012; Hug Reference Hug2010).Footnote 19 This sample of legislatures—albeit a convenience sample—provides the largest comparison of RCV prevalence to date, allowing us to examine how low thresholds for invoking a roll call are related to their prevalence among all votes taken.
Despite the lack of major procedural obstacles across most of these legislatures, the average prevalence of RCVs is only 12%. What is more, even in legislatures where all final passage votes must be taken by RCV (Argentina, Belgium, Mexico, and Switzerland), it is still the case that less than half of votes are taken by roll call. Perhaps the most striking observation is that the five legislatures with the absolute minimum threshold (1 member) rarely vote by roll call: the average prevalence is less than 1%. The fact that RCVs tend to constitute such a small share of total votes, despite the ease of invoking the procedure, only increases our concern that many roll-call analyses may involve unrepresentative samples of legislative votes. Moreover, the threshold is not inversely related to prevalence among these chambers. The correlation between the share of votes taken by RCVs and the percentage of legislators required to request an RCV is 0.18 (p = 0.51).Footnote 20 Note that these results do not depend on any one legislature; with one exception, the correlation is statistically insignificant if we drop individual legislatures from the estimation. If we drop Uruguay’s lower chamber, the correlation is 0.68 ( $ p<.01 $)—a relationship that contradicts the current thinking.
Finally, it is important to note that the relatively high prevalence of RCVs in the Swiss lower house proved to be no insurance against selection problems. Recall that Hug (Reference Hug2010) is unique in that it compared the individual-level voting behavior of legislators on votes they knew to be recorded and on votes they expected to go unreported at the individual level. That comparison revealed a distinct selection bias—partisan blocs were discernibly less cohesive when using non-RCV voting methods.
Let us quickly repeat the conclusions we can draw from our overview. It seems very likely that in most legislatures the votes taken via roll call might be a biased sample of all votes. For most legislative business, roll call is the SOP for only around a quarter of chambers throughout the world. In some of these cases the procedural obstacles for invoking a roll call can be quite extreme. Even where the threshold for invoking a roll call is quite low, this does not predict the prevalence of votes taken by that method.
These findings are concerning for the extensive, unquestioned use of roll-call voting records to calculate measures of individual ideological location, partisan homogeneity/discipline, or dimensionality of the policy space. Unless the selection process is benign, traditional RCV analyses likely produce biased results for a broad range of legislatures.
Modeling the RCV Selection Process
Roll-call votes are used extensively to estimate three legislative phenomena of interest: the location of legislator ideal points, party unity (or cohesion), and the dimensionality of policy contestation. If the RCV selection process is not entirely benign, RCV estimates of these three quantities could be misleading including being biased, imprecise, or otherwise inaccurate. The presence of these problems is very difficult to evaluate in a purely empirical manner. With one exception (Hug Reference Hug2010), the legislative records of parliaments lack necessary information about individual legislative behavior on non-RCVs. Less direct empirical comparisons such as those comparing attributes (e.g., policy area) of RCVs and non-RCVs may indicate potential sources of problems (Carrubba, Gabel, and Hug Reference Carrubba, Gabel and Hug2008; Crisp and Driscoll Reference Crisp and Driscoll2012), but any conclusions about the nature of the problem (e.g., direction and magnitude in estimation bias) require theoretical interpretations of the data-generating process.
Theoretically, RCVs can have one of two relationships with the underlying universe of votes. One option is that making a vote public record causes legislators to vote differently than they would have if the RCV had not been requested. The other option is that RCVs simply make public specific voting activity, without changing how individuals vote. Previous work demonstrates the dramatic effect on RCV samples and their properties if calling a vote is associated with changing votes because of party disciplining (Carrubba, Gabel, and Hug Reference Carrubba, Gabel and Hug2008). What we still do not know is whether RCVs provide a problematic understanding of legislative behavior if they do not alter voting behavior. This question is particularly important given that scholars have questioned whether RCVs are actually used to influence voting behavior (Carey Reference Carey2009; Thierse Reference Thierse2016). Further, this is the most favorable case for RCVs to be an innocuous sample of votes.
What follows is a simple theoretical model designed to characterize a position-taking story in which RCVs are requested to highlight certain votes (but not to change an individual legislator’s vote decision). We then use that model to create a simulation exercise in which we demonstrate how ideal point estimates, unity scores, and estimates of dimensionality are influenced by this selection process.
A Position-taking Model of Roll-call Requests
If RCVs are intended, in some fashion, to record party positions on specific issues, we will refer to this motivation as “position-taking.” A variety of position-taking motivations have been posited, including signaling to the public your support for a popular policy, the opposing party’s support for an unpopular policy, your party’s unity around some issue, and/or the opposing party’s disunity over the issue (Carey Reference Carey2007, Reference Carey2009; Crisp and Driscoll Reference Crisp and Driscoll2012; Kreppel Reference Kreppel2002; Saalfeld Reference Saalfeld and Doring1995, 548). For this simulation, we model parties as caring about relative demonstrated unity. That is, if a vote is made public, each party wants to show that it is more unified about some issue than the other party is. We focus on preferences over unity because it captures a selection mechanism posited in the literature in which those requesting roll calls have preferences over exactly the output of interest we are trying to study. We model those preferences as being over relative unity since parties simultaneously have an incentive to try to show well while embarrassing the other party. Note that we use the term unity for voting division on a single motion and cohesion as the average unity across a set of votes. Assume there are two parties  $ i\in \left\{\ell, r\right\} $ competing over a unidimensional policy space, $ {\mathbb{R}}^1 $.Footnote 21 Each party consists of a set of party members (backbenchers) and a party leader, $ {I}_i $, whose ideal policy is located at the median of his or her party. Without loss of generality, we fix the party leaders’ ideal policies at $ {I}_r=1 $ and $ {I}_{\ell }=0 $.
For an  $ N $-person legislature, we define the set of backbench legislators’ ideal points as being drawn from a uniform distribution around their party leader’s ideal point, such that $ {x}_{\mathrm{ij}}\sim U\left[{I}_i-d,{I}_i+d\right] $ for $ j\in \left\{1,\dots, N\right\} $ and $ i\in \left\{\ell, r\right\} $. The parameter d measures how potentially varied that the preferences of the parties’ members are, and it will be referred to as potential party heterogeneity throughout.Footnote 22 For $ d\le 0.5 $ party member policy ideal points will not overlap. As d increases, the parties become less differentiated. Finally, let $ \upphi \in \left(0,1\right) $ denote the proportion of the legislative chamber controlled by the right party, such that there are a total of $ {n}_r=\left({\upphi}^{\ast }N\right)-1 $ backbenchers in the right party and $ {n}_{\ell }=\left[{\left(1-\upphi \right)}^{\ast }N\right]-1 $ backbenchers in the left party. For $ \upphi \le 0.5 $ the left party is the majority party. As $ \upphi $ increases, the right party becomes increasingly dominant.
The structure of the model proceeds as follows. Parties are competing over potential motions made in the one-dimensional policy space. A motion will consist of a pair  $ m=\left\{b, sq\right\} $, where b is the location of the proposal and $ sq $ is the location of the status quo. First, party leaders must choose whether to initiate a motion by proposing (b) or not, where not making a proposal preserves the status quo ( $ sq $). Motions with $ b< sq $ ( $ b> sq $) are treated as possible proposals by the left (right) party. The agenda that determines possible motions is described in detail below. Critically, it is an agenda-setting process with a minimum of control.
If a proposal is made, we allow any member of the chamber to initiate a roll-call vote, where  $ {R}_i=\left\{ RCV,\neg RCV\right\} $. We make this assumption to ensure maximal ease of making an RCV request—something our empirical work indicates is reasonably common. Requesting a roll-call vote entails a cost, $ k\ge 0 $. These costs reflect the potential time and imposition of recording the votes. The smaller the value of k, the less the inconvenience. Once a bill proposal has been made and a voting procedure determined, individual votes are cast for either the proposal or status quo: $ {v}_j=\left\{b, sq\right\} $. The outcome of the vote $ z\in \left\{b, sq\right\} $ is the majority winner.
Preferences over relative revealed unity for a given vote are based upon simple preferences over each party’s unity score. The unity score of the proposing (opposition) party is defined as the proportion of that party voting in favor of (against) the proposal. A legislator’s (leader or backbencher) relative unity score is the difference between the two parties’ unity scores.
Formally, a legislator’s relative unity score for a bill their party supports is  $ {V}^{\ast }{c}_i=\frac{B_i(b)}{n_i}-\frac{B_{\neg i}(sq)}{n_{\neg i}} $, where $ V=\left\{0,1\right\} $ is an indicator function equaling 1 only if an RCV is requested and $ {B}_i(v) $ is the number of legislators in party i voting for policy v. If a legislator’s party does not support the proposal, his or her relative unity score is $ {V}^{\ast }{c}_i=\frac{B_i(sq)}{n_i}-\frac{B_{\neg i}(b)}{n_{\neg i}} $. Legislators voting against their party’s majority position receive a zero payoff from the parties’ relative unity.Footnote 23 Legislators will have an incentive to request RCVs when the relative unity advantage, $ {c}_i $ is sufficient to outweigh the cost of making the request, k.
Altogether, payoffs are as follows. As described above, backbenchers and party leaders care about both the policy outcome and the relative revealed unity (if an RCV is requested) for a given vote. Because we want to model RCV requests as highlighting, not changing, voting behavior, we assume legislators’ incentives to vote sincerely dominate strategic incentives to change their vote to maximize unity benefits.Footnote 24 Thus, once a proposal is up for a vote, legislators always vote sincerely based on minimizing the Euclidean distance between their own policy ideal point and the two policy alternatives. Prior to that, legislators decide whether to request an RCV conditional on common knowledge over the distribution of ideal points and anticipated sincere voting behavior. Finally, in deciding when to make a policy proposal, leaders maximize their utility over policy outcomes and relative revealed unity payoffs.
We parameterize how much they value the policy outcome compared with demonstrating high relative cohesion by the following equation:
 $$ u\left({I}_i,z\right)=-\alpha \mid \left({I}_i-z\right)\mid +{V}^{\ast }{c}_i, $$
 where  $ \upalpha >0 $. The larger the $ \upalpha $, the more they value getting policy victories over demonstrating relative party unity.
The RCV request incentives are simple and intuitive. To demonstrate this fact, assume party leaders do not care about policy outcomes,  $ \alpha =0 $. If RCVs are costless, $ k=0 $, all votes will be roll-called; because $ u\left({I}_i,b\right)={V}^{\ast }{c}_i(b) $ and $ {c}_i(b)=-{c}_{\neg i}(b) $, either $ u\left({I}_i,b\right)\ge 0\ge u\left({I}_{\neg i},b\right) $ or $ u\left({I}_{\neg i},b\right)\ge 0\ge u\left({I}_i,b\right) $. Intuitively, the unity advantage on any given vote is zero-sum. Members of either the right party or the left party benefit. Sensibly, one of them will always want to call an RCV if there is no downside. Now suppose requests are costly, $ k>0 $. Once this is the case, not all votes will receive a roll call. The unity advantage must be sufficiently large to merit the request. Further, in the resulting sample, the proposing party will always have higher revealed unity than the non-proposing party does because $ u\left({I}_i,b\right)={c}_i(b)-k\ge 0 $ must hold for the proposing party for a proposal to be made. Again, this makes perfect sense. A party that only cares about relative unity is not going to make a proposal that works to its disadvantage.
Based on this model, we can generate results for how any possible motion will be treated. We can characterize whether a proposal will be made, if that proposal will receive a roll call, how legislators will vote, and whether the proposal will pass. We turn to simulations of the analytic model because we are not interested in individual votes so much as aggregate properties compiled across an entire legislative agenda for a wide sample of possible legislatures. The simulation will consist of a set of natural legislatures with fixed membership (between elections). For each legislature, we randomly draw a value for the parameters  $ d\sim \mathrm{U}\left[\mathrm{0.5,2}\right] $ and $ \upphi \sim \mathrm{U}\left[\mathrm{0.2,0.8}\right] $. As mentioned above, these values ensure a wide range of possible legislative chambers can be generated, everything from a chamber with no party overlap to one in which the parties are relatively indistinguishable and from one with a very dominant right party to one with a very dominant left party. Based on these two values, we draw a set of legislators to populate a 100-member chamber. Unless otherwise stated, we set $ \upalpha =0.5 $ and $ k=0.1 $. An $ \upalpha =0.5 $ reduces the weight on policy relative to unity. A $ k=0.1 $ is substantively equivalent to requiring a relative unity edge of at least 10% to merit making an RCV request. On average, these parameter values correspond to natural legislatures in which 28–36% of all votes are taken by roll call.Footnote 25 Given the empirical findings presented in the previous section, this means the simulated samples of roll-call votes are far more complete than those we typically observe in the real world. In the following analyses where $ k\le 0.2 $, the issues we highlight are the lower bounds of the problems that can arise in applied empirical analyses of roll-call votes.
Next, we create a possible legislative agenda for this legislature by drawing 1,000 motions. A motion consists of a status quo location  $ \mathrm{sq}\sim \mathrm{U}\left[0,1\right] $ and possible proposal $ b\sim \mathrm{U}\left[0,1\right] $. As previously mentioned, motions where $ b< sq $ are proposals that the left party leader ( $ {I}_{\ell }=0 $) can choose to make. The rest are proposals the right party leader ( $ {I}_r=1 $) can choose to make. This way of characterizing the legislative process is tantamount to weak agenda control by the proposing party. Each party can avoid making self-defeating proposals, but they cannot control what comes up for consideration. It has the advantage of allowing the stochastic process to capture out-of-model constraints on agenda control by party leadership. It also offers a way of populating potential proposals by the minority party. We take this approach to ensure that the RCV selection process, not agenda control, is driving the findings of our model.Footnote 26
By simulating the roll-call vote selection process, we have the advantage of knowing how individual legislators vote when they are not voting via roll call—something only Hug (Reference Hug2010) has seen in the “real world.” Using these simulations, we conduct standard empirical analyses on the full sample of observed and unobserved votes as well as on the sample of roll call votes. In doing so, we are able to characterize and compare results on our three key quantities of interest: legislator ideal points, cohesion scores, and policy dimensionality. Figure 1 provides three illustrations of the relationship among ideal points estimated using (1) all votes and (2) only those taken by roll call, and compares those with the true policy ideal point locations of the simulated legislators.Footnote 27 The left panel corresponds to a chamber with very infrequent use of roll call votes (8% of total votes), the middle panel to one with moderate use (15%), and the rightmost panel one with extensive use (45%). In each panel, the x-axis measures the location of the true ideal points and the y-axis the location of the estimated ideal points from ideal point estimation models that use either the sample of all votes or only those votes that receive a roll-call request. The filled grey squares and black circles correspond to the ideal point estimates from the full sample compared with the legislators’ true (simulated) ideal points. The open grey squares and black circles correspond to the ideal point estimates from the RCV sample compared with the legislators’ true (simulated) ideal points.
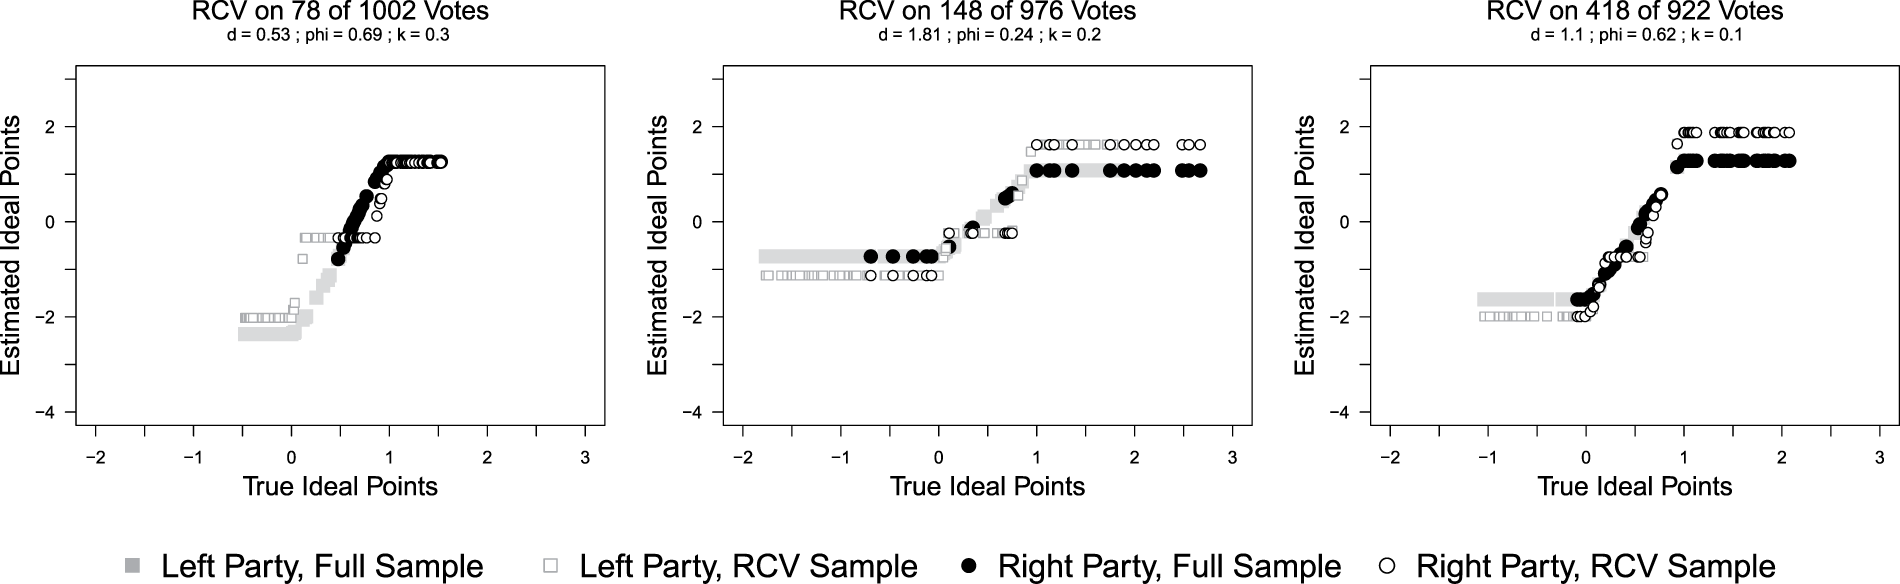
FIGURE 1. Estimates of Ideal Points from Full and RCV Samples
If the estimated ideal points map to the actual ideal points, the rank orders will be preserved: the larger the true ideal point, the larger the estimated ideal point, and therefore the points will be monotonically increasing on the diagonal. As can be seen, with the exception of the ideologically extreme candidates, the ideal point estimation on the full sample of votes is able to recover the rank ordering of legislator ideology quite well. As is standard for these sorts of models, extreme members are difficult to distinguish from one another due to a small number of discriminating votes in the tails of the distribution. The ideal point estimates based just on RCVs fair more poorly. They struggle not only to differentiate extreme legislators but also to discriminate among the more moderate, or interior, legislators: that they lie on a horizontal line indicates that while the true ideal points (x-axis) are different, the estimator (y-axis) does not pick up any variation. While the extent of the problem increases as the RCV sample shrinks, it is present in all three contexts. The key is that legislators choose not to request roll calls on votes that divide moderates because those votes do not yield a sufficient unity advantage on that vote to one party or the other.
To demonstrate the consistency of this pattern across possible natural legislatures, Figure 2 depicts the number of legislators in each natural legislature for which our ideal point estimates would yield the identical minimum ideal point (left panels), the identical median ideal point (middle panels), and the identical maximum ideal point (right panels). Estimates based on the full sample are presented in the top row, and estimates based on just roll calls are presented in the bottom row. In the full sample, identical estimates occur on the ideological extremes, but they are extremely rare in the middle. For this randomly drawn sample of 50 natural legislatures, the largest number of non-extreme legislators receiving identical ideal point estimates is three. Conversely, in the RCV sample a substantial proportion of moderate legislators—in a significant number of cases even the majority—are consistently identified as having identical ideal points.Footnote 28
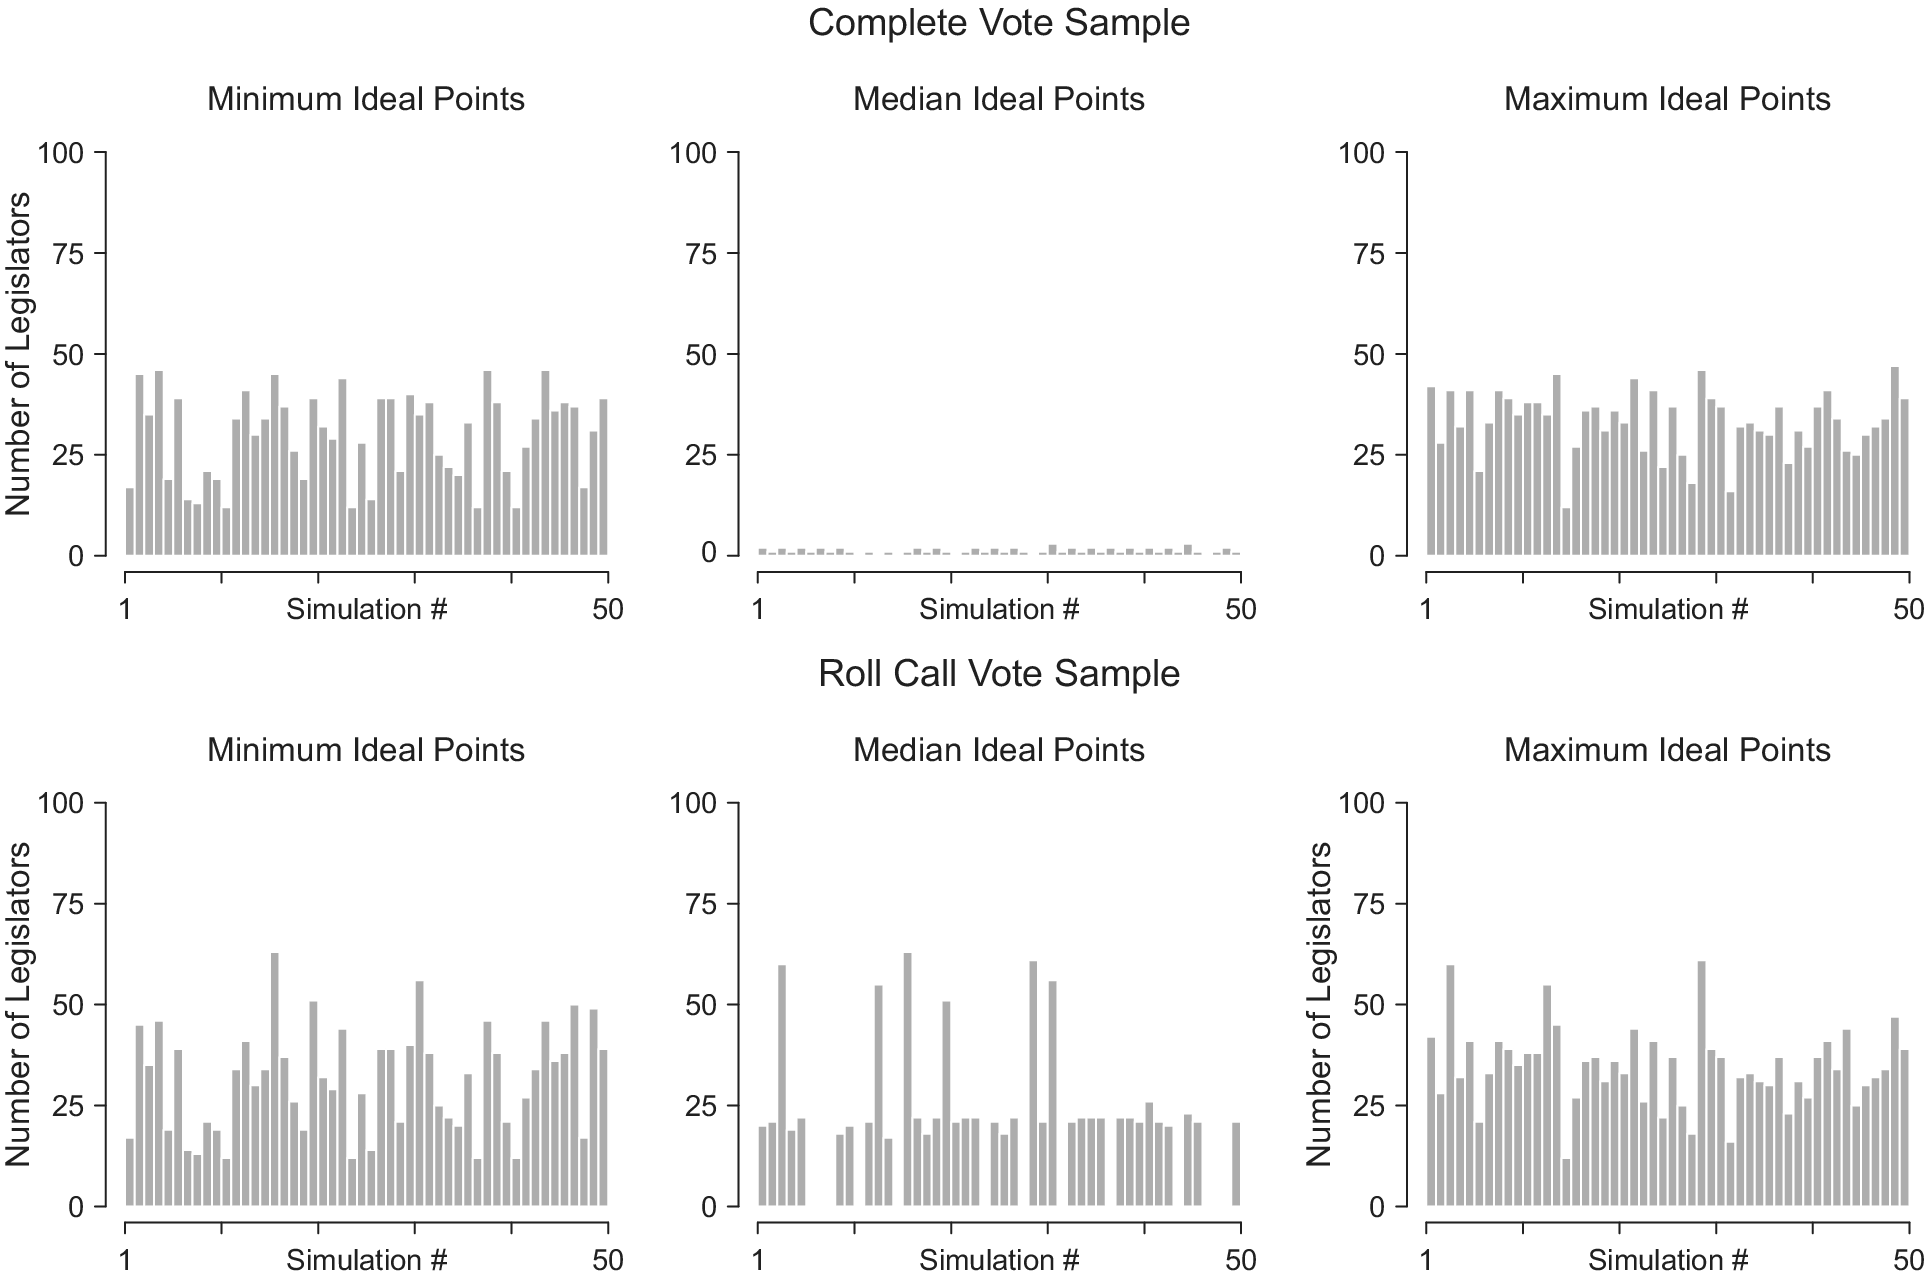
FIGURE 2. Collocated Ideal Point Estimates in Full and RCV Samples
Turning to party unity, in Figures 3a–d we consider how cohesion scores (averaged unity scores across a full legislative agenda) generated from RCVs compare with cohesion scores generated from unobserved votes. The sample is based on 1,000 votes per natural legislature for 50 different natural legislatures. The more consistently that the cohesion scores that are generated from observed roll-call votes reflect the cohesion scores that are based on unobserved votes taken by some other means (e.g., show of hands), the safer it is to assume that a measure of cohesion based on an RCV sample reflects cohesion on all votes. The figures show cohesion scores based on RCVs (dashed lines) and unobserved votes (solid lines) for the left and right parties as potential party heterogeneity, d, and size of the right party,  $ \upphi $, vary. The black solid and dashed lines are for proposals made by the left party and the grey lines are for proposals made by the right party. As can be seen, the proposing party’s cohesion scores based on RCV votes are systematically higher than those that are based on unobserved votes, whereas the opposite is true for the non-proposing party. This result holds across possible values of potential party heterogeneity and majority party size. The logic behind the result is based on the intuition discussed previously. The proposing party will favor moving forward on votes that benefit them, where the benefit is based in part on their relative unity on the vote if they anticipate the vote being roll-called. Thus, we should expect the proposing party to look more unified on roll calls than they do on unobserved votes and the non-proposing party to look worse on RCVs than on unobserved votes. The result is that we cannot assume that cohesion scores generated from RCVs generalize to cohesion scores based on what in the“real world” would be unobserved votes.
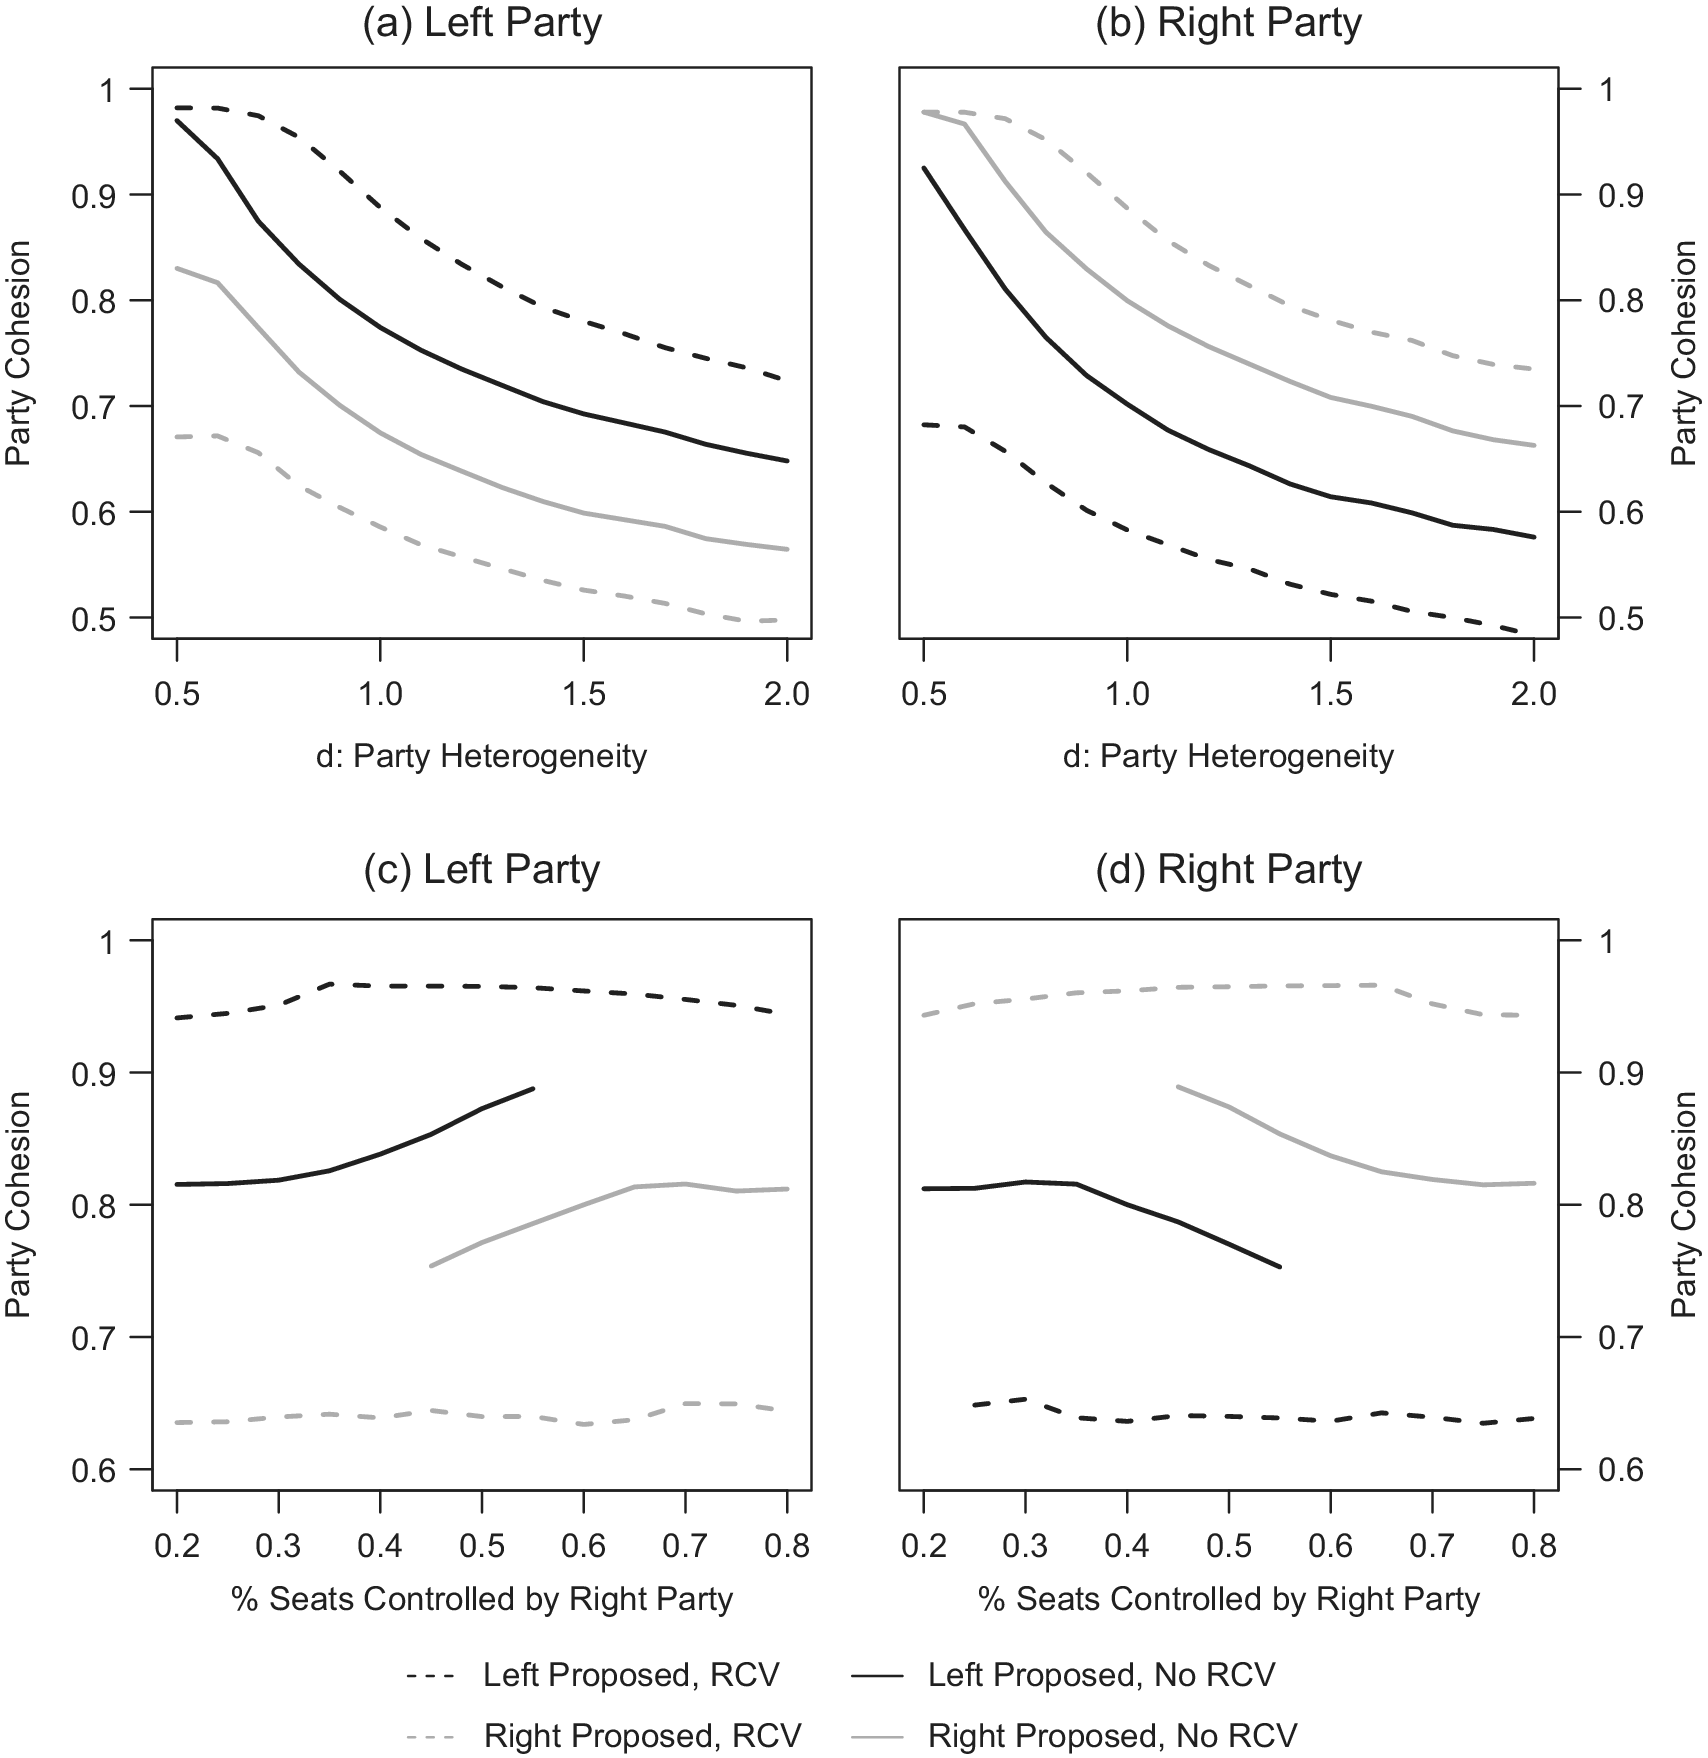
FIGURE 3. Party Cohesion in Full and RCV Samples
Of course, one might suppose that these systematic differences wash out in aggregate (Carey Reference Carey2009, 48; Poole and Rosenthal Reference Poole and Rosenthal2007). Because of varied agendas and types of votes, on average the RCV cohesion scores derived from a legislative session should accurately map to the non-RCV cohesion scores for that same session. Figure 4 addresses this claim. We simulate 50 randomly drawn natural legislatures and take the difference between the cohesion score based on the unobserved sample and the RCV vote sample. We assume the cost of requesting a roll call vote is relatively low ( $ k=0.2 $), creating legislative dockets with an average of 479 total votes of which 32% are taken via roll call. Figure 4 shows the distribution of these differences across natural legislatures where positive (negative) values here correspond to parties being on average more (less) cohesive in the unobserved sample. As the density plot demonstrates, the distribution of differences by natural legislature is frequently quite substantial. The average absolute difference for both parties is $ 8.2\% $, meaning by looking at roll-call votes alone we would expect on average 8 more/fewer per 100 to vote with their party than actually do in the full sample of votes. In 39% of the simulated natural legislatures, the difference between RCV and non-RCV cohesion scores is at least 10% for one of the two parties. Critically, cohesion is not being systematically over- or underestimated. For approximately half of the time, the RCVs are overestimating cohesion, and for half of the time they are underestimating cohesion. For this sample of simulated legislatures, the cohesion we observe is greater than that which we do not observe for 60% of the legislatures. Thus, the only thing we are confident of is that they are frequently unrepresentative.Footnote 29 Critically, this problem emerges here for a set of natural legislatures where a relatively high percentage of votes (32%) are taken via roll call. In Online Appendix E.3.3, we replicate this simulation for a set of natural legislatures in which only 14.5% of total votes are taken via roll call and show that the difference in cohesion for observed and unobserved votes exceeds 10% for over half of the sample. Simply put, one cannot assume that in any given natural legislature RCV cohesion scores will be representative of non-RCV cohesion scores.
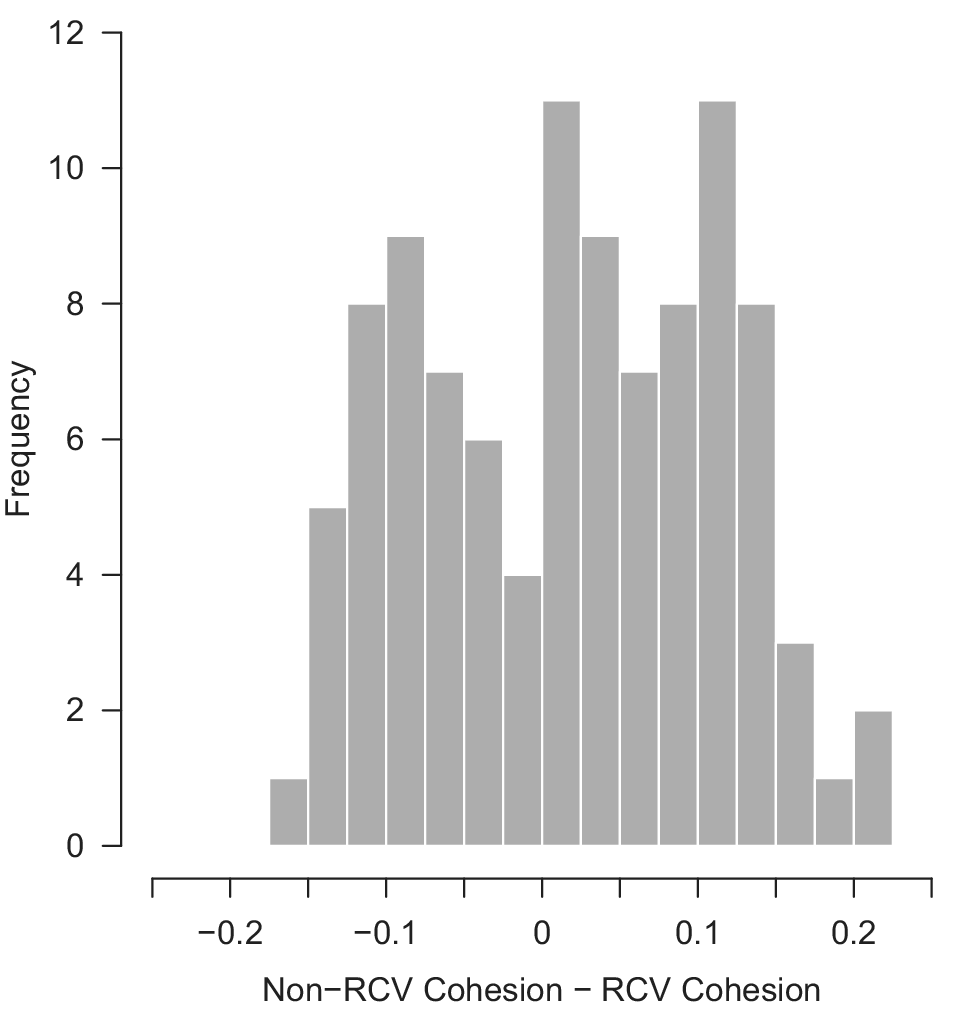
FIGURE 4. Difference in Party Cohesion on Unobserved (Non-RCV) and Observed (RCV) Votes
Finally, to examine the effect of the roll-call vote sample on the ability to discern the dimensionality of legislative preferences, we can compare the results of ideal point estimation models on the full simulated sample of votes with those on the sample of only votes where an RCV was invoked. For this analysis, we generate natural legislatures with two distinct policy dimensions, meaning each legislator has an ideal policy position in each dimension. Further, we allow the degree of party heterogeneity (d) to vary across policy dimensions. While party heterogeneity within the first and second policy dimensions ( $ {d}_1 $ and $ {d}_2 $) is constant across parties, we assume the degrees of heterogeneity are random draws from the uniform distribution: $ {d}_k\sim \mathrm{U}\left[\mathrm{0.5,2}\right] $ for $ k\in \left\{1,2\right\} $. Thus, legislators’ ideal points on each dimension remain centered around their party leader’s ideal point $ {I}_i $, but they are randomly drawn from the distributions $ {x}_{ijk}\sim \left[{I}_i-{d}_k,{I}_i+{d}_k\right] $, where $ i\in \left\{\ell, r\right\} $ indicates legislator j’s party affiliation and $ k\in \left\{1,2\right\} $ indicates the policy dimension. For each natural legislature, we generate 500 motions per dimension. We set $ k=0.35 $ and $ \upalpha =0.5 $, which for our sample will induce an average of 547 total votes and 62 roll-call votes (i.e., approximately 11% of the sample will be roll-called on average) for each natural legislature.Footnote 30
The central result from this exercise is illustrated in the pair of scree plots in Figure 5. For each of the 25 simulated natural legislatures, Poole and Rosenthal W-Nominate scores are estimated for the  $ n=100 $ legislators, once using the full sample of votes and once using just the subsample of votes strategically selected to be done by RCV.Footnote 31 Thus, we estimate two models for each of the 25 natural legislatures. To examine whether the sample of RCVs is able to recognize the two dimensions of policy preferences as well as the full sample of votes does, we can compare the eigenvalues across the two samples. Two metrics have been traditionally employed for evaluating the number of dimensions based on these eigenvalues.Footnote 32 The first approach is to include only the number of dimensions prior to (i.e., to the left of) where we observe an “elbow” (Cattell Reference Cattell1966; Poole Reference Poole2014). As can be seen in Figure 5a for the sample of all votes, there is a clear elbow and consistent leveling off of eigenvalues at the third dimension, indicating that the model is accurately picking up on the two-dimensional policy space of the simulated data in all but one of the 25 natural legislatures. The alternative approach proposed by Kaiser (Reference Kaiser1960) uses an “eigenvalue-greater-than-one” rule. Following this heuristic would lead us to correctly infer the existence of a two-dimensional policy space in each of the 25 natural legislatures using the full sample of votes.
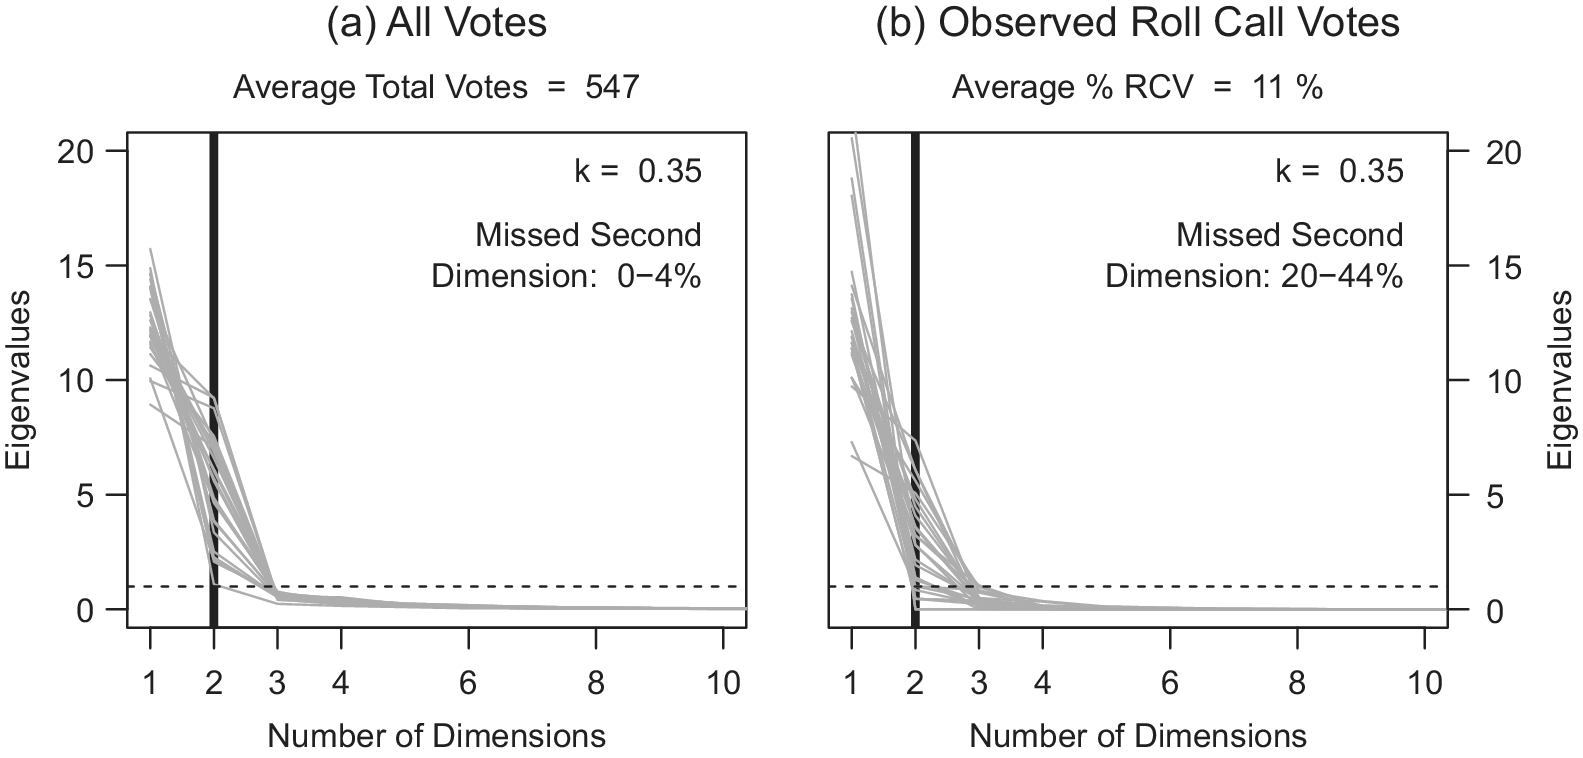
FIGURE 5. Recovering Multiple Preference Dimensions with Full and RCV Samples
Figure 5b presents the same information for the RCV subsample. As can be seen, this subsample less consistently identifies a second dimension. Using the “elbow” criteria, the second dimension would be missed in 10 of the 25 (or 40% of the) natural legislatures, as compared with only one of the 25 (4%) with the full sample of votes. Using the eigenvalue-greater-than-one criteria, 20% of the natural legislatures—or five of the 25—would miss the second dimension.Footnote 33 This second approach appears to be a lower bound, given the concentration of values just above one and the substantial leveling out of the eigenvalues that occurs after for an additional five of the simulated natural legislatures. Note that losing the second dimension does not mean that we are not observing votes on motions on the second dimension. In this simulation, we observe a nearly even split of motions and votes on each dimension in the full sample. Of the, on average, 547 total motions in each natural legislature, an average of 243 votes (50%) are from the first dimension and 243 votes (50%) are from the second dimension. If we assign as the first dimension the one on which parties are more heterogeneous (i.e.,  $ {d}_1>{d}_2 $), there is nothing systematic to suggest that party leaders propose more frequently on one dimension versus the other. However, this same roughly equal distribution of motions across dimensions is not preserved for the subsample of votes receiving a roll-call request. In the roll-call vote sample, only 42% of all roll-called votes come from motions on the first (more heterogeneous) policy dimension.
This suggests one possible reason RCVs can cover a variety of substantive topics and yet common methods only estimate one to two dimensions. Legislators are not requesting roll-call votes on the votes that would allow our estimation strategies to tease out the existence of the second dimension. That is, the votes that remain unobserved are the ones that distinguish the ordering of the ideal points in the second dimension from that of the first.
Connecting the Model to the Empirics
All of this analysis suggests strong reason for caution over using RCV samples to draw general conclusions about legislative behavior and conflict. However, one could reasonably question to what degree it speaks to actual legislatures we observe in the world. In fact, we have designed the simulations to not only map closely to our empirical referents but also to be somewhat generous compared to the true data.
For our ideal point estimation results we choose values for the cost of requesting votes, k, and the relative importance of policy outcomes,  $ \upalpha $, to ensure that our simulation spans a wide range of actual prevalence. While increasing prevalence does improve the estimation properties with respect to ideal points, at no point is prevalence high enough to eliminate the concern. Increasing prevalence of roll-call votes to 64%—just 2% shy of the maximum prevalence of roll-call votes we observe empirically for Switzerland—results in 10.3% of ideal points being collocated at the median (i.e., we cannot discriminate among them). This number is clearly an improvement, but it is still substantially higher than the, on average, 2.8% that are collocated at the median when estimated using all votes. Similarly, when we increase the prevalence of roll-call votes to 65%, our estimates of cohesion from the roll-call vote sample would differ from the unobserved sample by $ \pm $5% for 41% of natural legislatures and $ \pm $10% for 4% of natural legislatures.Footnote 34 While this is a nontrivial improvement on what we observed in Figure 4, the issue we highlight about inferring cohesion on unobserved behavior from only observed voting behavior remains. The dimensionality estimates improve most quickly with increased prevalence. Once the roll-call vote sample reaches 25% of all votes, estimations based on full and RCV samples start to converge. Models based on the RCV sample correctly identify the second policy dimension for between 80% and 96% of all natural legislatures, whereas the models based on the full sample do so for 96% of natural legislatures.Footnote 35 This constitutes a dramatic improvement for those few legislatures in our sample that reach this threshold of prevalence.
On a final, related note, the results of the simulations also speak back to a central point made in the empirical analysis emphasizing the importance of RCV prevalence rather than absolute number. Our simulations reinforce this point. What matters for the estimates at hand is the percentage of total votes taken by roll call, not the size of the RCV sample itself. Holding the prevalence of roll call votes roughly constant at an average of around 10% of the total votes, we show in Figure 6 that increasing the quantity of roll-call votes (x-axis) does not improve our ability to (1) discern among the ideology of moderate legislators (the solid black line indicates the number of additional legislators collocated at the median in the RCV sample compared with the full sample of votes); (2) draw inferences about cohesion in observed votes (the grey line corresponds to the percentage difference in cohesion between the observed and unobserved sample of votes); and (3) correctly identify policy dimensions (the dashed line reflects the percentage of natural legislatures in which RCV samples would lead us to miss the second policy dimension). For each of these quantities, if the lines converged on zero as the sample size increased, it would indicate that, all else being equal, increasing the sample of RCVs is a viable solution to these issues. However, this is clearly not the pattern we observe.
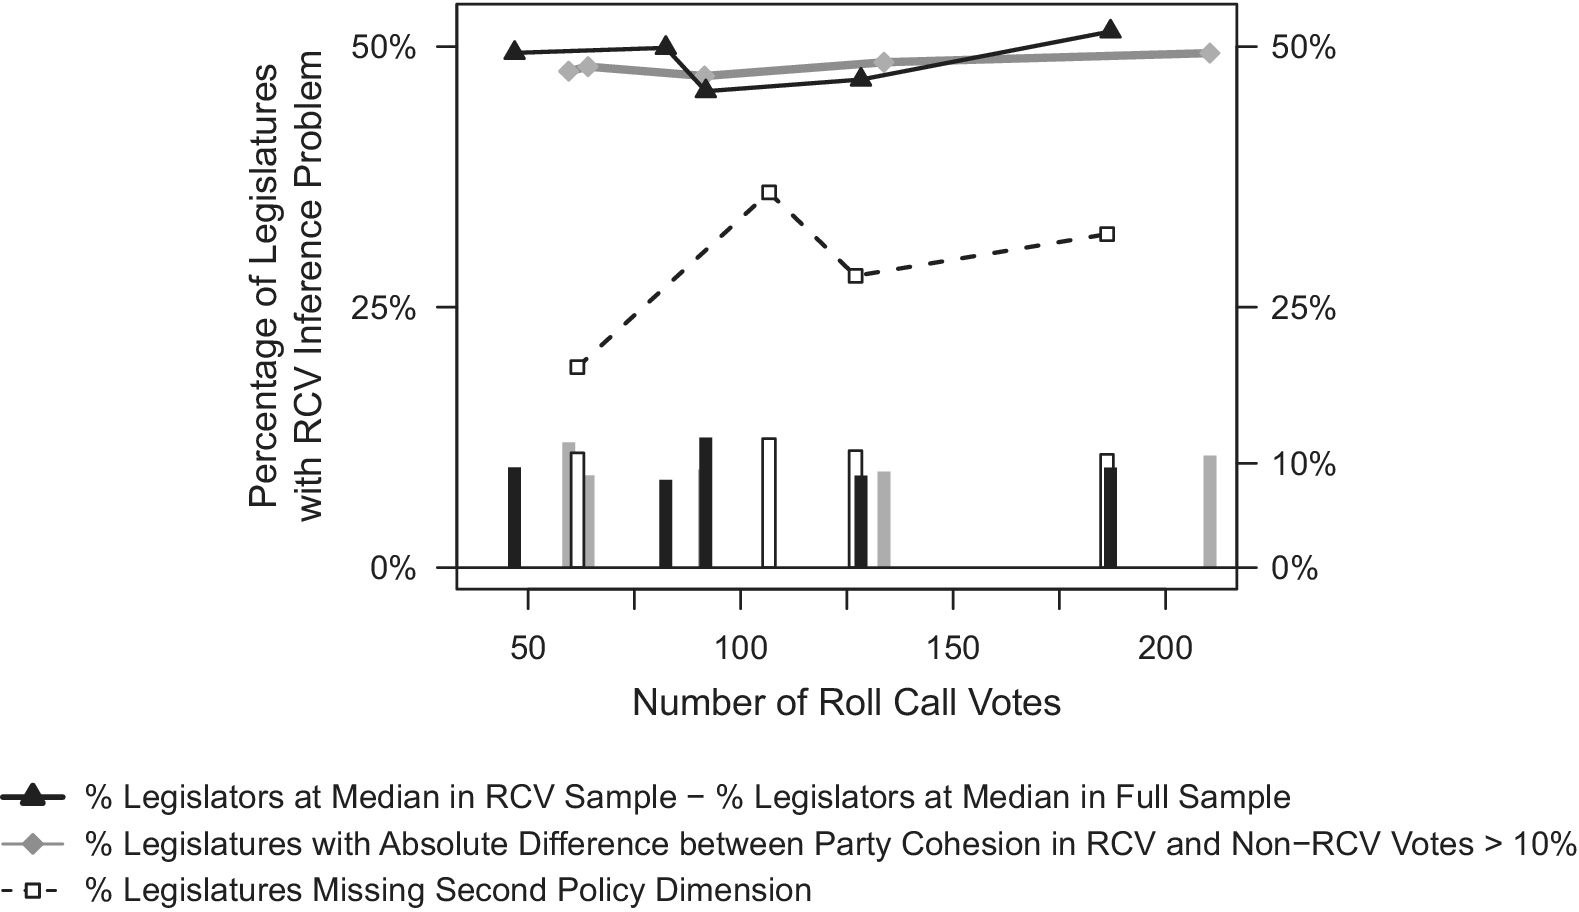
FIGURE 6. Effects of Increasing the Number of Roll-call Votes
Conclusion
Though roll-call vote data is central to much of the current empirical research being done in legislative studies, relatively little attention has been given to empirically or theoretically understanding the data-generating process. To help fill this void, first, we provided a systematic cross-national cataloging of voting rules from national legislatures. This demonstrated the breadth of the sample-bias issues that might possibly confront scholars of legislative studies around the world. We showed that SOPs for voting—and the rules for setting aside those procedures for an alternative one—vary widely. Moreover, we found that there is no simple relationship between the endogenous rules for selecting a vote method and the relative frequency with which roll-call procedures are employed (RCV prevalence). Further, both our empirical and theoretical analyses indicate that the resulting vote samples are likely unrepresentative of general legislative voting. The potential bias is particularly problematic in the legislatures that receive the most scholarly attention. Nearly 80% of articles that are written about legislative politics focus on cases where RCVs are not the SOP.
We also provide a rigorous theoretical treatment of the position-taking explanation for roll-call selection. In this modeling exercise we examined what happens to three key quantities of interest—individual legislators’ ideal points, party cohesion, and policy dimensionality—if RCV requests are made based on an incentive to highlight voting behavior on particular motions. Critically, we make the selection process as benign as possible. We minimize party agenda-setting powers, we require only a single legislative member to invoke an RCV, and we do not allow for strategic voting based on the decision to request a roll call. Using a set of extensive simulations, we demonstrate the limits of using RCV samples for these estimates. We show that this sample will struggle to differentiate among moderate members of the legislature, that cohesion scores based on RCV samples will not replicate ones based on unobserved votes (and the differences will both be large and in an unpredictable direction), and RCV samples will be biased towards missing higher levels of dimensionality. All of these results arise from a simple strategic incentive. Party members (and leaders) have an incentive to request RCVs when their party is going to have a noticeably higher level of unity than the opposition. These findings hold for RCV samples that map closely to the prevalence of RCVs found empirically in the sample identified in Table 1. Thus, the results are not simply speculative. They map to real world conditions.
This paper highlights the importance of understanding the rules governing how a roll-call vote can be invoked and the effects that those rules have on the voting record. One of the most prominent areas of research in legislative institutions has focused on understanding how formal institutions affect legislative outcomes. Scholars have examined how organizational structure (e.g., committee systems) and specific procedural rules—even some quite obscure ones—offer strategic opportunities to shape the character and final disposition of legislative proposals. Our study identifies a largely overlooked procedural rule that could have a significant influence on how we understand legislative politics. Because legislators may change their votes depending on whether the results are public, the selection of votes for roll call can have powerful effects on outcomes.Footnote 36 The study of the design and use of legislative voting procedures offers fruitful avenues for future research on legislative institutions.
Supplementary Materials
To view supplementary material for this article, please visit http://dx.doi.org/10.1017/S0003055420000192.
Replication materials can be found on Dataverse at: https://doi.org/10.7910/DVN/XI7ENB.


 Open access