Local newspapers are in decline in the US, with falling readership and decreasing levels of newsroom personnel (Hayes and Lawless Reference Hayes and Lawless2017; Peterson Reference Peterson2017; Pew Research Center 2016). Given the importance of news coverage in driving citizen engagement in politics and in allowing citizens to hold their elected officials accountable (Hayes and Lawless Reference Hayes and Lawless2015; Hopkins and Pettingill Reference Hopkins and Pettingill2015; Shaker Reference Shaker2014; Snyder and Strömberg Reference Snyder and Strömberg2010), this trend is worrisome. Economic changes in the production of news and greater national competition in the news market could potentially be imposing negative externalities on the quality of local political information available to citizens and consequently on the performance of local governments.
On the other hand, it is also possible that declines in local coverage are primarily demand- rather than supply-driven. In an age of increasing nationalization of elections (Abramowitz and Webster Reference Abramowitz and Webster2016; Hopkins Reference Hopkins2018; Jacobson Reference Jacobson2015), dedicated coverage of local politics may no longer be as valuable to citizens as it once was. The more closely do local elected officials’ positions align with those of their national party, the more does information about national party leaders suffice for most readers’ purposes and the less incremental value is there in coverage of local figures. The long-term decline in local coverage may thus simply reflect adaptation by the news industry as a whole to changes in audience tastes for political information (e.g., Mullainathan and Shleifer Reference Mullainathan and Shleifer2005).
Changes in news distribution technologies may be accelerating the influence of such demand-side shifts. The modern news environment, characterized by a proliferation of choices available to news consumers through broadband internet and cable television (Arceneaux and Johnson Reference Arceneaux and Johnson2013; Hindman Reference Hindman2009), plausibly expands the role of consumer demand in determining news content relative to the late-twentieth century period of dominance by print newspapers and broadcast TV. Whereas a 1970s news reader unhappy with her city paper’s local focus and seeking more national coverage would have had limited and relatively high-cost alternatives, today’s news reader can easily access a wide variety of national sources for low or no cost.
This greater opportunity for news consumers to choose their favored sources that modern news media affords has led to a second kind of concern: that proliferation of media choice will lead to increased ideological or partisan polarization of content (Lelkes, Sood, and Iyengar Reference Lelkes, Sood and Iyengar2017; Prior Reference Prior2007). Evidence from cable news shows that the cable news channels’ content has in fact polarized over the past decade and a half (Martin and Yurukoglu Reference Martin and Yurukoglu2017). The emergence of highly partisan misinformation or “fake news” on social media in the 2016 presidential election (Allcott and Gentzkow Reference Allcott and Gentzkow2017; Guess, Nyhan, and Reifler Reference Guess, Nyhan and Reifler2018) demonstrates that a more extreme version of the same phenomenon is present in online news as well.
In this paper, we present evidence on the underlying cause of these trends toward the nationalization and polarization of politics coverage, using an extensive data set of local television news broadcasts. Local TV news has large audiences, with viewership on the order of 25 million viewers per night in the aggregate (Pew Research Center 2017).Footnote 1 We analyze the content and viewership of 743 local news stations over the latter two-thirds of 2017, a period that saw the acquisition of a set of local television stations by a large conglomerate owner, the Sinclair Broadcast Group.
We measure news program content using a topic model fit to more than 7.4 million transcript segments from this period. Using a differences-in-differences design that compares the Sinclair-acquired stations with other stations operating in the same markets, we find that the acquisition led to a roughly three percentage point increase in the share of programming devoted to coverage of national politics, a roughly 25% increase relative to the average level in the sample. Furthermore, this increase came largely at the expense of coverage of local politics. We also find that text-based measures of ideological slant (Gentzkow and Shapiro Reference Gentzkow and Shapiro2010) shifted to the right at Sinclair-acquired stations following the acquisition, relative to other stations in the same market.Footnote 2 The magnitude of the ideological shift induced following the Sinclair acquisition is equivalent to approximately one standard deviation of the cross-station ideological distribution.
Using the same differences-in-differences design, we also measure the change in viewership attributable to the change in ownership. Consistent with a supply-driven story, the differences-in-differences estimate of short-term viewership changes at the Sinclair-acquired stations is negative, though small enough to be statistically indistinguishable from zero. The shifts toward more right leaning slant and more national politics coverage do not appear to have gained these stations additional viewers. If anything, viewers prefer the more locally focused and ideologically neutral coverage to the more nationally focused and ideologically conservative coverage: The existing Sinclair stations acquired prior to 2017 see significantly lower viewership for their news broadcasts compared with other stations operating in the same market, paying a ratings penalty of about one percentage point. Nonetheless, there are very clear economies of scale for a conglomerate owner in covering national as opposed to local politics, thanks to the ability to distribute the same content in multiple markets.Footnote 3 Given that the ratings penalty we document is fairly small, it seems likely that these cost efficiencies dominate in Sinclair’s calculus. This finding is in contrast to demand-side explanations for changes in news content, which predict that news outlets cater their content to viewers’ preferences (Hamilton Reference Hamilton2004; Mullainathan and Shleifer Reference Mullainathan and Shleifer2005).
These results are a flip side of the coin to George and Waldfogel’s (Reference George and Waldfogel2006) finding that the entry of a national competitor (the New York Times) into local newspaper markets led local incumbent papers to focus more on their comparative advantage in local coverage, and Gentzkow, Shapiro, and Sinkinson’s (Reference Gentzkow, Shapiro and Sinkinson2014) finding that greater newspaper competition is associated with greater ideological diversity. Acquisition of the existing local outlets by a national conglomerate produces the opposite impact on coverage relative to entry by a new, separately owned national outlet. A conglomerate owner can reduce production costs, perhaps dramatically, by substituting nationally focused and ideologically unified content produced in a single studio for locally focused and ideologically diverse content produced by many local journalists. Even if viewers would prefer locally tailored politics content, the fact that politics coverage is bundled with other kinds of content—crime reporting, weather, sports, and so on—that are less affected by consolidation mutes the demand response.
Taken together, our results contribute to the growing literature showing that supply-side forces in the market for news have real consequences both for the political content of news (such as the coverage of campaigns, candidates, and salient issues; Branton and Dunaway Reference Branton and Dunaway2009; Dunaway and Lawrence Reference Dunaway and Lawrence2015) and on downstream election outcomes (Archer and Clinton Reference Archer and Clinton2018; Dunaway Reference Dunaway2008; Durante and Knight Reference Durante and Knight2012). Media consolidation can produce cost efficiencies in the production of news, but these efficiencies are not neutral with respect to the content of news coverage. Consolidation changes the incentives of news providers, shifting coverage toward the topics that can be distributed in multiple markets rather than those—such as local politics—that are market-specific. Consolidation among conglomerate owners is also correlated with changes in editorial decisions, where the newly consolidated outlets are more likely to produce the content that favors the political and financial interests of their owners (Bailard Reference Bailard2016; Gilens and Hertzman Reference Gilens and Hertzman2000). These content changes influence viewers’ available information about local elections and elected officials, along with the ideological slant of news to which they are exposed. As existing research (DellaVigna and Kaplan Reference DellaVigna and Kaplan2007; Snyder and Strömberg Reference Snyder and Strömberg2010) has shown, both dimensions of content are consequential for the accountability and preference aggregation functions of elections.
DATA AND INSTITUTIONAL BACKGROUND
This paper exploits the recent changes in ownership of broadcast television networks as a driver of variation in the content covered by the stations that changed ownership.Footnote 4 Specifically, we compare the stations acquired by the Sinclair Broadcast Group with other stations within the same designated market area (DMA). Sinclair is of particular interest for two reasons. First, anecdotal evidence suggests the company’s political orientation leans to the right, with politics coverage frequently compared with that of the Fox News Channel (Farhi Reference Farhi2017).Footnote 5 This right-leaning coverage is delivered across all Sinclair stations through the “must-run” segments, which have clearly identifiable partisan messaging. Many recent “must-run” segments feature Boris Epshteyn, a former Trump White House official.Footnote 6
Press accounts suggest a reason to believe that Sinclair ownership may have real effects on the content of coverage. Upon taking ownership of a station, Sinclair mandates that some of its larger stations produce their own partisan content—resulting in the resignation of some experienced local news anchors—and quickly replaces management with personnel more friendly to its business practices (Farhi Reference Farhi2014). As many reporters and staff vocalize their discontent with the change in news content and procedures (Stetler Reference Stetler2018), Sinclair also restructures their employment contracts making it more difficult and costly for employees to leave (Maxwell Reference Maxwell2018).
Second, Sinclair is in the midst of acquiring a substantial number of new stations across the country. In the middle of the time period covered by our data (June–December 2017), Sinclair purchased the Bonten Media Group’s stations. This purchase, completed on September 1, 2017, added 14 new stations to Sinclair’s portfolio in 10 markets, though not all stations broadcast local news—10 of these stations in seven markets have their own news broadcast. Sinclair currently owns 193 stations in 89 DMAs, acquired through a steady process of expansion that began in the 1980s (see Figure 1 for geographic coverage). If a proposed purchase of Tribune Media is completed, Sinclair’s portfolio will grow to 233 stations in over 100 DMAs, meaning a Sinclair-owned station will be viewable in 72% of American households.Footnote 7 Through the elimination of the “main studio rule,”Footnote 8 the FCC has paved the way for Sinclair’s expansion by eliminating the need for Sinclair to maintain physical studios within each station’s locality, making growth more economical for Sinclair.
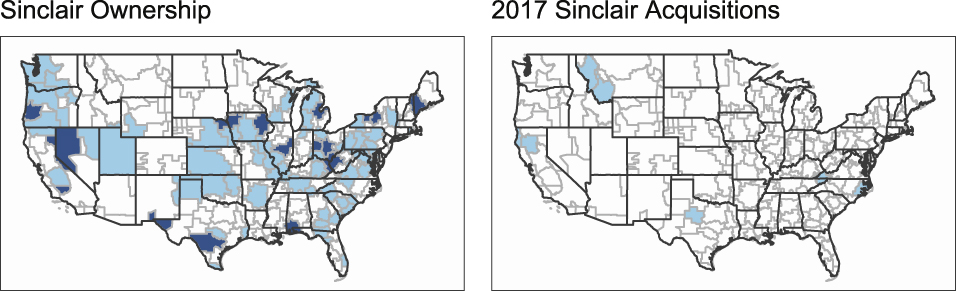
FIGURE 1. Map of Sinclair Ownership by DMA
The plot on the left shows DMAs pre-2017 in which Sinclair owns 1 (light color) or 2 (dark color) stations. The plot on the right shows DMAs in which Sinclair acquired a station in 2017. The light gray borders outline distinct DMAs.
BROADCAST TRANSCRIPTS AND VIEWERSHIP DATA
To measure the effect of a change in ownership on the content of local news broadcasts, we collect data on 743 stations in every DMA throughout the country. Our analyses employ transcript and viewership data, which come from the data vendor TVEyes and cover March (for viewership) or June (for transcripts) to December of 2017. We collect the viewership data and full transcripts from every weekday news broadcast in each station throughout this time period.Footnote 9 The resulting data set has 7.41 million 2.5 minute segments, which we then process and input to a latent Dirichlet allocation (LDA) topic model, producing 15 distinct topics.Footnote 10 Finally, we collected a variety of demographic data from the US census aggregated to the DMA level and matched to each station based on the DMA that contains the station. Summary statistics are displayed in Table 1.
TABLE 1. Station Summary Statistics
Timeblocks refers to 30-minute periods. Shows are differentiated by the title of the program broadcast during a 30-minute timeblock.
Figure A.3 in the Appendix displays aggregate trends in the 15 topics uncovered by the topic model over the time period of the data. Local and national politics have both remained relatively stable, with the latter seeing a slight decrease on average. The largest change in relative coverage of a topic is due to the strong hurricane season that affected the United States around September 2017; the “disasters” topic, which contains words such as “hurricane,” “Irma,” and “Harvey,” saw a spike around this time and then declined as hurricane season ended.
Our analysis focuses on the topics clearly associated with coverage of politics. Figure A.1 in Appendix B shows word clouds of the most indicative words for each of these topics, as well as the “weather” and “crime” topics for comparison purposes. There are five total topics which we identify as politics-related: three national politics topics (one that focuses on domestic policy, one focused on foreign policy, and one we label “Trump scandals”) and two local politics topics (one focused on schools and education and the other on local government, particularly local infrastructure projects). We group the three national and two local topics together for purposes of the analysis.
Figures 2(b) and 2(c) depict monthly trends in the composite local and national politics topics, disaggregated by station ownership. This figure shows that seasonal trends in coverage over this period are similar between Sinclair and non-Sinclair stations. Sinclair-owned stations consistently spend more time on average on national politics and less on local politics. Figures 3(a) and 3(b) zoom in to show daily trends in local and national politics coverage, respectively, among only those stations in DMAs in which Sinclair acquired a station in 2017. We plot daily averages of each variable, disaggregated by ownership, for stations located in one of the former Bonten Group markets. These plots are a visual analogue to the difference-in-differences results in the next section and provide further evidence that trends in coverage are parallel for stations in this set of markets up to the time of acquisition of a station by Sinclair, when they begin to diverge.
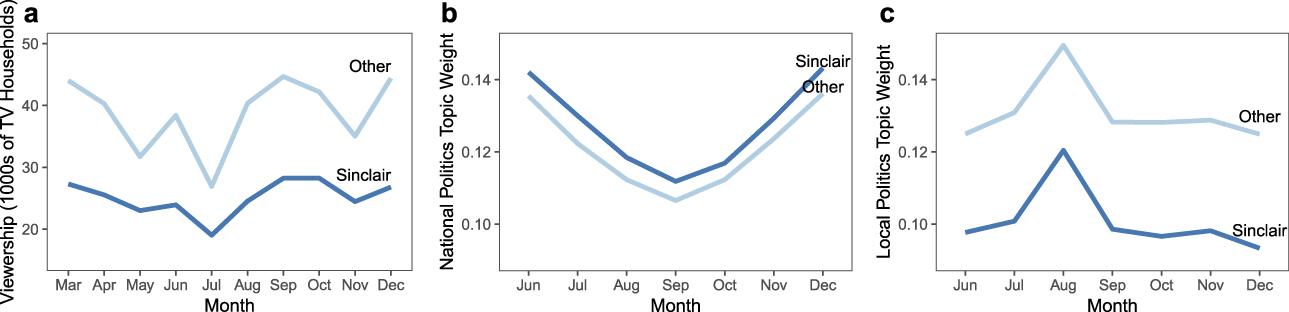
FIGURE 2. National-Average Trends in Local News Viewership (a), National Politics Topics Weight (b), and Local Politics Topics Weight (c) Around the Time of Sinclair’s Acquitision of Bonten in September 2017
Line are monthly averages among all Sinclair-owned stations (darker lines) and all non-Sinclair owned stations (lighter lines) across the United States.
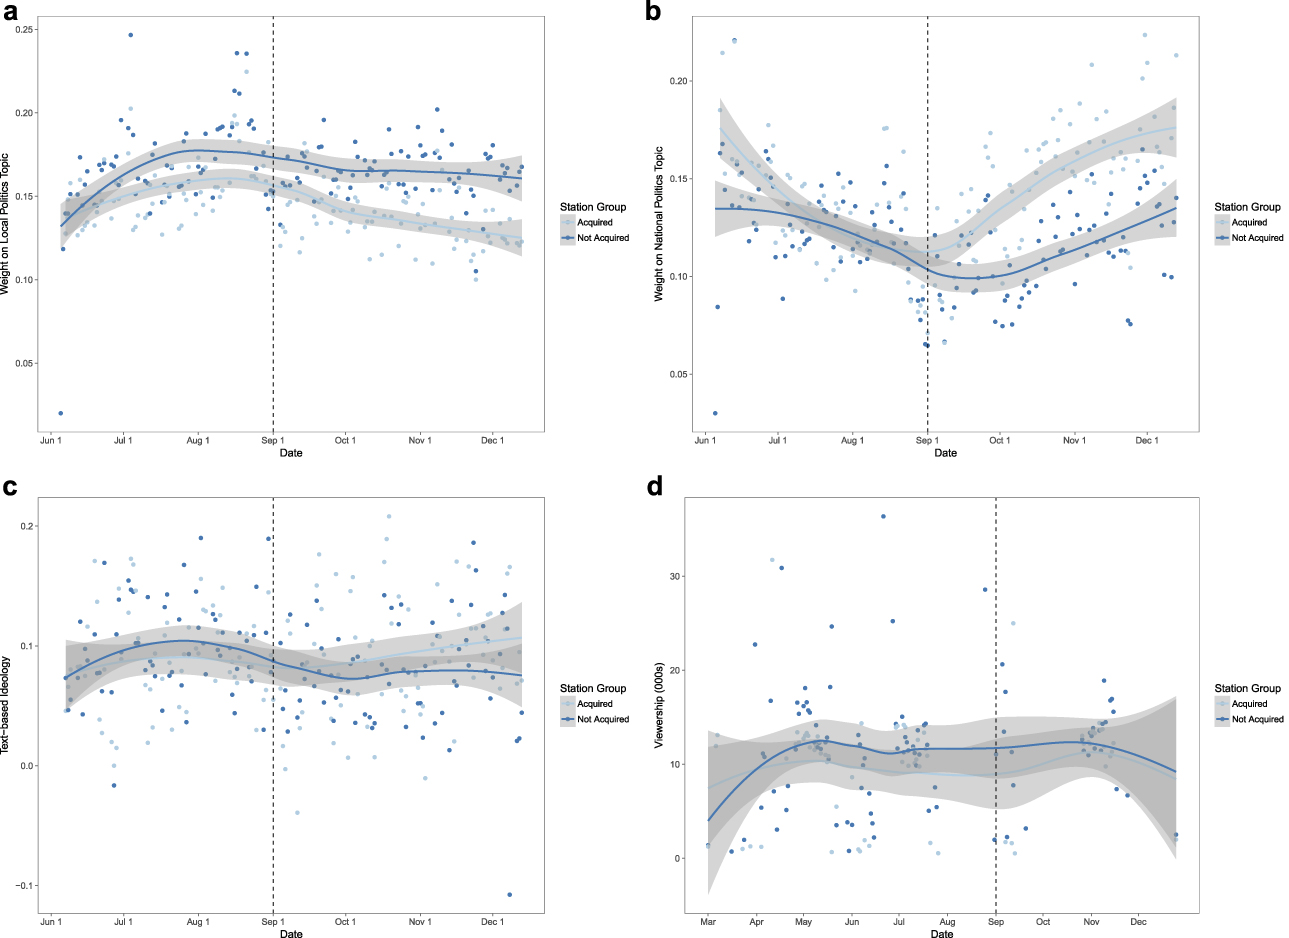
FIGURE 3. Trends in (a) Local and (b) National Politics Coverage; (c) Ideological Slant; and (d) Viewership in Markets Affected by a New Sinclair Acquisition
Figures include only stations located in a DMA in which Sinclair acquired a station in 2017–the former Bonten Group markets. Points are daily average values across stations in the indicated group; lines are a locally weighted regression smoother. Darker lines/dots indicate stations acquired by Sinclair; lighter lines/dots indicate other stations in the same markets that were not acquired. The date of acquisition is noted by the vertical dashed line.
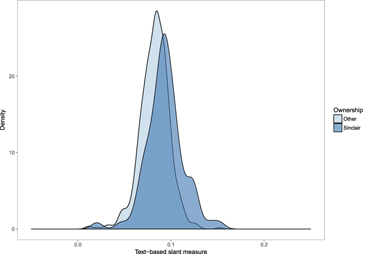
For segments that discuss the national politics topics, we construct a text-based measure of left–right slant based on an extension of the method of Gentzkow and Shapiro (Reference Gentzkow and Shapiro2010). The approach is described in detail in Appendix C, but the basic idea is to compare language use in news outlets to language use by members of Congress in the Congressional Record (CR). The method produces an estimated ideology for every segment that is a function of its frequency of use of phrases that are indicative of partisanship in the CR. Because these phrases are fairly uncommon on local news and the resulting estimates can be noisy, we (1) limit to segments that have at least 50% estimated weight on the national politics topics from the topic model and (2) aggregate to the level of station-day. To assess the robustness of this slant measure, we also constructed a similar measure that compares the language used by local outlets to the language used by cable news networks and scales the local station based on its similarity to MSNBC or Fox News.Footnote 11 Results using this cable news scaling measure are very similar to those presented here using the Congressional Record scaling; details of the approach and analogous results are provided in Appendix E.
Figure 4 shows the density of the resulting slant estimates across stations. There is some dispersion across stations in the measure, with standard deviation equal to about 0.02.Footnote 12 Sinclair’s portfolio of stations is, unsurprisingly given the anecdotal reports, shifted to the right relative to non-Sinclair stations; the mean difference is about 0.012. Figure 3(c) shows the over-time change in this measure for stations in one of the Bonten Group DMAs; again, trends are close to parallel for acquired and non-acquired stations until the time of the acquisition, when the Sinclair acquisitions move rightwards.

FIGURE 4. The Density of Estimated Text-Based Slant, Aggregated to the Station Level
The lighter-shaded density is non-Sinclair stations; the darker-shaded density is Sinclair-owned stations.
We also examine viewership before and after the acquisition in Sinclair-acquired and non-Sinclair-acquired stations. Viewership comes from Nielsen Media Research and is estimated using Nielsen’s panel of households.Footnote 13 Figure 2(a) demonstrates that Sinclair and non-Sinclair stations across the country have similar seasonal trends in viewership, with Sinclair stations having on average somewhat lower viewership numbers.Footnote 14 Figure 3(d) shows, analogously to the plots of the coverage measures, daily viewership among acquired and non-acquired stations within the former Bonten Group markets.Footnote 15
Finally, Table 2 shows the results from regressions of DMA-level demographic characteristics on Sinclair ownership (both pre- and post-2017). The general pattern is that Sinclair’s portfolio of stations skews toward smaller, more racially homogeneous localities with lower average incomes.Footnote 16 Interestingly, Sinclair’s stations are not located in markets with higher Republican vote share in the 2016 election. In Appendix D, we show the correlations of the DMAs in which Sinclair acquires stations with a variety of other demographic variables.
TABLE 2. Regressions of DMA Characteristics on Sinclair Ownership, Pre-2017 Stations
*p < 0.1; **p < 0.05; ***p < 0.01.
ESTIMATING THE INFLUENCE OF STATION OWNERSHIP
To estimate the influence of station ownership on content and viewership, we run both cross-sectional and difference-in-differences regressions employing a station’s pre-2017 ownership status by Sinclair as the independent variable in the former and 2017 Sinclair acquisition as the treatment in the latter. In Tables 3 through 6, we present five model specifications for each dependent variable. The level of observation for each model is an individual 2.5-minute transcript segment; we cluster standard errors by station to match the level at which the treatment variable (Sinclair ownership) varies. All models include time slot,Footnote 17 day-of-week, and network affiliationFootnote 18 dummy variables, so we estimate the effect of Sinclair ownership in all models within individual show times and days. Local news content and viewership vary systematically by time of day and day of week; for example, traffic reports are much more prevalent in early-morning time slots than in the evening news slot. The inclusion of a complete set of dummy variables for time and day ensures that our estimates of the treatment effect are not biased by a differing mix of air times or days at Sinclair- versus non-Sinclair-owned stations.
TABLE 3. Cross-Sectional and Differences-in-Differences Regressions of Local Politics Topics Weight on Sinclair Ownership
*p < 0.1; **p < 0.05; ***p < 0.01.
Standard errors (clustered by station) in parentheses. An observation is a segment. Columns 1–2 use the full sample of markets and stations. Columns 3–5 restrict to markets in which Sinclair acquired at least one station in 2017.
TABLE 4. Cross-Sectional and Differences-in-Differences Regressions of National Politics Topics Weight on Sinclair Ownership
*p < 0.1; **p < 0.05; ***p < 0.01.
Standard errors (clustered by station) in parentheses. An observation is a segment. Columns 1–2 use the full sample of markets and stations. Columns 3–5 restrict to markets in which Sinclair acquired at least one station in 2017.
TABLE 5. Cross-Sectional and Differences-in-Differences Regressions of Estimated Text-Based Slant on Sinclair Ownership
*p < 0.1; **p < 0.05; ***p < 0.01.
Standard errors (clustered by station) in parentheses. An observation is a segment. Columns 1–2 use the full sample of markets and stations. Columns 3–4 restrict to markets in which Sinclair acquired at least one station in 2017.
TABLE 6. Cross-Sectional and Differences-in-Differences Regressions of News Program Viewership on Sinclair Ownership
*p < 0.1; **p < 0.05; ***p < 0.01.
Standard errors (clustered by station) in parentheses. An observation is a program. Columns 1–2 use the full sample of markets and stations. Columns 3–5 restrict to markets in which Sinclair acquired at least one station in 2017.
The first and second models in each table are cross-sectional regressions run on the entire data set. The first column is a pooled regression including only the time/day dummies, while the second column introduces DMA-level fixed effects. The DMA fixed effects hold constant all time-invariant market characteristics—observables such as age, income, and education levels, as well as unobservables such as tastes for news content. Hence, their inclusion eliminates differences in content between Sinclair- and non-Sinclair-owned stations attributable to differences in characteristics of viewers in markets in which Sinclair operates compared with characteristics of viewers in markets in which it does not operate. Hence, the DMA fixed effects partially eliminate demand-driven sources of variation in news content.
However, DMA fixed effects do not rule out the possibility that Sinclair operates or acquires those stations within a given market that already attract a relatively more conservative, or more national news–focused audience. In models 3–5 in each table, we implement a difference-in-differences (DiD) design on a subset of the data limited to those DMAs in which Sinclair acquired a station in September 2017 (see Table 1 for descriptive statistics on stations acquired by Sinclair, and Figure 1 for a map of the location of these markets). In these models, we include an interaction of an indicator for being acquired by Sinclair in 2017 with a dummy variable indicating whether the observation is after September 2017, as well as main effects for both dummies. In other words, we now analyze the change in content for individual stations before and after the acquisition by Sinclair relative to other stations and programs operating in the same media market. The coefficient on the interaction term is the differential effect of Sinclair ownership on the change in a station’s content from pre- to post-September 2017.
The DiD approach eliminates confounding by fixed unobservables specific to the stations acquired by Sinclair, as well as common seasonal trends in news coverage from the pre-acquisition (summer) to post-acquisition (fall) periods.Footnote 19 The first of the DiD specifications includes no additional fixed effects beyond the time slot and day-of-week dummy variables. In the second, we include DMA fixed effects, estimating the effect of Sinclair ownership within DMA. In the final specification (with the exception of Table 5, for reasons previously discussed), we include DMA by show fixed effects, estimating the effect of ownership within a given show within a DMA. The inclusion of the DMA by show fixed effect holds audience attributes constant at an even more fine-grained level than DMA fixed effects alone. It rules out possible confounding by, for instance, the set of anchors or reporters on Sinclair-owned or Sinclair-acquired stations being more appealing to certain types of viewers, for example, those with greater taste for national politics news. If we find an effect in the DiD here, it cannot be simply because Sinclair-acquired stations were already set up to appeal to a relatively nationally focused or relatively conservative segment of the local news audience.
Content Choices: Topical Coverage
Across all specifications, we find strong evidence in both statistical and substantive terms that Sinclair ownership affects the content of the stations they operate. In Table 3, we find in the cross-section that coverage at stations owned by Sinclair prior to 2017 places, on average, just under four percentage points less weight on local politics than at non-Sinclair stations in the same DMA. Given that the average local politics weight in the sample is about 12.6 percentage points, this is a substantively large reduction. In the DiD specifications, we find that when a station is acquired by Sinclair its weight on local politics coverage drops by around 1.5 percentage points, relative to the change in other stations operating in the set of DMAs in which Sinclair acquired a station. The coefficients on the topic weights can be thought of as the proportion of time spent on a specific topic, so a reduction of four percentage points in this context can be interpreted as, for example, 1.2 minutes less time devoted to coverage of local politics in a typical 30-minute news broadcast.Footnote 20
In Table 4, we find the reverse effects for the national politics topic. Cross-sectionally, Sinclair stations allocate about one percentage point more weight to national politics on average. However, after being acquired by Sinclair, stations see a substantial shift in coverage toward national politics of about three percentage points—a 25% increase relative to the average level in the sample.
Appendices F and G show that this analysis is not an artifact of measurement error from the topic model we use to measure content characteristics. To assess the magnitude of possible measurement error, we had research assistants manually code a sample of 10,000 segments. In this sample, we find a strong agreement between human assessments and our topic weights, and no evidence that measurement error would lead to bias in the direction of finding spurious Sinclair ownership effects.
We also used this manually coded sample to train supervised classifiers that predict local versus national politics content from word usage. Predicted values from the supervised classifier can be used in place of the topic weights, yielding similar results to Tables 3 and 4. Although the results from the supervised classifier are directionally the same, we prefer the topic model approach because it uses information from all of the words in the data rather than a selected set and from all segments in the corpus rather than a small training subsample.
The results showing reduced coverage of local politics at Sinclair stations also hold if we measure coverage of local politics by counting mentions of the names of locally elected officials who hold office in the market in which the station operates. Mentions of local officials are lower at Sinclair-owned relative to comparable (same-market) non-Sinclair stations, both in the cross-sectional and in the DiD specifications. Mentions by name of local officials are very rare in local news coverage, however, and hence, this approach also sacrifices precision relative to the topic model.
In Appendix D, we conduct some additional analyses on the topic model output aimed at separating an explanation for these effects based on Sinclair ownership’s partisan or ideological motivation from one based on production cost efficiencies of cross-market distribution. Tables A.3 and A.4 separately break out two of the subcomponents of our composite national politics topic measure: the “foreign policy” topic and the “Trump scandals” topic, respectively. We find Sinclair increases coverage of both by similar amounts, consistent with a cost-efficiency motivation (as both kinds of story are distributable across Sinclair’s portfolio) but less consistent with a partisan motivation (as Sinclair’s partisan preference might push it to suppress news about the Mueller investigation or Russian interference in the 2016 election). We also find in Table A.5 that Sinclair does not increase coverage of crime stories: If anything, the Sinclair effect on crime coverage is negative. Although perceptions and attitudes about crime are closely connected with support for conservative policies in the post-civil-rights era (Weaver Reference Weaver2007), crime stories are local and require investment in local reporting resources. These two results provide some evidence in favor of the idea that Sinclair’s exploitation of cost efficiencies in the production of news are at least part of the mechanism behind the Sinclair ownership effect on news content.
Content Choices: Slant
In Table 5, we analyze the ideological slant of coverage, as measured by our text-based slant estimate described in Appendix C. For the purposes of this analysis, we focus on segments with 50% or more weight on the national politics topics. We restrict to national-politics-focused segments because the training set used to fit our model of ideology on phrase frequency comes from the Congressional Record (CR) and hence focuses on national rather than local issues. Including other non-national-politics segments tends to compress the distribution of slant estimates because doing so adds numerous phrases with no ideological valence in the CR.
Columns 1–2 of this table show that according to this measure, Sinclair stations on average are more right-leaning compared to the rest of the sample (column 1) and other stations in the same market (column 2). The DiD results in columns 3–4 show that, first, Sinclair’s 2017 acquisitions were actually somewhat left-leaning prior to the acquisition (row 2). This preexisting difference is also visible in Figure 3(c). Second, after the acquisition, coverage shifted to the right at these acquired stations, relative to other stations in the same set of markets (row 4). The size of the effect is an increase of 0.023 in the projected DW-NOMINATE score of the national politics coverage on these stations. In terms of the distribution of DW-NOMINATE scores in Congress, this is a small increase, but as Figure 4 shows, the distribution of projected scores for local news coverage is much more compressed than the distribution in Congress.Footnote 21 The magnitude of the DiD estimate here corresponds to an increase of roughly one standard deviation of the distribution of slant scores for local news stations.
In Appendix E, we show that the results of this slant analysis are very similar if instead of scaling segments relative to speech in Congress, we scale relative to speech on cable news. Sinclair stations’ coverage looks more similar to Fox News Channel coverage, and less similar to MSNBC coverage, than non-Sinclair stations.
The difference-in-difference results demonstrate that evidently, the content difference we see in the cross-section is not purely a function of differences in audience characteristics—stations newly acquired by Sinclair in 2017 shifted their coverage after the acquisition, making their coverage look more like that at existing Sinclair-owned stations in other markets. The large relative magnitudes of the shifts in content we measure imply that the supply-side role in the determination of news content is substantial.
Viewer Response
Table 6 estimates the reaction of viewers to the change in ownership. Here, the dependent variable is the number of households (in thousands) viewing the news show, as measured by the Nielsen company. The unit of observation here is a show-day, as this is the level at which Nielsen estimates viewership. We present analogous specifications as in the content regressions above.
In Table 6, we see from the first two columns that stations owned by Sinclair prior to 2017 had news shows with relatively low viewership. This is partially explained by the fact that the Sinclair portfolio tilts toward smaller markets (see Table 2) but the difference persists even within market. The overall average difference is a drop of about 13k households, which aligns with the differences in means seen in Figure 2(a). Restricting to within-market variation, Sinclair stations draw viewership of about 7k less than other competitors operating in the same market. This is a substantial difference, equivalent to nearly 30% of typical news program viewership.Footnote 22
The DiD results in columns 3–5 of Table 6 show that there is a small, but not statistically significant, drop in viewership at the 2017 Sinclair-owned stations after the change in ownership, relative to other stations in the same market. The magnitude of the drop is around 600 households, or about 2.5% of the median news show viewership in the sample. The 95% confidence interval is narrow enough to rule out an increase of more than about 700 households. On average, then, the response of viewers to the change in content driven by the Sinclair acquisition is close to zero, with a small decline more likely than a small increase.
These are short-term changes, however. It may take more time than the three months we have available in our data set for viewers to recognize and adjust to changes in content at their preferred station. Given that the average within-market viewership penalty experienced by the existing Sinclair stations is much larger, it is plausible that this gap may widen over time.
Sinclair’s influence on content choices at its newly acquired stations was, on the whole, costly in viewership terms.Footnote 23 Looking at the established Sinclair stations—which experience substantially lower viewership for their local news broadcasts than their same-market competitors—is suggestive that the DiD estimate for the newly acquired stations is an under-estimate of the long-term viewership effect of these changes. The fact that Sinclair nonetheless implemented the changes in content we document suggests that cost efficiencies on the production side (e.g., airing the same nationally focused and right-leaning segments on all stations in the portfolio) dominated the potential loss of advertising revenues from the viewership decline.
DISCUSSION
Our findings show that ownership matters for the content of local news. Following the acquisition of Bonten Media Group by Sinclair, the former Bonten stations’ content shifted toward coverage of national politics at the expense of local politics, relative to other stations in the same media market. Acquired stations’ content also moved to the right on the ideological dimension, again relative to other stations in the same media markets. This change brought the acquired stations closer in line with the pattern of coverage at the existing Sinclair-owned stations, at the cost of a small decline in viewership relative to the stations’ same-market competitors.
Both dimensions of content are important for political outcomes. Given the decline of local print media, local TV news is one of the few remaining sources of locally focused journalism. The substantial post-acquisition drop in local coverage at Sinclair-acquired stations can be expected to reduce viewers’ knowledge of the activities of local officials. Although the recency of the Bonten acquisition limits the set of downstream political outcomes that we can study, the existing evidence (Hayes and Lawless Reference Hayes and Lawless2015; Snyder and Strömberg Reference Snyder and Strömberg2010) suggests a strong prior that a local coverage drop will translate into reductions in both accountability for local officials and citizen engagement in local and state-level politics.
These results are a counterpoint to Hopkins (Reference Hopkins2018), who finds “no evidence of a shift away from state and local content” (p. 199) in a sample of seventy stations from 2005 to 2009. While there may not be a secular long-term trend away from local and state content in TV news, we show that consolidation can generate meaningful changes in the levels of local content even in the very short term. Insofar as the longstanding trend in local TV is toward greater concentration (Matsa Reference Matsa2014), it is likely that this local-to-national shift will continue. Although the specific acquisition that we study is very recent, Sinclair and other conglomerates have been steadily expanding since the 1980s. Ownership consolidation effects are therefore unlikely to be limited to the particular case we study here, but have influence on the broader news environment over a long time horizon.
The rightward shift in content at Sinclair-acquired stations can also be expected to have real consequences for election outcomes and mass polarization. Media outlets’ persuasive power is mitigated by the sensitivity of their audiences to content changes—if all left- (right-)leaning viewers fled following a leftward (rightward) shift in content, then “persuasion rates” (DellaVigna and Kaplan Reference DellaVigna and Kaplan2007) would be small and subsequent electoral influence minimized. In the local news case, the demand response to the content shift that we measure is fairly small. The estimated average viewership decline in our sample is about 700 households, compared with the median program-level viewership in the sample of about 25,000 households. Although we have only aggregate viewing data and hence cannot say definitively whether any individual viewers switched or not, given the very high documented persistence of individuals’ TV news viewership over time (Martin and Yurukoglu Reference Martin and Yurukoglu2018), a plausible interpretation of this estimate is that the vast majority of viewers watching before the acquisition date continued to watch afterward. For such non-switching viewers, the ideological valence of their news diet lurched rightwards following the acquisition.
Implications for Ownership Effects on News Coverage
These results speak directly to the literature on the influence of media ownership on the political content of the news produced by a media organization. This research program has found that the ownership of a media outlet determines how that outlet covers campaigns and candidates (Branton and Dunaway Reference Branton and Dunaway2009; Dunaway and Lawrence Reference Dunaway and Lawrence2015) and how the outlet slants its coverage away from issues potentially damaging to the ownership’s political or financial interests (Bailard Reference Bailard2016; Gilens and Hertzman Reference Gilens and Hertzman2000). We provide additional support for these claims, documenting a substantial shift in topics covered and ideological slant of political coverage as a product of ownership change. Moreover, the empirical strategy we employ allows us to assess the change in a station’s coverage relative to other stations in the same media market and ascertain that these changes in content are due to the change in ownership and not simply products of confounding by cross-outlet differences in audience composition.
These implications are particularly meaningful for the context discussed in this paper—ownership of multiple local outlets by a conglomerate owner. Dunaway (Reference Dunaway2008), for instance, documents a relationship between corporate ownership and the quality of campaign coverage by local outlets. Research on determinants of ideological slant (e.g., Gentzkow and Shapiro Reference Gentzkow and Shapiro2010; Hamilton Reference Hamilton2004; Mullainathan and Shleifer Reference Mullainathan and Shleifer2005), however, has tended to find that most variation in slant is attributable to variation in audience taste rather than ownership structure. In contrast, we find consistent effects of ownership on slant within market and within station, which are not accompanied by corresponding viewership increases and hence are difficult to explain in terms of the new ownership providing content better matched to local audience tastes.
Our results also provide evidence for a different mechanism for ownership influence than that usually considered in the literature on determinants of media coverage. While the rightward shift in slant we document is consistent with the political preferences of Sinclair’s ownership, we find evidence that Sinclair devotes more coverage to all national politics topics—including some that are harmful to its partisan objective—and does not devote more coverage to some topics that might be ideologically beneficial but would also require more investment in local reporting resources. Both facts imply that at least some of the ownership effect on content is not limited to owners motivated by desire for political influence but is due to cost-efficiency motives general to all profit-seeking media owners.Footnote 24 This influence of production costs on content is consistent with the existing work on the institutional determinants of news quality (Dunaway Reference Dunaway2011). Local politics coverage can be thought of as a measure of the quality of an outlet’s news product, reflecting its investment in journalistic staff. Changes in ownership structure can change the relative costs of providing different kinds of content and thus the outlet’s willingness to make these investments.
Implications for Media Regulation
Finally, our results have strong implications for the regulatory oversight of mergers in the TV industry. One factor enabling Sinclair’s rapid recent expansion is FCC’s elimination of the “main studio rule,” which required local news stations to maintain a physical studio in the broadcast area. For Sinclair and other conglomerates, the potential for economies of scale resulting from the elimination of the rule is straightforward. The results presented here document a cost of the current laissez-faire approach to cross-market consolidation.
Regulatory oversight has traditionally focused on the measures of concentration defined at the local market level, such as FCC’s prohibition on a single entity owning both a full-power TV station and a daily newspaper in the same market and caps on DMA-level TV market share that can be owned by a single entity.Footnote 25 Prat (Reference Prat2018) has previously argued that this traditional approach is good at measuring a media owner’s pricing power but very bad at measuring its political power; to measure the latter, Prat shows, one needs a measure of ownership concentration—“attention share”—defined at the individual rather than the market level.
Our analysis points to a distinct but similarly consequential problem with the use of such market-level concentration statistics to assess mergers in the TV industry. Prat observed that two configurations of reader- or viewership could produce identical concentration statistics but very different implications for media influence and polarization: Contrast, for example, a hypothetical world where all consumers devote equal time to each of three media outlets, to one where one-third of consumers read only the first outlet, one-third only the second, and one-third only the third. Though, in each configuration, each outlet has a one-third share of the total readership, in the first readers can cross-check factual claims of one outlet against the others, limiting media owners’ ability to distort information; in the second, each media owner has an unfettered monopoly over the information available to its share of the reading public.
Our analysis shows that an analogous property is true when moving in the opposite direction of aggregation: The news content that would be provided by a TV industry consisting of a handful of national conglomerates would look very different than that provided by one comprising numerous single-market operators, even holding measures of market-level concentration fixed. The cost efficiencies of consolidating news production appear to be large enough to make up for net losses in viewership it induces.Footnote 26 Even though consumers on average appear to prefer the more local-focused and ideologically moderate (pre-Sinclair) mix of coverage to the more national-focused and ideologically conservative (post-Sinclair) mix, Sinclair management still opted to reduce local heterogeneity in coverage across its stations by substituting centrally produced, nationally focused conservative segments for locally produced, less partisan content. Although the short-term post-acquisition viewership drop we document is small, the fact that both the DiD and within-market fixed-effect estimates of Sinclair ownership on viewership are negative—and the within-market estimate substantially so—implies that catering to viewer preferences is not the primary motivation for the changes in content implemented at the former Bonten stations.
Given the importance of local news provision for the accountability of local elected officials, regulators should not neglect this effect of cross-market ownership consolidation on local news content. The current trends toward national consolidation in TV and other media ownership have worrying implications for the performance of local governments and for mass polarization.
SUPPLEMENTARY MATERIAL
To view supplementary material for this article, please visit https://doi.org/10.1017/S0003055418000965.
Replication materials can be found on Dataverse at: https://doi.org/10.7910/DVN/G3X4EW.