


INTRODUCTION
Economic performance is one of the best predictors of election outcomes (Duch and Stevenson Reference Duch and Stevenson2008; Lewis-Beck and Paldam Reference Lewis-Beck and Paldam2000). Yet, the mechanisms by which money flowing through people’s pockets and communities maps into votes is much less clear (Ansolabehere, Meredith, and Snowberg Reference Ansolabehere, Meredith and Snowberg2014). Moreover, the economic voting literature is rife with inconsistencies. The survey-based literature concludes that voters are sociotropic—caring more about national than personal (pocketbook) economic conditions, backward-looking, and myopic (Fiorina Reference Fiorina1981; Kinder and Kiewiet Reference Kinder and Kiewiet1979; Kiewiet and Lewis-Beck Reference Kiewiet and Lewis-Beck2011). Meanwhile, the macro-based literature—and the political economy theory underlying it—assumes votes come from the pocketbook, and largely concludes that voters are, on aggregate, forward looking and highly capable of disciplining politicians for economic outcomes (Erikson, MacKuen, and Stimson Reference Erikson, MacKuen and Stimson1989, Reference Erikson, MacKuen and Stimson1992, Reference Erikson, MacKuen and Stimson2000, Reference Erikson, MacKuen and Stimson2002).
Some of these inconsistencies are due to imperfect data. Almost all of the evidence about the individual-level effects of economic circumstances comes from survey questions that depend on recollections. Moreover, these recollections are elicited at only a single point in time: right before or right after an election (Lewis-Beck and Paldam Reference Lewis-Beck and Paldam2000). This is potentially problematic, as partisan preferences, limited human memory, and other factors might color subjective assessments, making such survey data less than ideal (Wlezien, Franklin, and Twiggs Reference Wlezien, Franklin and Twiggs1997). On the other hand, macro data obscures individuals, leaving inferences subject to ecological biases (Kramer Reference Kramer1983).Footnote 1
Using improved data, we seek to paint a full picture of the economic voter and understand the roots of both pocketbook and sociotropic voting. In doing so, we contribute to three long-standing debates in the economic voting literature: pocketbook versus sociotropic voting, the effects of partisanship on economic views, and whether or not voters are myopic. Our data links a nationally-representative election survey to comprehensive personal financial information. This financial data provides respondents’ household income—as verified by tax returns—each year for a complete four-year term of a government. Merging this data with a detailed national election survey allows us to directly analyze the impact that an individual’s financial history has on economic evaluations, vote choice, and political preferences. The results suggest greater commonality between individual behavior and macro patterns than previously appreciated.
In particular, we demonstrate that pocketbook considerations—that is, personal economic circumstances—are, in our data, at least as important as sociotropic ones. Traditional analyses of the survey data we use support the literature’s conclusion that sociotropic motivations have the greatest influence on voters. However, when personal financial data is added to the analysis, those same voters are shown to actually vote equally on the basis of their pocketbooks. We then use our data to understand the sources of bias in economic evaluations. Both pocketbook and sociotropic evaluations include partisan bias. However, that bias is twice as large in sociotropic evaluations, perhaps leading to its prominence in predicting vote choice. Finally, counter to prior research, when focusing on personal financial circumstances, vote choice does not exhibit an end-year bias—an over-weighting of economic information in the final year(s) of a government’s term. In particular, we demonstrate that respondents put the most weight on income changes in the first year of the government’s term. In our study, this timing coincides with the government’s implementation of a large tax cut.
Together, the results show that our understanding of economic voting depends crucially on the quality of available data. Fine-grained personal financial data show the hidden impact of pocketbook considerations, the nature of partisan bias in economic perceptions, and the way that personal economic experiences over time affect vote choice. Together, these data paint a picture of economic voters who seem reasonably well informed of their own economic situation, and use this information rationally. Our discussion, in the final section, gives a more nuanced analysis, and suggests that these findings should provide renewed optimism for proponents of democratic accountability.
BACKGROUND
Our data covers the 2010 Swedish election and the previous four years of personal income.Footnote 2 While there are theoretical reasons to believe that economic voting in Sweden may not generalize to other places—in particular, Sweden has a small open economy (Duch and Stevenson Reference Duch and Stevenson2008)—our study encompasses two results that suggest otherwise. First, when examining survey data on economic perceptions, Swedish voters appear sociotropic, just like voters in other countries. Second, Swedes appear, in survey experiments, to suffer from end-year bias—just like voters in the U.S. (Healy and Lenz Reference Healy and Lenz2014).
Ahead of the 2006 election, the four center-right parties (the Moderates, the Center Party, the Liberal People’s Party, and the Christian Democrats) formed a coalition, the Alliance for Sweden (henceforth, the Alliance). The Alliance’s platform consisted of aggressive tax cuts on labor income. These were paid for with cuts to some social services. In addition, the Alliance championed labor-market reforms designed to make employment more flexible. The Alliance won the 2006 election and formed a majority coalition government, ending 12 years of Social Democratic governments.
The campaign of 2006 focused heavily on the domestic economy, and employment was seen as the most important issue among voters (Widfeldt Reference Widfeldt2007). Soon after the election, the Alliance implemented their centerpiece tax cut, the jobbskatteavdraget, or earned income tax credit (EITC). Like the EITC in the U.S., this primarily benefited low and middle income workers. This tax cut was designed to encourage work, and so only applied to labor income. Rates of taxation on disability benefits, unemployment insurance, pensions, and other social transfers were kept constant.
Median income (in thousands of Swedish Kronor—SEK), income growth, tax on labor income, and the unemployment rate during the two government terms from 2002 to 2010 are shown in Figure 1. As can be seen, income growth was fairly constant across the period, with the large tax cuts in 2006–2007 leading to a one-year increase in the growth rate. The great recession hit Sweden in 2008, increasing unemployment and lowering the growth rate, although it remained positive.
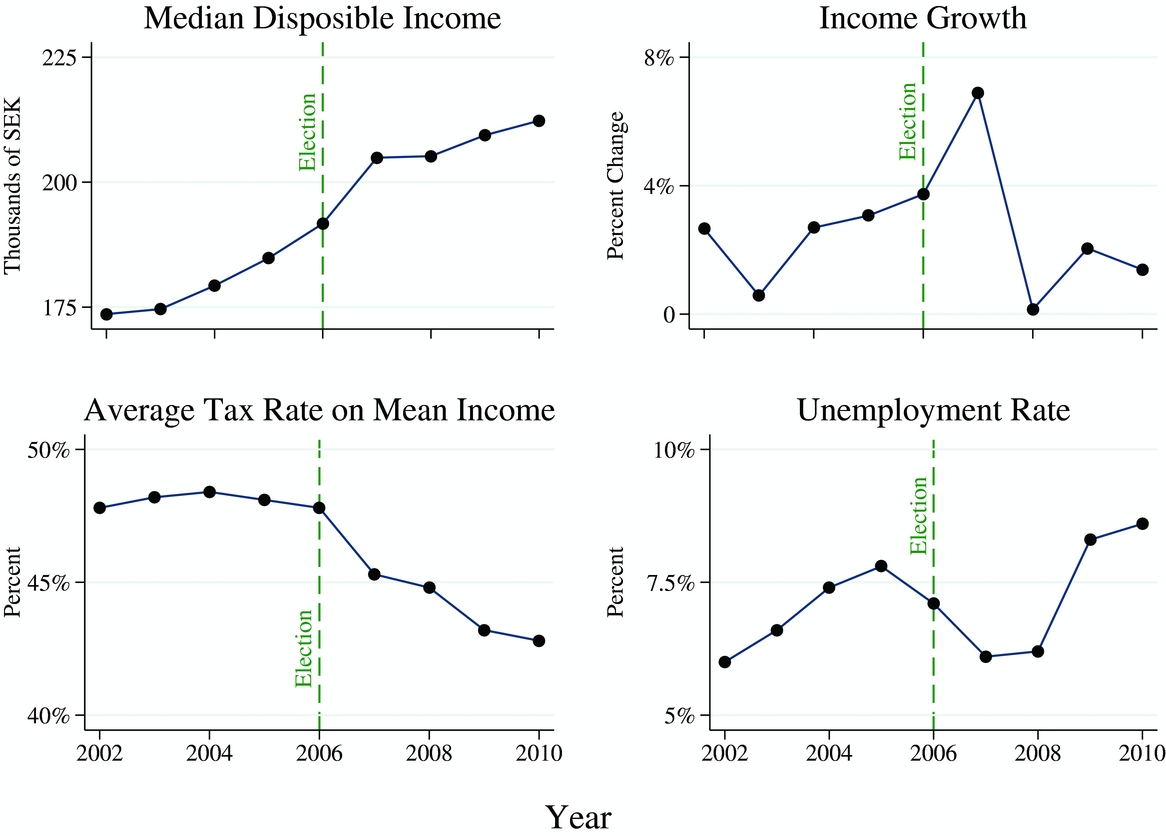
FIGURE 1. Income, Taxes, and Unemployment in Sweden, 2002–2010
In 2010, the Alliance successfully defended its economic record, convincing voters that Sweden had handled the external factors causing the great recession better than most other countries in Europe and elsewhere. Although the Alliance increased its vote share, it lost its majority position due to the rising popularity of the anti-immigrant Sweden Democrats (Widfeldt Reference Widfeldt2011). The Alliance was, however, still the largest block, with 172 seats in parliament, followed by Red-Greens—a coalition consisting of the Social Democrats, the Green Party, and the Left Party—which amassed 157 seats.
Economic Voting in Sweden
As studies of economic voting are conducted in many different countries, and often focus on the U.S., the generalizability of our conclusions relies on whether Swedish voters are different than voters elsewhere. At least for the phenomena we examine, Swedish voters appear remarkably similar to voters elsewhere.
Most recent studies have concluded that Swedish voting behavior, and the importance Swedes place on economic conditions, closely resembles economic voting in other countries (Martinsson Reference Martinsson2013). A number of scholarly works based on the Swedish National Election Study (SNES) find that sociotropic considerations dominate pocketbook ones (Jordahl Reference Jordahl2006; Holmberg Reference Holmberg1984; Holmberg and Gilljam Reference Holmberg and Gilljam1987; Gilljam and Holmberg Reference Gilljam and Holmberg1993; Holmberg and Oscarsson Reference Holmberg and Oscarsson2004). Thus, survey evidence from Sweden conforms to the conventional wisdom established in the U.S. and several other countries: the economy matters, and sociotropic evaluations matter substantially more than pocketbook ones (Kinder and Kiewiet Reference Kinder and Kiewiet1979). We confirm these previous results from Sweden. Moreover, we replicate the survey-based experiment of Healy and Lenz (Reference Healy and Lenz2014) and show that the results match those in the U.S.: Swedish voters appear myopic in the data from this experiment. While this cannot prove that the differences between our findings and the previous literature are solely due to superior data, it is consistent with that hypothesis.
Despite these empirical facts, there remain theoretical concerns: in particular, Sweden is a multi-party parliamentary democracy with a small, open economy. On the one hand, the parliamentary system makes it easier for voters to assign credit or blame to the incumbent government for economic circumstances. On the other hand, the multi-party nature of that government, and the size of the economy, make this harder (Duch and Stevenson Reference Duch and Stevenson2008). Because the electoral coalitions in Sweden were known ahead of the 2010 election, we can mitigate concerns about coalition governments by coding a vote for any member of the incumbent coalition as a vote for the incumbent (1), and a vote for any other party as a vote against (0). There is little to be done about the fact that Sweden’s economy is small in global terms. However, it is worth noting that our results show voters rewarding the government much more for tax cuts in their first year in office than punishing them for changes in income due to the great recession in the second and third years.
Economic Voting
The economic voting literature consists of a large number of sub-literatures. Due to the nature of our data, we are able to examine three inter-related topics usually considered in isolation.
A large portion of the economic voting literature attempts to discern whether voters have pocketbook or sociotropic motivations, settling on the latter (Fiorina Reference Fiorina1981; Kinder and Kiewiet Reference Kinder and Kiewiet1979; Kiewiet and Lewis-Beck Reference Kiewiet and Lewis-Beck2011).Footnote 3 A common interpretation of this conclusion is that voters are motivated by public interest (Lewin Reference Lewin1991). Others argue that voters are self-interested, and the apparent importance of sociotropic evaluations occurs because the national economy is a clearer signal of governmental performance than personal economic experiences (Ansolabehere, Meredith, and Snowberg Reference Ansolabehere, Meredith and Snowberg2014; Elinder, Jordahl, and Poutvaara Reference Elinder, Jordahl and Poutvaara2015; Kramer Reference Kramer1983; Peltzman Reference Peltzman1990). Our findings suggest that it is unlikely voters are primarily motivated by the public interest, and that researchers have been misled by the noisiness of personal economic data.Footnote 4
The pocketbook and sociotropic evaluations that are the basis for studies in the preceding paragraph have received their fair share of criticism. In particular, several studies argue that these evaluations reflect political, rather than economic, considerations. That is, voters decide who they are going to vote for, and then report an economic evaluation that conforms with that choice (Chzhen, Evans, and Pickup Reference Chzhen, Evans and Pickup2014; Duch, Palmer, and Anderson Reference Duch, Palmer and Anderson2000; Evans and Andersen Reference Evans and Andersen2006; Evans and Pickup Reference Evans and Pickup2010, Reference Evans and Pickup2013; van der Eijk et al. Reference van der Eijk, Franklin, Demant and van der Brug2007; Wlezien, Franklin, and Twiggs Reference Wlezien, Franklin and Twiggs1997). Equally, perceptions might be colored by a “partisan lens” that leads voters to view the same economic events more favorably if their preferred party is in office (Zaller Reference Zaller1992). We show that once real economic conditions are taken into account, partisanship still explains some of the voters’ economic evaluation. Moreover, partisan bias is a larger component of sociotropic evaluations. Thus, economic evaluations contain both real economic information and partisan bias. However, to tease apart these two contributors to economic evaluations, fine-grained financial data is necessary.Footnote 5
Additionally, many studies argue that voters are poorly informed, and thus subjective evaluations will be noisy (Bartels Reference Bartels1996; Conover, Feldman, and Knight Reference Conover, Feldman and Knight1986; Hellwig and Marinova Reference Hellwig and Marinova2015; Kramer Reference Kramer1983). Presumably, the level of noise should vary with political sophistication (Alt, Lassen, and Marshall Reference Alt, Lassen and Marshall2016; Duch, Palmer, and Anderson Reference Duch, Palmer and Anderson2000). Surprisingly, there is no agreement in the direction of the relationship. Low-sophistication voters may require media cues to make economic evaluations, and thus, sociotropic evaluations may be more accurate for these voters than pocketbook evaluations (Mutz Reference Mutz1992, Reference Mutz1994). On the other hand, the lack of sophistication may make it difficult for low-sophistication voters to incorporate external information, making pocketbook evaluations more accurate (Delli Carpini and Keeter Reference Delli Carpini and Keeter1997). We find that increased political sophistication is, on aggregate, unrelated to accuracy of economic evaluations.
Concerns have also been raised about voters’ abilities to retain and use economic information from early in a government’s term.Footnote 6 However, there is some disagreement over whether this reflects rational concerns—as it usually takes some time for economic policy to filter through to economic outcomes (Hibbs Reference Hibbs1987; Erikson Reference Erikson1989)—or a myopic bias (Huber, Hill, and Lenz Reference Huber, Hill and Lenz2012). The latter is of particular concern as it limits democratic accountability, and may lead to inefficient attempts at economic manipulation (Abrams Reference Abrams2006; Achen and Bartels Reference Achen and Bartels2004). However, the evidence in all cases comes from surveys or aggregate data. By examining actual personal economic information, we reveal patterns that are incompatible with voter myopia. Namely, in our setting, voters place the most weight on economic information from the beginning of the incumbent government’s term, which corresponds to a large tax cut—the government’s most important economic policy.
On the whole, then, our data suggest voters are reasonably well informed, at least about their own personal economic circumstances, and seem to use their information rationally. While much of the economic voting literature disagrees with this conclusion, proponents of macropolitics have routinely argued that, on average, voters make very good projections about future economic conditions, and this influences both their partisanship and vote choice (Erikson, MacKuen, and Stimson Reference Erikson, MacKuen and Stimson1989, Reference Erikson, MacKuen and Stimson1992, Reference Erikson, MacKuen and Stimson2000, Reference Erikson, MacKuen and Stimson2002).Footnote 7 Our findings show individual behavior broadly consistent with this macro perspective.
Data
Most prior studies of economic voting rely on voters’ economic evaluations at a single point in time, or aggregate government statistics on the economy and elections. A number of factors have pushed researchers toward these measurement techniques. First, conventional wisdom holds that quantities are difficult to ask about on surveys, and thus, self-reported income measures have reliability problems (Micklewright and Schnepf Reference Micklewright and Schnepf2010; Moore and Welniak Reference Moore and Welniak2000; Yan, Curtin, and Jans Reference Yan, Curtin and Jans2010). Second, recollections of income across time may exceed limited human memory (Withey Reference Withey1954).
By combining detailed and verified data on income with survey data we can address old debates in new ways. Our survey data comes from the SNES, carried out by Statistics Sweden in collaboration with the University of Gothenburg. The 2010 study was based on a random sample of 3,963 Swedish citizens aged 18 to 80; 2,736 interviews were conducted for a response rate of 69%. Approximately half of the sample was also interviewed for the 2006 SNES; the rest were re-interviewed in 2014. Additionally, half of the sample was interviewed before the election, and half afterward, with a somewhat different survey instrument. As such, many of our results apply to about one-quarter of the overall sample.Footnote 8 Most interviews were conducted face-to-face in respondents’ homes or workplaces. The average time for a full interview was about one hour.
Detailed information about each citizen’s income is collected in the Income and Taxation Register. After approval from the Swedish Research Ethical Review Board, Statistics Sweden merged this data with the 2010 SNES.Footnote 9 This data is the exact value in SEK. At the end of 2010, US$1 ≈ SEK6.75.
Our analyses focus on real household disposable income as this is the best summary of economic experience available to us, and a better predictor of election outcomes than other income measures (Achen and Bartels Reference Achen and Bartels2004; Bartels Reference Bartels2007; Bartels and Zaller Reference Bartels and Zaller2001). An individual’s personal income will give an inaccurate picture when his or her partner has significantly higher or lower income. Gross income does not factor in taxes and fees, and in many cases, transfers. That is, disposable income is a better measure of the “true parameter of interest” (Kramer Reference Kramer1983)—economic conditions that can be fairly attributed to the government. As other scholars have noted, real disposable income is a “more direct measure of voters’ concrete economic pain or pleasure” (Achen and Bartels Reference Achen and Bartels2004).
Throughout, we present results from both the full sample and a stable sample. The former contains all respondents. The latter consists of households whose composition remained the same from 2006 to 2010. Household income is affected by the number of adults living in a household. This may change due to divorce, death, a retired parent moving in, or a grown child moving out. As such, our stable sample contains households that went through no such changes from 2006 to 2010. The stable sample also leaves out those that were retired, as they experience very little change in income.Footnote 10 Of the full sample, 60.8% are in the stable sample, and a further 11.8% are retired. In general, results in both samples are quite similar.
SOCIOTROPIC AND POCKETBOOK VOTING
We begin our analysis by re-examining a central finding of the economic voting literature: voters are sociotropic. We find that the portion of pocketbook evaluations that corresponds to real economic conditions is highly correlated with vote choice. This leads naturally into the next two sections, where we first examine the other components of economic evaluations, finding that it is partisan bias, and, in the case of national evaluations, outside information. Then, we examine how vote choice is affected by personal economic conditions across time.
A voluminous literature documents that voters seem to rely more on evaluations of the national economy (sociotropic) rather than personal economic circumstances (pocketbook) in choosing who to vote for (Kiewiet and Lewis-Beck Reference Kiewiet and Lewis-Beck2011; Kinder and Kiewiet Reference Kinder and Kiewiet1979; Lewis-Beck and Paldam Reference Lewis-Beck and Paldam2000). This finding is so ingrained that scholars often forget just how puzzling it is: personal economic experiences are salient and directly experienced, while national economic conditions need to be gleaned from news sources or, possibly, one’s surroundings (Grafstein Reference Grafstein2009; Kinder and Kiewiet Reference Kinder and Kiewiet1981). As Fiorina (Reference Fiorina1981, 5) notes, pocketbook voting is theoretically more robust, because, “In order to ascertain whether the incumbents have performed poorly or well, citizens need only calculate the changes in their own welfare [emphasis added].”
Here, we document that pocketbook and sociotropic considerations are equally important, once voters’ actual economic circumstances are taken into account. To measure sociotropic and pocketbook evaluations, we use the answers to two questions that have been extensively studied in the economic voting literature. Sociotropic evaluations come from answers to:
Would you say that the economic situation in Sweden has improved, stayed the same, or gotten worse, compared with the situation 12 months ago?
whereas the pocketbook evaluation comes from:
If you compare your economic situation with what it was 12 months ago, has it improved, stayed the same, or has it gotten worse?
Both questions allow responses on the same five-point scale, from “much worse”, which we code as 1, to “much better,” which we code as 5.
The role of raw sociotropic and pocketbook evaluations in vote choice are analyzed in Table 1. In all columns, the dependent variable is whether or not a respondent, whose turnout has been verified, reported a vote for the incumbent Alliance (coded 1), or a vote for a nonincumbent party (coded 0). This is regressed on sociotropic and pocketbook evaluations, and, in some cases, controls, using ordinary least squares (OLS).Footnote 11 The first set of regressions uses the stable sample, and the second set uses all respondents that answered these questions.
TABLE 1. The Portion of Pocketbook Evaluations Driven by Economic Circumstances Is at Least as Important as Sociotropic Evaluations in Vote Choice
Notes: ***, **, * denote statistical significance at the 1%, 5%, and 10% level, with heteroscedastic-consistent standard errors in parentheses. The dependent variable equals 1 for those voting for the incumbent center-right Alliance and 0 for those voting for opposition parties. Controls include: age, age squared, education, gender, marital status, immigration status, and education.
The first two columns report the standard analysis of survey data in this literature. They show the standard result: sociotropic evaluations appear to be much more important than pocketbook ones in determining vote choice. The addition of controls has little effect. This matches the extant economic voting literature in both the U.S. and Sweden, emphasizing the general applicability of the results of our further analyses.
To understand the effect of personal economic circumstances on vote choice, and compare it with the effect of sociotropic evaluations, we first project pocketbook evaluations onto actual economic circumstances as observed in the register data. That is, we implement a two-staged-least-squares (2SLS) procedure to isolate the relationship between vote choice and the portion of the pocketbook evaluation correlated with actual economic conditions.
The results of this 2SLS procedure for the stable sample are displayed in the third and fourth column of Table 1. In particular, we regress pocketbook evaluations on economic circumstances—the change in household income in the year preceding the election (2009–2010), and baseline income in 2009. We use the change in the year prior to the election, as this matches the period of time in the evaluative question.Footnote 12 The change is represented with three variables. The 10% largest positive and negative income shocks are each represented by dummy variables, while all other shocks are entered linearly. This allows us to restrict the influence of outliers, while still preserving the information they contain.Footnote 13
When the projections from this first stage are entered in a second-stage regression, the results are striking. Pocketbook considerations go from being a distant also-ran to as important as sociotropic ones.Footnote 14 However, the fact that coefficients on sociotropic evaluations decrease only slightly implies that they contain additional information beyond personal economic circumstances.Footnote 15 This is true whether one examines just the stable sample (columns 1–4), or the full sample of respondents (columns 5–8).
The 2SLS estimates provide strong evidence that pocketbook considerations are more important than previously appreciated. Moreover, they call into question a common interpretation of sociotropic voting: that voters are primarily motivated by public interest rather than their own self-interest (Lewin Reference Lewin1991). Statistically, the fact that the 2SLS estimates are so much larger than the OLS estimates is consistent with the presence of substantial white-noise measurement error in pocketbook evaluations. If this were the case, it would attenuate regression coefficients toward zero, and would have prevented previous scholars from appreciating the importance of pocketbook evaluations.Footnote 16
A natural next question arises: what, besides personal economic conditions, drives personal and national evaluations? We turn to this question in the next section.
BIAS AND ACCURACY IN POCKETBOOK EVALUATIONS
Prior scholarship contends that economic evaluations are driven by partisanship. Figure 2 illustrates this concern: those who report that their personal economic circumstances are “much better” than a year ago are more likely to vote for the incumbent than those who report they are “much worse.” But, are they voting for the incumbent because their economic circumstances improved? Or do they report that their economic circumstances improved to align with their partisan vote?
FIGURE 2. Those Who Report Improved Economic Circumstances Are More Likely to Vote for the Incumbent.
The prior section shows that pocketbook evaluations are not only noise. It establishes that personal economic evaluations reflect actual economic circumstances. We can illustrate this another way: Figure 3 shows that those who reported improved economic circumstances over the previous year experienced greater increases in income than those who reported declining economic circumstances.Footnote 17
FIGURE 3. Pocketbook Evaluations Are Correlated with Actual Personal Income Growth.
Our data provides insights into other determinants of economic evaluations. We first regress personal and national economic evaluations on actual economic circumstances—as in the first-stage specification underlying Table 1—and generate residuals. These residuals are the difference between evaluations of two people with the same economic circumstances. Thus, predictors of these residuals are predictors of bias from the average view.Footnote 18 We regress these residuals on measures of partisanship, political knowledge (measured as the percent of correct answers to 18 general political knowledge questions), and a host of demographic characteristics.
Clear evidence of bias in personal economic evaluations is shown in Table 2. In particular, once actual economic circumstances are taken into account, those who plan to vote for the incumbent Alliance report more favorable economic evaluations.
TABLE 2. Personal Evaluations Show Evidence of Partisan Bias

Notes: ***, **, * denote statistical significance at the 1%, 5%, and 10% level, with heteroscedastic-consistent standard errors in parentheses.
To reduce concerns that unobserved factors may be driving both the residual and voting for the incumbent in 2010, we examine the relationship between the residuals and vote choice in 2006. In 2006, the Alliance was not incumbent, so if the same unobserved factors were driving both voting in 2006 and residual evaluations in 2010, we would expect to see a negative coefficient on 2006 vote choice. However, this is not what we observe. Instead, the coefficient is positive. It is smaller and insignificant when using the 2006 vote choice—reported concurrently—for the very small sample of people for whom we have this information. The coefficients on 2006 vote choice as recalled in 2010 is very similar to the coefficient on 2010 vote choice. The differences in coefficients on the contemporaneous and recall measures appear to be due to sample size, as an overwhelming majority of respondents (92%) reported the same 2006 vote choice in both 2006 and 2010.
National evaluations show greater partisan bias and are related to general political knowledge. Coefficients on partisanship in Table 3 are roughly twice as large as those in Table 2.Footnote 19 Political knowledge is also strongly associated with national evaluations. Those that are more knowledgeable about politics have a much more positive view of the national economic situation. This is independent of education, age, marital status, and, of course, personal economic circumstances. This informed positivity shows that national economic evaluations likely reflect additional information that voters cannot get from their own experiences.Footnote 20
TABLE 3. National Evaluations Show Greater Partisan Bias than Personal Evaluations, and Are Related to External Information
Notes: ***, **, * denote statistical significance at the 1%, 5%, and 10% level, with heteroscedastic-consistent standard errors in parentheses.
As discussed in the literature review, the relationship between the level of noise in subjective evaluations and political sophistication is unclear. To examine this, we regress the absolute value of the residual from economic evaluations on the same variables as in Table 2. The results, available in Online Appendix C, show little evidence that any of the variables in Tables 2 and 3 are related to the accuracy of economic evaluations. Of particular note, political knowledge is uncorrelated with accuracy of either personal or national evaluations. This is counter to both strains of the prior literature. However, these results should be interpreted carefully, as “accuracy” is defined here as the closeness of a respondent’s reported economic evaluations to the average of others with the same economic experiences. Nevertheless, inaccuracies in economic evaluations are not driving the patterns of bias among voters.
Two final notes on these analyses are in order. First, the prior literature uses panel data to provide evidence of partisan bias in economic evaluations. This requires (reasonable) assumptions about the dynamics of partisanship and/or that other economic events (such as a job loss) are correctly reported. Personal financial data allows for the separate identification of economic and political contributions to economic evaluations, and shows they are both important.Footnote 21 Second, there is no variation in macroeconomic conditions we can exploit to judge the relative quality of economic information contained in personal and national evaluations. However, the macropolitics literature, discussed in the literature review, has shown that voters’ forecasts of aggregate economic outcomes are, on average, quite good. Thus, there are other indications that sociotropic evaluations—at least of the prospective variety—contain important economic information as well.
Up until this point we have largely examined election-year income changes, as this is the quantity asked about in retrospective economic evaluations. The literature provides another reason for focusing on this quantity: voters are thought to be myopic, primarily using election-year changes when making voting decisions. Our data allows us to examine this conclusion. We do so in the next section.
IS THE ECONOMIC VOTE MYOPIC?
Much of the evidence for end-year myopia comes from surveys, survey experiments, and aggregate statistics. Each is potentially problematic. Surveys, administered at only one point in time, consider a single economic setting. Survey experiments assume that voters’ reported responses to hypothetical economic conditions are representative of the behavioral consequences of real economic information. Aggregate statistics provide little detail on mechanisms, making it difficult to distinguish a rational focus on the end of a government’s term from a myopic bias (Hibbs Reference Hibbs1987).
Our data present a unique opportunity to test whether such end-year myopia appears when we examine voters’ income across a government’s term. To argue that our results generalize, we first verify that Swedish voters respond in the same way as U.S. voters to hypothetical economic conditions in survey experiments. We do so by replicating the experiment of Healy and Lenz (Reference Healy and Lenz2014) (hereafter, HL) in two Swedish surveys.Footnote 22 We then proceed to examine how vote choice responds to real changes in household income. We find, contrary to the existing survey-based evidence—including our own—that Swedish voters put the most weight on personal income changes early in the government’s term. While this may seem puzzling, it is actually heartening: as shown in Figure 1, the incumbent government’s largest impact on disposable income was felt in the first year of its term, when it sharply cut taxes.
The survey experiment we replicate asks respondents to rate graphs of hypothetical economic growth during a government’s term. This is operationalized by showing respondents four bars illustrating the growth rate in each year.Footnote 23 We use the same 25 pictures used in HL, in which each year was independently drawn from a normal distribution parameterized by the first and second moments of postwar yearly growth in the U.S. We supplement this with another 100 hypothetical economic records that are drawn according to a normal distribution parameterized by the first and second moments of yearly growth in postwar Sweden. Thus, some economic records showed steady growth, others showed brief or long-lasting recessions, and some large changes in growth rates.
Our experiment ran on a probability-sampled representative survey of 584 Swedes. As HL largely conducted its experiment on a convenience sample—Mechanical Turk—we also ran our experiment on 1,374 Swedes in an opt-in (convenience) sample.Footnote 24 Those in the opt-in sample were shown five hypothetical economic records—two with U.S. growth rates and three with Swedish growth rates, while those in the probability sample were shown seven hypothetical economies—three with U.S. growth rates, and four with Swedish growth rates. Participants were informed that the plots represented growth rates in national average levels of personal income during a government’s second term. They were asked to assess, on a four-point scale, how good the economy was during the term.
Table 4 analyzes the results of this experiment, following HL. In particular, we regress assessments of each graph on the yearly growth rates therein. To focus on within person variation in these assessments, we include respondent-specific fixed effects. Moreover, we cluster standard errors by hypothetical economy, as this is the unit of treatment.
TABLE 4. Assessments of Hypothetical Income Growth in Sweden Mirror Results in the U.S.
Notes: ***, **, * denote statistical significance at the 1%, 5%, and 10% level, with standard errors clustered by a hypothetical economy in parentheses. All specifications include respondent fixed effects.
The results for our Swedish sample replicate those in HL’s U.S. sample. Swedish voters heavily over-weight economic growth in the final years of the hypothetical government’s term—especially the last year. Indeed, the coefficient on final-year economic growth is significantly larger than the coefficients on any other year. This is true regardless of whether the economic records are meant to mimic the U.S. or Sweden. Moreover, the result is the same whether one examines the opt-in or probability sample.
Having established that Swedes show the same kind of end-year bias in national economic evaluations as U.S. voters in a survey experiment, we turn to register data on personal income. In particular, in Table 5, we regress an indicator for whether the respondent voted for the incumbent center-right Alliance on changes in (logged) household disposable income over the Alliance’s term. In all cases, the specifications show that the most important yearly changes in disposable income were in the first years of the Alliance’s government. Baseline income—in 2006—also increases the probability that the respondent voted for the Alliance, reflecting the general finding that higher income is associated with right-leaning political views. While the emphasis on income growth in the early years of the Alliance’s term is unexpected, it is consistent with the fact that the most important economic changes—ones that immediately impacted disposable income—were implemented in the Alliance’s first year in office, as shown in Figure 1, and discussed in the surrounding text.
TABLE 5. Incumbent Voting Is Most Correlated with Income Changes in the Alliance’s First Year in Office.

Notes: ***, **, * denote statistical significance at the 1%, 5%, and 10% level, with heteroscedastic-consistent standard errors in parentheses. The dependent variable equals 1 for those voting for the incumbent center-right Alliance and 0 for those voting for opposition parties.
The specifications vary according to the sample used—stable or full, whether controls are included, and whether we include vote choice in 2006 as an independent variable. Both varying the sample and the inclusion of controls make very little difference in the results. In all columns, the point estimate on the first year change is larger than the coefficient on changes in income in other years. This is statistically significant (at p < 0.01) for all columns but the sixth. In that column, the difference between the coefficient on the first year change, and the second and third, have p-values of ≈0.2.
As in prior analyses, it is important to understand the effect of outliers on the results. However, unlike in the first-stage specifications underlying Table 1, the coefficients in Table 5 are substantively important. Thus, we check the robustness of these coefficients to omitting those with the largest income shocks. As can be seen in Figure 4—which estimates the specification in Column 5 as more and more outliers are dropped—the coefficients are robust to dropping those with large, and even moderate, income shocks. As expected, the standard errors on these coefficients grow as the sample shrinks, but there is otherwise nothing remarkable in this figure. Most importantly, this analysis shows no sign of end-year bias, and continues to show that income changes in the first year(s) of the Alliance’s term had the largest impact on respondents’ vote choices. This is true even when we restrict the sample to those who only experienced small to moderate-sized income changes.
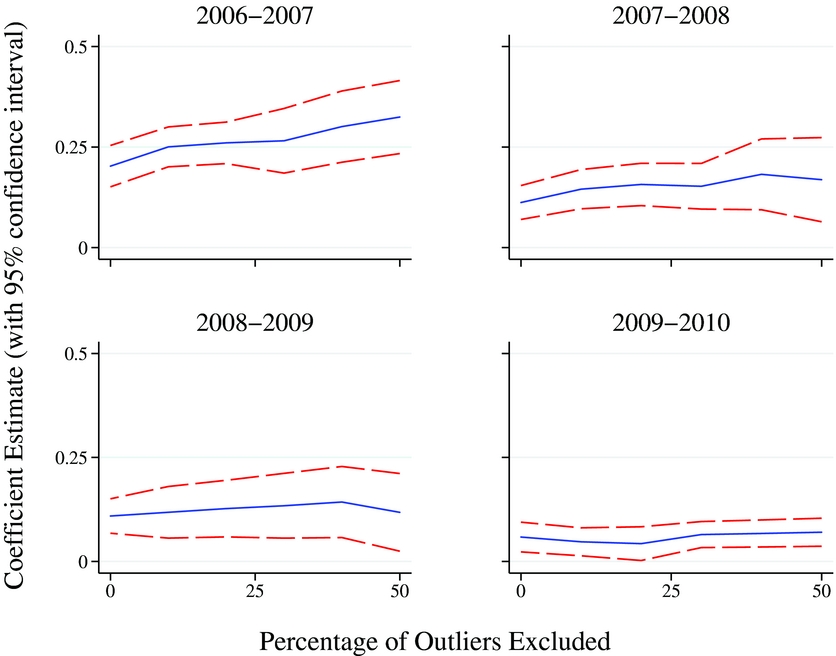
FIGURE 4. Coefficients in Table 5 Are Robust to Removing Outliers
The results in Table 5 and Figure 4 are a robust rejection of myopia in pocketbook voting. But what can explain the apparent “hyperopia” in these voters? The simplest explanation is that voters remembered the large tax cuts in the first year of the Alliance’s term, and this influenced their vote choice. As shown in Figure 1, and described in the surrounding text, the first-year tax cuts were the most significant economic policy implemented by the Alliance. This is consistent with voters responding to subtle shifts in their own experience when those shifts are accompanied by intense elite messaging (for example, Egan and Mullin Reference Egan and Mullin2012).
However, one may be concerned that the tax cuts primarily benefited the Alliance’s core supporters who were going to vote for them again anyway. There are three reasons to doubt this interpretation. First, the first-year tax cut was primarily an EITC. As previously mentioned, this tax cut went primarily to low- and middle-income workers. These are not the traditional supporters of the center-right parties that made up the Alliance. Second, in the second and fifth columns, we control for many demographic factors that predict, in Sweden, center-right ideology: in particular, age, gender, education, and marital and migrant status. While these are not perfectly predictive of Alliance support in 2006, the fact that these controls make almost no difference to the results suggests that the bias here must be small. Third, and finally, hyperopia persists, although appears somewhat weaker, when we control for 2006 vote choice explicitly. However, as those who voted for the Alliance in 2006 cannot support it any more than by voting for it again in 2010, this does not reflect any gain in intensity of support by existing Alliance voters.Footnote 25
Whichever way one looks at the results in Table 5 and Figure 4, they are inconsistent with a view of voters as suffering from a myopic bias. Moreover, the probable reading of these results is consistent with self-interested voters exercising the levers of democratic accountability. Another piece of evidence points in the same direction. There is a moderate negative correlation (−0.3) between changes in income in the first three years of the Alliance’s term. This suggests that those who benefited the most from the Alliance’s tax cut were more likely to be among the hardest hit by the recession. This is interesting as it suggests that voters correctly gave the government credit for the increase in disposable income in the first year, but did not incorrectly blame the government for the decrease in disposable income the next year—this decrease was due to an event outside the government’s control: the worldwide great recession. Thus, Swedish voters appear to be neither myopic nor hyperopic. They appear to give the government credit where credit is due. In this case, credit happened to be due for the first-year income changes, and not much else.
We conclude in the next section by summarizing our results and discussing how they relate to democratic accountability.
DISCUSSION
By augmenting survey data with personal financial data from tax records, we paint a more complete picture of the economic voter than previously possible. In doing so, we revisit three findings from the economic voting literature. Taken together, our analyses show that survey and aggregate data can obscure, and sometimes mislead, researchers about how voters behave.
We find that pocketbook evaluations contain real information about economic experiences, and the evaluations based on those experiences are just as important as national evaluations in determining vote choice. Moreover, the partisan content of national economic evaluations is roughly double that of personal economic evaluations. National evaluations reflect political knowledge while personal evaluations do not. Finally, in our data, voting is largely driven by changes in income during the first year of the government’s term. This was when the biggest policy changes occurred. Thus, voters are not myopic when it comes to their personal financial circumstances. In addition, their economic evaluations of the incumbent are plausibly driven by policy.
The fact that pocketbook evaluations may be more important than previously appreciated does not imply that sociotropic evaluations are unimportant. However, we can only speculate about why sociotropic evaluations continue to be important. An explanation consistent with our findings is that the national evaluation reflects additional information about one’s own economic circumstances that comes from other sources (Ansolabehere, Meredith, and Snowberg Reference Ansolabehere, Meredith and Snowberg2014; Kiewiet and Lewis-Beck Reference Kiewiet and Lewis-Beck2011). Even if voters only care about their own economic circumstances—which seems unlikely—each person only has a single observation of this: their own experience. This is insufficient to make general inferences. The ideal data to have is the economic experience of “people like you.” The sample is large enough that one can make inferences, and related enough that these inferences are useful. We speculate that this information—along with the general social concerns of voters—is reflected in the continued importance of national evaluations to vote choice.
This is consistent with both of our findings about national evaluations. As co-partisans are more likely to be “like you” economically (especially in Sweden), partisanship should be a more important factor in national economic evaluations. Moreover, those with greater political information are more likely to have collected economic information about the situation of people “like them.” These findings have implications that extend to more general questions of democratic accountability. Findings from the economic voting literature have been used to suggest that voters may be easy to manipulate, and thus have limited ability to control politicians. For example, it has been suggested that end-year myopia can be exploited by incumbents pumping up the economy in the final year of their term to mask otherwise poor economic records (Abrams Reference Abrams2006; Achen and Bartels Reference Achen and Bartels2004). Moreover, if voters ignore their own personal economic information, they may be more reliant on the media for information used to evaluate governments (Hetherington Reference Hetherington1996), opening themselves to further manipulation. Yet our findings suggest that voters are not myopic and use their own economic information. This warrants a reduction in cynicism about voters’ rationality and ability to exercise the levers of democratic accountability.
An easy retort would be that our study considers Swedish citizens, who are different in a number of ways. However, previous scholars, and our own results, suggest that when it comes to economic voting, Swedes look remarkably like U.S. citizens—at least in conventional analyses. Thus, we find it more likely that the discordance between this work and the prior literature are due to better data, rather than vague cultural hypotheses. However, we acknowledge that analyses of finer-grained data in the U.S., or other countries, may produce far different results than what we find here.
We look forward to these analyses. For now, the only thing that is certain is that the increasing availability of personal income data promises to change our understanding of economic voting.
SUPPLEMENTARY MATERIAL
To view supplementary material for this article, please visit https://doi.org/10.1017/S0003055417000314.


 Open access