


Native American Mounds
The practice of mound building was widespread throughout eastern North America, with upward of 100,000 mounds documented. Early observers of these readily visible physical remnants of ancient cultures designated the continent's original inhabitants as the Mound Builders (Barnhart Reference Barnhart2015; Mallam Reference Mallam1976; Silverberg Reference Silverberg1968; Timmerman Reference Timmerman2020). Mound building so epitomized Native societies in the archaeological imagination that scholars referred to the most recent cultural stages or periods of eastern North America as Burial Mound I and II and Temple Mound I and II (Ford and Willey Reference Ford and Willey1941; Willey Reference Willey1966). We know now that Native Americans began building mounds as early as 3500 BC and that most mounds date to the Woodland and Late Prehistoric periods, approximately 500 BC–AD 1400 (Buikstra Reference Buikstra1988; Gibson Reference Gibson2019; Milner Reference Milner2004, Reference Milner and McManamon2009).
Native American mounds in eastern North America are mainly earthen structures. Some incorporate stone features or comprise mostly shell, but most mounds in the Mississippi River drainage and Great Lakes region are formed principally of redeposited soil or other unconsolidated mineral sediment. In this article, the term “mounds” will denote conical (circular, dome-shaped) structures as well as those with oval, linear, effigy, and truncated-pyramidal (platform) forms. We refer to other types of earthen structures—such as geometric or ditched enclosures—as “earthworks,” even though mounds, broadly speaking, are earthworks.
This article addresses detection of leveled mounds and assessment of their integrity using geophysical survey methods. Mounds and earthworks are highly susceptible to damage by agricultural practices. Land-leveling is an obvious cause, but normal farming methods such as plowing and cultivation also reduce their above-ground visibility (Limp Reference Limp1987; Schurr Reference Schurr1999). Damage by leveling and plowing does not only result from mechanized agriculture. Mounds also were flattened by horse-drawn slips and similar low-tech methods. Surface indications of thousands of mounds disappeared in agricultural fields in the nineteenth and twentieth centuries (Petersen Reference Petersen1984; Snead Reference Snead2018:243–244; Whittaker Reference Whittaker2020).
Most mounds are burial mounds. Nearly all carefully excavated conical, linear, and effigy mounds have produced human remains (Arzigian and Stevenson Reference Arzigian and Stevenson2003; Rosebrough Reference Rosebrough2011). Platform mounds, which are generally substructures for buildings, also may contain burials (Fairbanks Reference Fairbanks1956; Rowe Reference Rowe1958). As burial site protection has gained importance across North America, it is becoming vital to locate and preserve as many mounds as possible. It is also important to determine whether leveled or otherwise disturbed mounds retain any integrity and, potentially, human remains. A flattened mound is not necessarily a destroyed mound. Throughout eastern North America, interments were often placed in subterranean or “subfloor” tombs or pits over which the mound itself was built (Benn Reference Benn2009; Charles et al. Reference Charles, Van Nest, Buikstra, Boivin and Owoc2004; Van Nest Reference Van Nest, Charles and Buikstra2006; Van Nest et al. Reference Van Nest, Charles, Buikstra and Asch2001). To prepare a clean surface, topsoil often was removed from the area to be covered by a mound. Occasionally, a wooden structure was built and dismantled prior to construction of the mound, with posts extending into subsoil. Mounds often were built in stages composed of distinct layers of fill of differing color and texture. Because subfloor pits, prepared surfaces, substructures of buildings, and basal mound building stages often occur at depths below current plow zones, these features may be preserved when no surface relief exists. Our challenge is to find effective and efficient ways to detect such features.
Detecting Leveled Mounds
Indications of leveled mounds sometimes appear in aerial photography. Images made as early as the 1920s show mounds whose exposed fill contrasts with surrounding topsoil (Fowler Reference Fowler, Lyons and Hitchcock1977; Giardino and Haley Reference Giardino, Haley and Johnson2006). Recent aerial and space-based imagery also permits detection of plowed and leveled mounds in bare-earth settings or when differential vegetation growth allows identification of cultural features, such as through infrared imaging or thermography (Giardino and Haley Reference Giardino, Haley and Johnson2006). Ground cover frequently obscures visibility, however, and aerial-based remote sensing is often not sufficiently sensitive to detect small mounds or those with subtle soil signatures. Archaeologists can use lidar to detect damaged mounds, but lidar is of limited use in identifying earthworks less than 10 cm higher than the surrounding surface (Whittaker Reference Whittaker2020; Whittaker and Riley Reference Whittaker and Riley2012), so it can be difficult—if not impossible—to differentiate plowed-down mounds from undulations caused by plowing.
Here, we consider ground-based methods for detecting leveled mounds and associated features. Several geophysical survey methods are effective in locating subsurface anomalies (Clark Reference Clark1990; Horsley Reference Horsley, Scott and Kosslyn2015; McKinnon and Haley, ed. Reference McKinnon and Haley2017). Magnetometry is a useful method of assessing features located within 1–2 m of the surface because surveys can be undertaken quickly, returning precise and accurate results (Kvamme Reference Kvamme and Johnson2006a). Magnetic surveys are suitable for identifying archaeological features because several natural processes lead to magnetic variations in the ground that are exacerbated by human activities (Aspinall et al. Reference Aspinall, Gaffney and Schmidt2009; Clark Reference Clark1990; Kvamme Reference Kvamme and Johnson2006a). For instance, intense firing—as occurs when a hearth is burned, an earth oven is used to cook, or a structure is incinerated—produces magnetic contrasts, or anomalies, with surrounding deposits as the heated features undergo thermoremanent magnetization. Other features are formed from materials that differ in their magnetic susceptibilities from adjacent soil and sediments. The magnetization of such features is induced by the Earth's magnetic field rather than remanent. For example, pits and ditches often exhibit moderately high magnetic signatures. When their use ends, they are filled, either intentionally or through erosion, with magnetically enriched soils and refuse containing fired objects and organic waste. Magnetometers do not discriminate induced and remanent forms of magnetism. Instead, they measure their sum.
Magnetometry is revolutionizing our understanding of archaeological sites and landscapes. After decades of application in Great Britain, magnetic surveys in eastern North America have identified ancient dwellings, hearths, storage pits, walls, and other features preserved beneath agricultural fields. Numerous examples can be cited. In western Illinois and eastern Iowa alone, recent studies include Barrier and Horsley (Reference Barrier and Horsley2014), De Vore (Reference De Vore2014), Friberg (Reference Friberg2018), Horsley and colleagues (Reference Horsley, O'Gorman and Conner2015), and Wilson and Pike (Reference Wilson and Pike2015). This work suggests that subsurface features associated with leveled mounds should also be detectable.
Mound studies employing geophysical methods in eastern North America mainly address off-mound features as well as the internal features and structure of extant (although often damaged) mounds rather than leveled mounds (e.g., Betts and Stay Reference Betts and Stay2017; Bigman and Seinfeld Reference Bigman, Seinfeld, McKinnon and Haley2017; Britt et al. Reference Britt, Hargrave and Simms2002; Burks and Locke-Rogers Reference Burks and Locke-Rogers2015; Dalan Reference Dalan and Johnson2006; Hammerstedt et al. Reference Hammerstedt, Lockhart, Livingood, Mulvihill, Regnier, Sabo III, Samuelson, McKinnon and Haley2017; Hargrave et al. Reference Hargrave, Britt and Reynolds2007; Kassabaum et al. Reference Kassabaum, Henry, Steponaitis and O'Hear2014; Lynott Reference Lynott1997, Reference Lynott2015; McKinnon and Haley Reference McKinnon and Haley2017; Messerole Reference Messerole2017; Zimmer-Dauphinee Reference Zimmer-Dauphinee, McKinnon and Haley2017). Studies of Havana Hopewell Middle Woodland mound sites in the Illinois and Mississippi River valleys are no exception, employing geophysical survey primarily at extant rather than leveled earthworks. Magnetometry and other methods have discerned internal features of mounds at four sites in the lower Illinois River valley (Herrmann et al. Reference Herrmann, King and Buikstra2014; King et al. Reference King, McKinnon, Herrmann, Buikstra, Thornton, McKinnon and Haley2017; McKinnon et al. Reference McKinnon, King, Buikstra, Thornton and Herrmann2016). Likewise, McCullough's (Reference McCullough2018) geophysical survey of the extant Nadine Mound Group (11HE69) on the Mississippi River bluffs in western Illinois detected central (presumably mortuary) features and possible accretional mound stages. On a low terrace in the Mississippi River valley in northeast Iowa, Whittaker and Storey's (Reference Whittaker and Storey2008) ground-penetrating radar study of 101 extant Middle and Late Woodland mounds at the Sny Magill Mound Group (13CT18) identified internal anomalies in most mounds.
Geophysical survey has detected remnants of plowed mounds at several Woodland and Late Prehistoric sites. At the Goodall site (12LE9), a Middle Woodland mound group in northwest Indiana (Mangold and Schurr Reference Mangold, Schurr, Charles and Buikstra2006; Quimby Reference Quimby1941), plowing of its sandy soil led to near-obliteration of most mounds. Magnetic and resistivity survey of several 10–20 cm elevations, followed by test excavations, confirmed that they were mound remnants. The most distinct signature is a circular, 17 m diameter ring of low magnetism surrounding a small, central, high-magnetic anomaly (Schurr Reference Schurr1999: Figure 21). At the Hollywood Mounds in Mississippi, magnetic survey identified remnants of Mississippian houses that once sat atop small platform mounds that had been reported in the early twentieth century, many of which were subsequently plowed down to near invisibility (Haley Reference Haley2014).
Surveys of mounds with no remaining surface expression are rare. De Vore's (Reference De Vore2009) geophysical survey at Effigy Mounds National Monument in northeast Iowa identified likely outlines of several previously mapped mounds (13AM82) whose surface expressions had disappeared, as well as several unmapped mounds. At the nearby Turkey River Mound Group (13CT10) on a Mississippi River bluff top, geophysical survey detected several previously mapped but plowed-down mounds: “Despite years of cultivation at the site, the gradiometry survey results show that a portion of the mounds remains well intact at an undisturbed level below the plow zone” (Mathys Reference Mathys1997:28). At Cahokia, Illinois, conductivity survey rediscovered leveled mounds and other features (Dalan Reference Dalan1991). Conductivity survey at the Deer Creek site (34KA3) in Oklahoma also detected possible signatures of previously recorded leveled mounds, although the mounds may have been midden mounds rather than burial mounds (Bevan Reference Bevan1983:49). At the latter two sites, surveys consisted of single transects and profiles rather than areal coverage showing possible mound plans or internal features. Skousen (Reference Skousen2019) sought traces of plowed-down Mississippian platform mounds through magnetic survey at the Otter Pond site (11LW9) in southeastern Illinois. Wall-trench domestic structures showed up well, but the leveled mounds were not evident.
Regarding earthworks, resurveys of Ohio Valley Hopewell and Adena enclosures are refining legacy maps, finding new features, and recording new sites in previously unsurveyed tracts. Most of the newly detected earthworks are geometric enclosures whose surface evidence was plowed away but whose highly magnetic infilled ditches contrast well with surrounding subsoil (Burks and Cook Reference Burks and Cook2011; Henry et al. Reference Henry, Shields and Kidder2019; Horsley et al. Reference Horsley, Wright and Barrier2014; Wright Reference Wright2014). Few of these leveled earthworks appear in aerial imagery, and nearly none in lidar coverage. Magnetic surveys also have identified infilled ditch enclosures at Plains sites (Drass et al. Reference Drass, Vehik and Perkins2019; Kvamme Reference Kvamme, Ahler and Kay2007a).
Magnetometry survey located traces of a plowed-down octagonal enclosure at the McKinney site (13LA1), adjacent to the Havana Hopewell Toolesboro Mounds (13LA29) in southeast Iowa (De Vore Reference De Vore2015). The embankment walls had been more than 2 m high, but they were flattened by farming and are now invisible from the air and barely discernible using lidar (Newhall Reference Newhall1841; Riley and Tiffany Reference Riley and Tiffany2014). The embankment apparently lacked the distinctive ditches that facilitate detection of other plowed earthworks. The magnetic survey, however, identified distinctive concave outlines as originally mapped for each segment of the enclosure—a detail that does not appear in the lidar study.
Case Study: Gast Farm
Gast Farm Site Background
Building on the foregoing studies, we assess the effectiveness of magnetometry for detecting leveled mounds and associated features by summarizing recent work at the Gast Farm site (13LA12) in southeast Iowa (Green Reference Green2018; Wiewel and De Vore Reference Wiewel and De Vore2018). Gast Farm is a 12 ha site situated atop and within an alluvial fan in the Mississippi River valley (Figure 1). The surface soils (loams with A-Bt and A-Bw horizons) have been relatively stable for about the past 2,300 years, except for cultivation of the upper approximately 30 cm (Bettis et al. Reference Bettis, Baker, Green, Whelan and Benn1992; Brown Reference Brown1988). Controlled surface collections and excavations from 1990 through 1994 showed that Middle Woodland material and features (Havana Hopewell variant, ca. 50 BC–AD 250) occur in the eastern part of the site, and a Late Woodland village (Weaver variant, ca. AD 350–500) occupies the western part. Early Woodland material (Black Sand variant, ca. 450–100 BC) clusters in the central part and occurs in low-density scatters throughout the site (Benn and Green Reference Benn, Green, Emerson, McElrath and Fortier2000; Bettis et al. Reference Bettis, Baker, Green, Whelan and Benn1992; Dunne Reference Dunne2002; Green and Wallace Reference Green and Wallace1991; Johnson Reference Johnson2002; Neverett Reference Neverett2001; Weitzel and Green Reference Weitzel and Green1994).

A large mound existed in the center of the site. In the 1950s, landowner Dan Gast tried to interest archaeologists in the mound, but as a result of mutual misunderstandings, Gast leveled the mound. During earthmoving, he recovered typical Havana Hopewell ceremonial objects: copper axes, platform pipes, and sheet mica (Office of the State Archaeologist [OSA] accession 7210). The mound had been well known locally, with reports suggesting it measured approximately 30 m in diameter and up to 3 m in height. We have found no photographs of the mound. Its former location appears on a sketch map made around 1970 that includes the note “mound is gone can still see the site” (Royster ca. Reference Royster1970), indicating that the locus of the leveled mound exhibited distinctive surface soil characteristics.
Aerial imagery (Figure 2; Supplemental Figure 1; Supplemental Table 1) and surface observations show that the mound's location is marked by light-colored soil that contrasts with the surrounding surface. Some photos also show dark-colored, organically enriched soil indicating the Middle Woodland and Late Woodland occupation areas. Although the light soil indicates the mound's location before and after it was leveled, its outline and dimensions cannot be discerned in any photo (see Supplemental Text 1). Low-altitude oblique color and color infrared air photos show the light-colored flattened mound locus as well as several broad, linear bands of light-colored soil (Figure 3). Figure 4 is an orthophoto derived from rectifying and georeferencing the oblique photos (see Supplemental Text 1). The latter image helps us to locate the mound area and linear bands but does not permit determination of mound outline or dimensions. We initially interpreted the linear bands as possible remnants of geometric earthworks (Whittaker and Green Reference Whittaker and Green2010). This possibility contributed to the research design for the geophysical survey.

Figure 2. Vertical panchromatic air photo of Gast Farm, October 1949. Mound location indicated by light-colored soil (arrow). (Source: Photo A000700080454, Army Map Service; U.S. Geological Survey 2020).

Figure 3. Oblique Kodachrome air photo of Gast Farm. View to north. Closely spaced north-south lines are pathways 10 m apart made during the controlled surface collection. Light-colored bands were thought to be possible earthworks. (Photo taken by William Green, May 1990.)

Figure 4. Orthorectified air photo of Gast Farm from digital scans of images from the 1990 oblique photo series. (Image created by Adam Barnes, University of Arkansas, using Agisoft PhotoScan. Used with permission.)
Magnetometry Survey
To ascertain whether the mound locus retained subsurface integrity and to compare it to other Havana Hopewell mounds, we sought details about mound form and associated features. Research questions also included identifying features associated with the habitation areas and the possible earthwork. Consequently, the goal of the Gast Farm geophysical survey was to document subsurface features that would assist in determining (1) the nature and extent of the mound and possible earthwork complex, and (2) the layouts of the Woodland residential areas. During a two-week period in November 2016, we surveyed 216 20 × 20 m grids, totaling an area of 86,400 m2. The survey excluded only a small portion of the Late Woodland settlement and the southernmost part of the possible earthwork. Ideally, we would have conducted the geophysical survey prior to the 1990–1994 fieldwork, but funding limitations precluded such work.
Wide-area geophysical surveys can yield comprehensive views of site content, feature distribution and site organization, and spatial relationships (Kvamme Reference Kvamme2003). Multi-instrument investigations are useful because different devices provide unique and complementary information (Kvamme Reference Kvamme2006b, Reference Kvamme, Wiseman and El-Baz2007b; Kvamme, Ernenwein, et al. Reference Kvamme, Ernenwein, Hargrave, Sever, Harmon, Limp, Howell, Koons and Tullis2006; Kvamme, Johnson, and Haley Reference Kvamme, Johnson, Haley and Johnson2006). The investigation at Gast Farm, however, was limited to a magnetometry survey because of (1) the method's sensitivity to magnetic variations resulting from specific anticipated features such as hearths, earth ovens, and pits, and (2) its successful use at similar and nearby sites (De Vore Reference De Vore2009, Reference De Vore2014, Reference De Vore2015). The method's rapid measurement rate, even at a high sampling density, was crucial given the broad scope of the project. Another advantage of magnetometry is that it is repeatable unless magnetic anomaly sources are removed. As a passive method that only measures magnetic field strength, it is not affected by changes in soil moisture as is the case with active systems, including earth resistance, ground-penetrating radar, and electromagnetic induction. These other methods could produce equally impressive and different results, but comparable surveys with these techniques would require greater cost and time investment, neither of which were possible. Furthermore, magnetometry survey was ideal given the field's uneven ground surface and abundant corn stubble. This is because unlike the other instruments, magnetometers are carried above the ground and vegetation. Prior to any future excavations based on the results of our investigation, however, it would be prudent to perform targeted surveys with one or more of these instruments. Such surveys would yield additional insight about the construction and use of the features revealed by magnetometry. For background on magnetism and magnetic survey in archaeology, and for details about the survey of the habitation areas at Gast Farm, see Wiewel and De Vore (Reference Wiewel and De Vore2018). Here, we present information related to the mound and earthwork investigation.
We used two Bartington Grad601-2 fluxgate magnetic gradiometers, a magnetometer configuration with vertically separated sensors, simultaneously during the survey. With the range set to 100 nT, the instrument is capable of measuring magnetism with an effective resolution of 0.03 nT (Bartington Instruments 2020). Whether a feature can be detected with the Grad601-2 (or any magnetometer) depends on several factors, among them its size, burial depth, and magnetic susceptibility contrast with surrounding deposits (Aspinall et al. Reference Aspinall, Gaffney and Schmidt2009; Clark Reference Clark1990; Kvamme Reference Kvamme and Johnson2006a). Given the instrument's 1 m sensor separation, it is sufficiently sensitive to detect features such as hearths, earth ovens, and pits to burial depths of about 1.5 m.
The raw field data can be understood as the sum of multiple components, including internal sensor noise; operator induced defects; anomalies related to erosional channels, plow marks, and ferrous metal; and archaeologically significant anomalies that represent fired features, pits, and more. Arriving at an archaeological interpretation of the magnetic data involves a processing workflow designed to minimize contributions of the nonarchaeological components and enhance the visual prominence of features. To achieve this result, we applied several functions using TerraSurveyor, a computer application designed by DW Consulting for archaeological geophysics. These tools—including despike, destripe, and destagger processes—are standard for magnetic instruments. Each function is described in greater detail by Kvamme (Reference Kvamme and Johnson2006c). In general, we applied them to the 20 × 20 m grids as necessary to reduce noise caused by nonarchaeological sources (e.g., modern ferrous debris) and instrument or operator errors. We subsequently interpolated the data to produce a raster with uniform resolution (i.e., the survey sampling density of 0.125 × 0.5 m was interpolated to 0.125 × 0.125 m), which provides a more continuous and visually appealing result. A low-pass filter was applied to smooth the raster dataset and further reduce noise.
Next, we used Esri ArcGIS to georeference the processed magnetic dataset to the survey grid, the coordinates of which were measured with differentially corrected GPS. Registering the raster dataset in this way facilitated visual comparison of the survey results with the remote sensing datasets mentioned previously and the controlled surface collection data, an approach that aided interpretation of the magnetic data. GIS methods discussed below were used to identify and discriminate anomalies with different characteristics across the surveyed area. Vector shapefiles were created to distinguish each anomaly type, which helped us better understand the distribution of archaeological features across the site, particularly those clustered near the habitation areas and the reported mound. (See Supplemental Text 1 for additional details regarding data collection and processing.)
Results
The magnetic findings at Gast Farm indicate hundreds of anomalies of likely archaeological significance, such as midden-filled pits and fired features such as hearths and earth ovens (Figure 5). Importantly, the results clarify the layouts of the Middle Woodland and Late Woodland settlements in the eastern and western parts of the site, particularly their roughly circular forms and the presence of central plazas at both locations. The results also indicate a paucity of apparent habitation-related features in the central part of the site (Green Reference Green2018; Wiewel and De Vore Reference Wiewel and De Vore2018). Regarding the focus of this article, the magnetic data detected no trace of geometric earthworks but show that several mounds, rather than just one, were present near the center of the site. The data also provide information regarding mound-related features and permit estimation of the mounds’ original diameters, heights, and volumes, which allow insight into the origin of the earthwork-like surface discolorations.

Figure 5. Results of gradiometry survey at Gast Farm. (Air photo source: Esri, DigitalGlobe, GeoEye, Earthstar Geographics, CNES/Airbus DS, USDA, USGS, AeroGRID, IGN, and the GIS User Community.)
Magnetic Anomaly Identification
Anomaly interpretation relies on pattern recognition and familiarity with the suite of features one may encounter at a given archaeological site as well as awareness of magnetic theory and consideration of the likely magnetic properties of each feature type (Kvamme Reference Kvamme and Johnson2006c, Reference Kvamme and Sullivan2008). Anomalies are generally identified manually based on visual inspection, which is a tedious, time-consuming, and inconsistent process. As the scale of remote sensing investigations has increased, semiautomated and automated approaches to feature and site detection have been developed for aerial and satellite imagery (De Laet et al. Reference Laet, Véronique and Waelkens2007; Lasaponara et al. Reference Lasaponara, Leucci, Masini, Persico and Scardozzi2016; Trier et al. Reference Trier, Larsen and Solberg2009), airborne lidar data (Davis et al. Reference Davis, Sanger and Lipo2019; Schneider et al. Reference Schneider, Takla, Nicolary, Raab and Raab2015; Trier and Pilø Reference Trier and Pilø2012; Trier et al. Reference Trier, Zortea and Tonning2015, Reference Trier, e, Cowley and Waldeland2019; Verhagen and Drǎguţ Reference Verhagen and Drǎguţ2012), and ground-based geophysical data (Panagiotakis et al. Reference Panagiotakis, Kokinou and Sarris2011; Pasolli et al. Reference Pasolli, Melgani and Donelli2009; Verdonck Reference Verdonck2016). Despite potential benefits, use of such methods for archaeological applications remains infrequent (Bennett et al. Reference Bennett, Cowley and De Laet2014; Opitz and Herrmann Reference Opitz and Herrmann2018). Although not automated, we used GIS techniques to quantitatively differentiate magnetic anomaly types, an approach that adds a level of objectivity and consistency while maintaining the sensitivity and flexibility of a standard visual inspection.
Among the magnetic anomalies are hundreds with dipolar forms, or adjacent high-magnitude positive and negative poles (Figure 5). Such anomalies are characteristic of near-surface ferrous debris. Although the densest cluster occurs near the extant farm residence, dipolar anomalies are dispersed across the field—a pattern consistent with the field's agricultural use for many decades. To identify these anomalies, separate layers with threshold values above 2.5 nT and below −2.5 nT were created by reclassifying the magnetic dataset. Although the range between these threshold values includes some archaeological features and other anomaly sources, we found them best for discriminating background noise (i.e., sensor noise, operator error, and most soil-related anomalies). Anomalies that exceed these threshold levels are more readily explainable as fired features and pits as well as anomalies caused by eroded topsoil and ferrous metal. After the threshold layers were created, a 0.25 m buffer was applied to both the positive and negative vector shapefiles so that the adjacent poles of most dipolar anomalies would overlap. A Boolean AND operator was then used to detect their overlap. Still, some dipolar anomalies with weakly magnetic negative poles were only identified by reviewing the magnetic data visually. A smaller number of dipolar anomalies also appeared to indicate fired features. Each exhibits a circular positive pole about 0.5–3.0 m in diameter and a magnitude approaching 20 nT, with a diffuse, negative pole on the north side. Vector polygons associated with closely spaced positive and negative anomalies were subsequently merged to create an interpretive map of dipolar anomalies or metal debris.
Although this process is straightforward, differentiating positive anomalies of archaeological significance is more difficult. Whether they are caused by archaeological, natural, or other sources, the positive anomalies that result appear much the same. They generally look “monopolar” in form, but they too are dipolar like those described previously. However, because of the Earth's magnetic field inclination, which is nearly vertical at our latitude, the negative poles are located farther from the gradiometer and often go undetected. To distinguish likely archaeological features from other sources, we used some additional image processing and GIS techniques.
For visualization, we replaced the most robust magnetic measurements—dipolar anomalies—with the data mean because they obscure weaker but more important anomalies. To achieve this result, polygon features representing dipolar anomalies were converted to a raster and a reclassify function was used to convert their extreme values to the average of the magnetic dataset (x̄ = −0.04). A cell-by-cell comparison of the resulting raster and the complete magnetic dataset was then performed with a logical OVER operator. The output of the operation consists of a raster similar to the initial magnetic dataset, although extreme magnetic values associated with dipolar anomalies have been replaced by the mean, yielding a clearer view of more relevant anomalies (Figure 6).
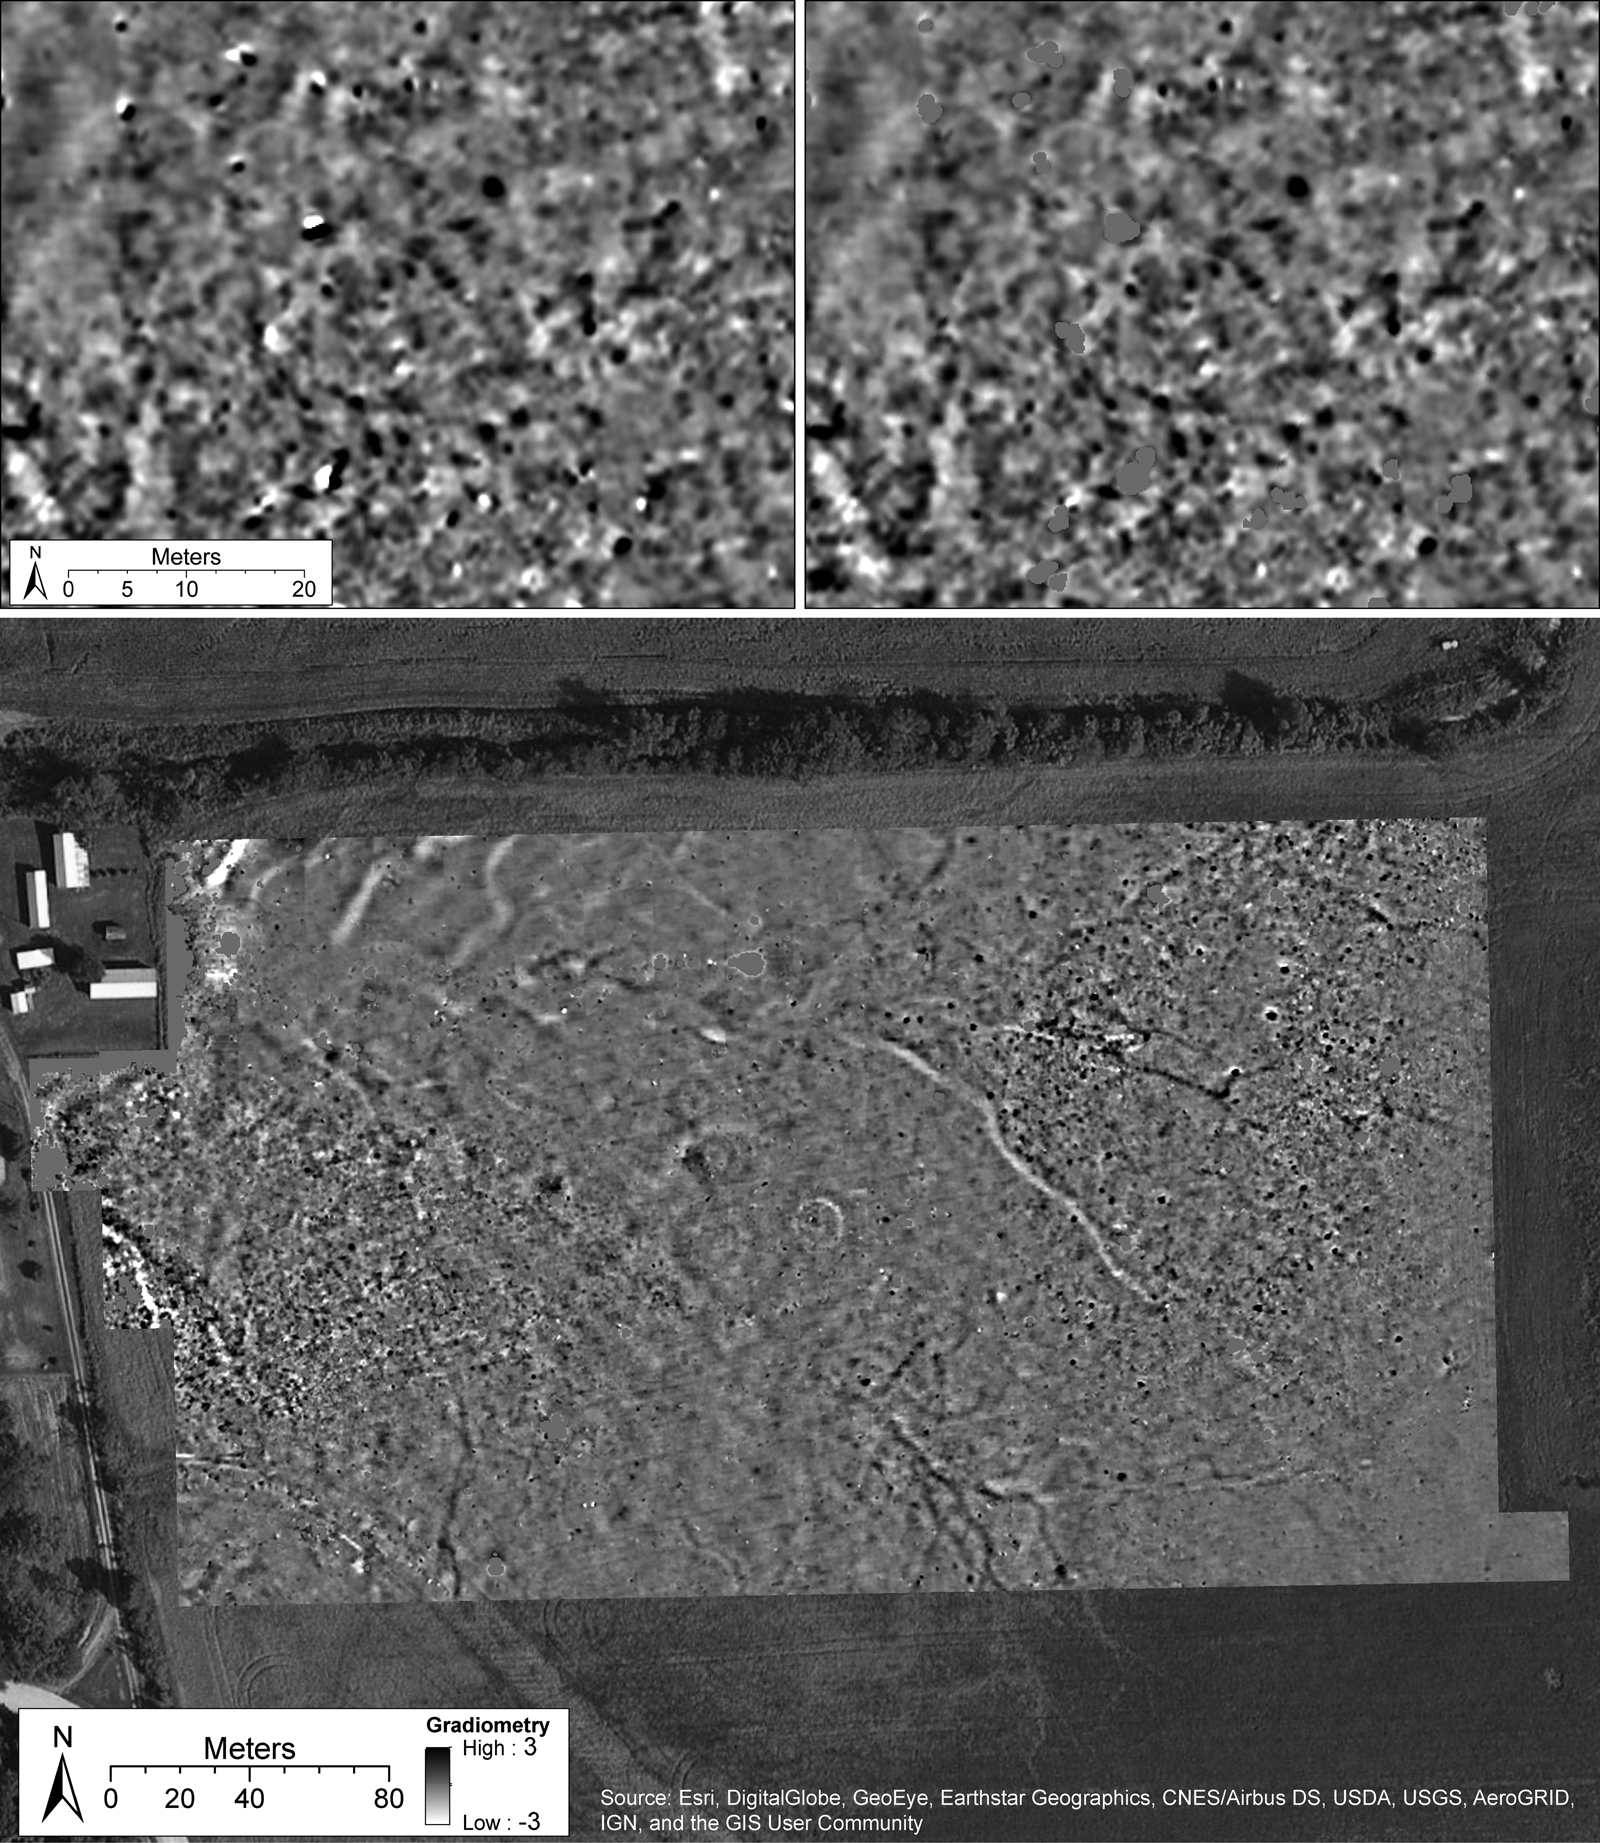
Figure 6. Close-up view of the magnetic survey results (upper left) and the same image after dipolar anomalies have been replaced with the data mean (upper right). Compare the complete magnetic results (bottom) with Figure 5 to better understand the significance of this procedure. (Air photo source: Esri, DigitalGlobe, GeoEye, Earthstar Geographics, CNES/Airbus DS, USDA, USGS, AeroGRID, IGN, and the GIS User Community.)
Plow marks are another source of noise we addressed using image processing algorithms. The diagonal southwest-northeast scars derive from periodic chisel-plowing at an approximately 15° angle to the planting rows. Because the plow marks are regularly oriented and spaced, a fast Fourier transform can isolate and remove the frequency associated with them. In this case, the plow marks are too subtle to be identified in the complete dataset. Visualization of important archaeological anomalies improves, however, when limiting this processing step to smaller areas where the marks are especially prominent (Figure 7).

Figure 7. Example of magnetic survey results before (left) and after (right) replacing dipolar anomalies with the data mean and reducing plow marks using Fourier methods.
Finally, we used a reclassify function to create a separate layer with a threshold value of 2.5 nT to illustrate positive anomalies characteristic of archaeological features such as earth ovens, hearths, and pits. In this instance, however, dipolar anomalies and anomalies associated with erosional channels, visible in both the magnetic results and aerial photographs, were omitted. At the same time, anomalies representing likely fired features that in fact appear dipolar in form were included among the vector polygons interpreted as features. This quantitative approach to interpretation undoubtedly misses some weakly magnetic archaeological features, although it was sufficiently accurate to detect the loci and form of the Middle and Late Woodland occupations, which were documented independently by controlled surface collections. Additionally, with this comprehensive interpretation, we were able to focus our attention to other areas of the site and visually identify subtle magnetic differences related to mounds.
Earthwork
Although light-colored bands of soil visible in aerial photographs suggested the presence of a potential geometric earthwork (Whittaker and Green Reference Whittaker and Green2010), the magnetic data evince no hint of an earthwork (Figure 6). Although cultivation activities would have likely disturbed the supposed earthwork in recent decades, it seems unreasonable to suggest that all traces of a feature of such extent would be removed. Complete obliteration of an earthwork's magnetic signature is especially unlikely in view of the magnetic identification of the plowed-down earthwork at the McKinney/Toolesboro complex 17 km south of Gast Farm (De Vore Reference De Vore2015).
Mounds
An unexpected result of the survey was evidence for not one but several mounds, indicated by concentric rings of positive and negative magnetism (Figure 8). Elements of mound construction and use remain apparent despite decades of cultivation. An alternating pattern of positive and negative magnetism, characterizing most of the mounds, relates to their construction using sediments of varying magnetism—fills or strata of magnetically enriched organic sediment layered or interdigitating with fills or strata of low magnetic sediment (e.g., subsoil). Moreover, the signatures indicate that mound floors or basal fill layers remain intact below the plow zone, as does a central feature—presumably a crypt—in each mound. Although some magnetic signatures near the mounds represent plow-zone anomalies (e.g., subtle diagonal plow marks [Figure 7]), the clear patterning of positive and negative magnetism indicates that subsurface elements of the mounds retain their integrity.

Figure 8. Magnetic gradiometry results (left) and interpretations (right) of the Gast Farm mound group.
Figure 9 shows how discrete fill zones and a subfloor burial pit can retain diagnostic magnetic properties and be detectable after a mound is leveled. Although architectural variation exists, Havana Hopewell mounds often feature a characteristic alternation of organic and less organic fill layers that overlie a burial chamber and, occasionally, a prepared basal surface (e.g., Charles et al. Reference Charles, Leigh and Buikstra1988; Herold Reference Herold1971; Walker Reference Walker and Deuel1952). Deposits overlying the central crypt might represent primary mounds, ramps, capping episodes, sod blocks, or other types of fill or features, but all are allogenic (obtained off-site), derive from different sources (Van Nest Reference Van Nest, Charles and Buikstra2006; Van Nest et al. Reference Van Nest, Charles, Buikstra and Asch2001), and have different magnetic properties.
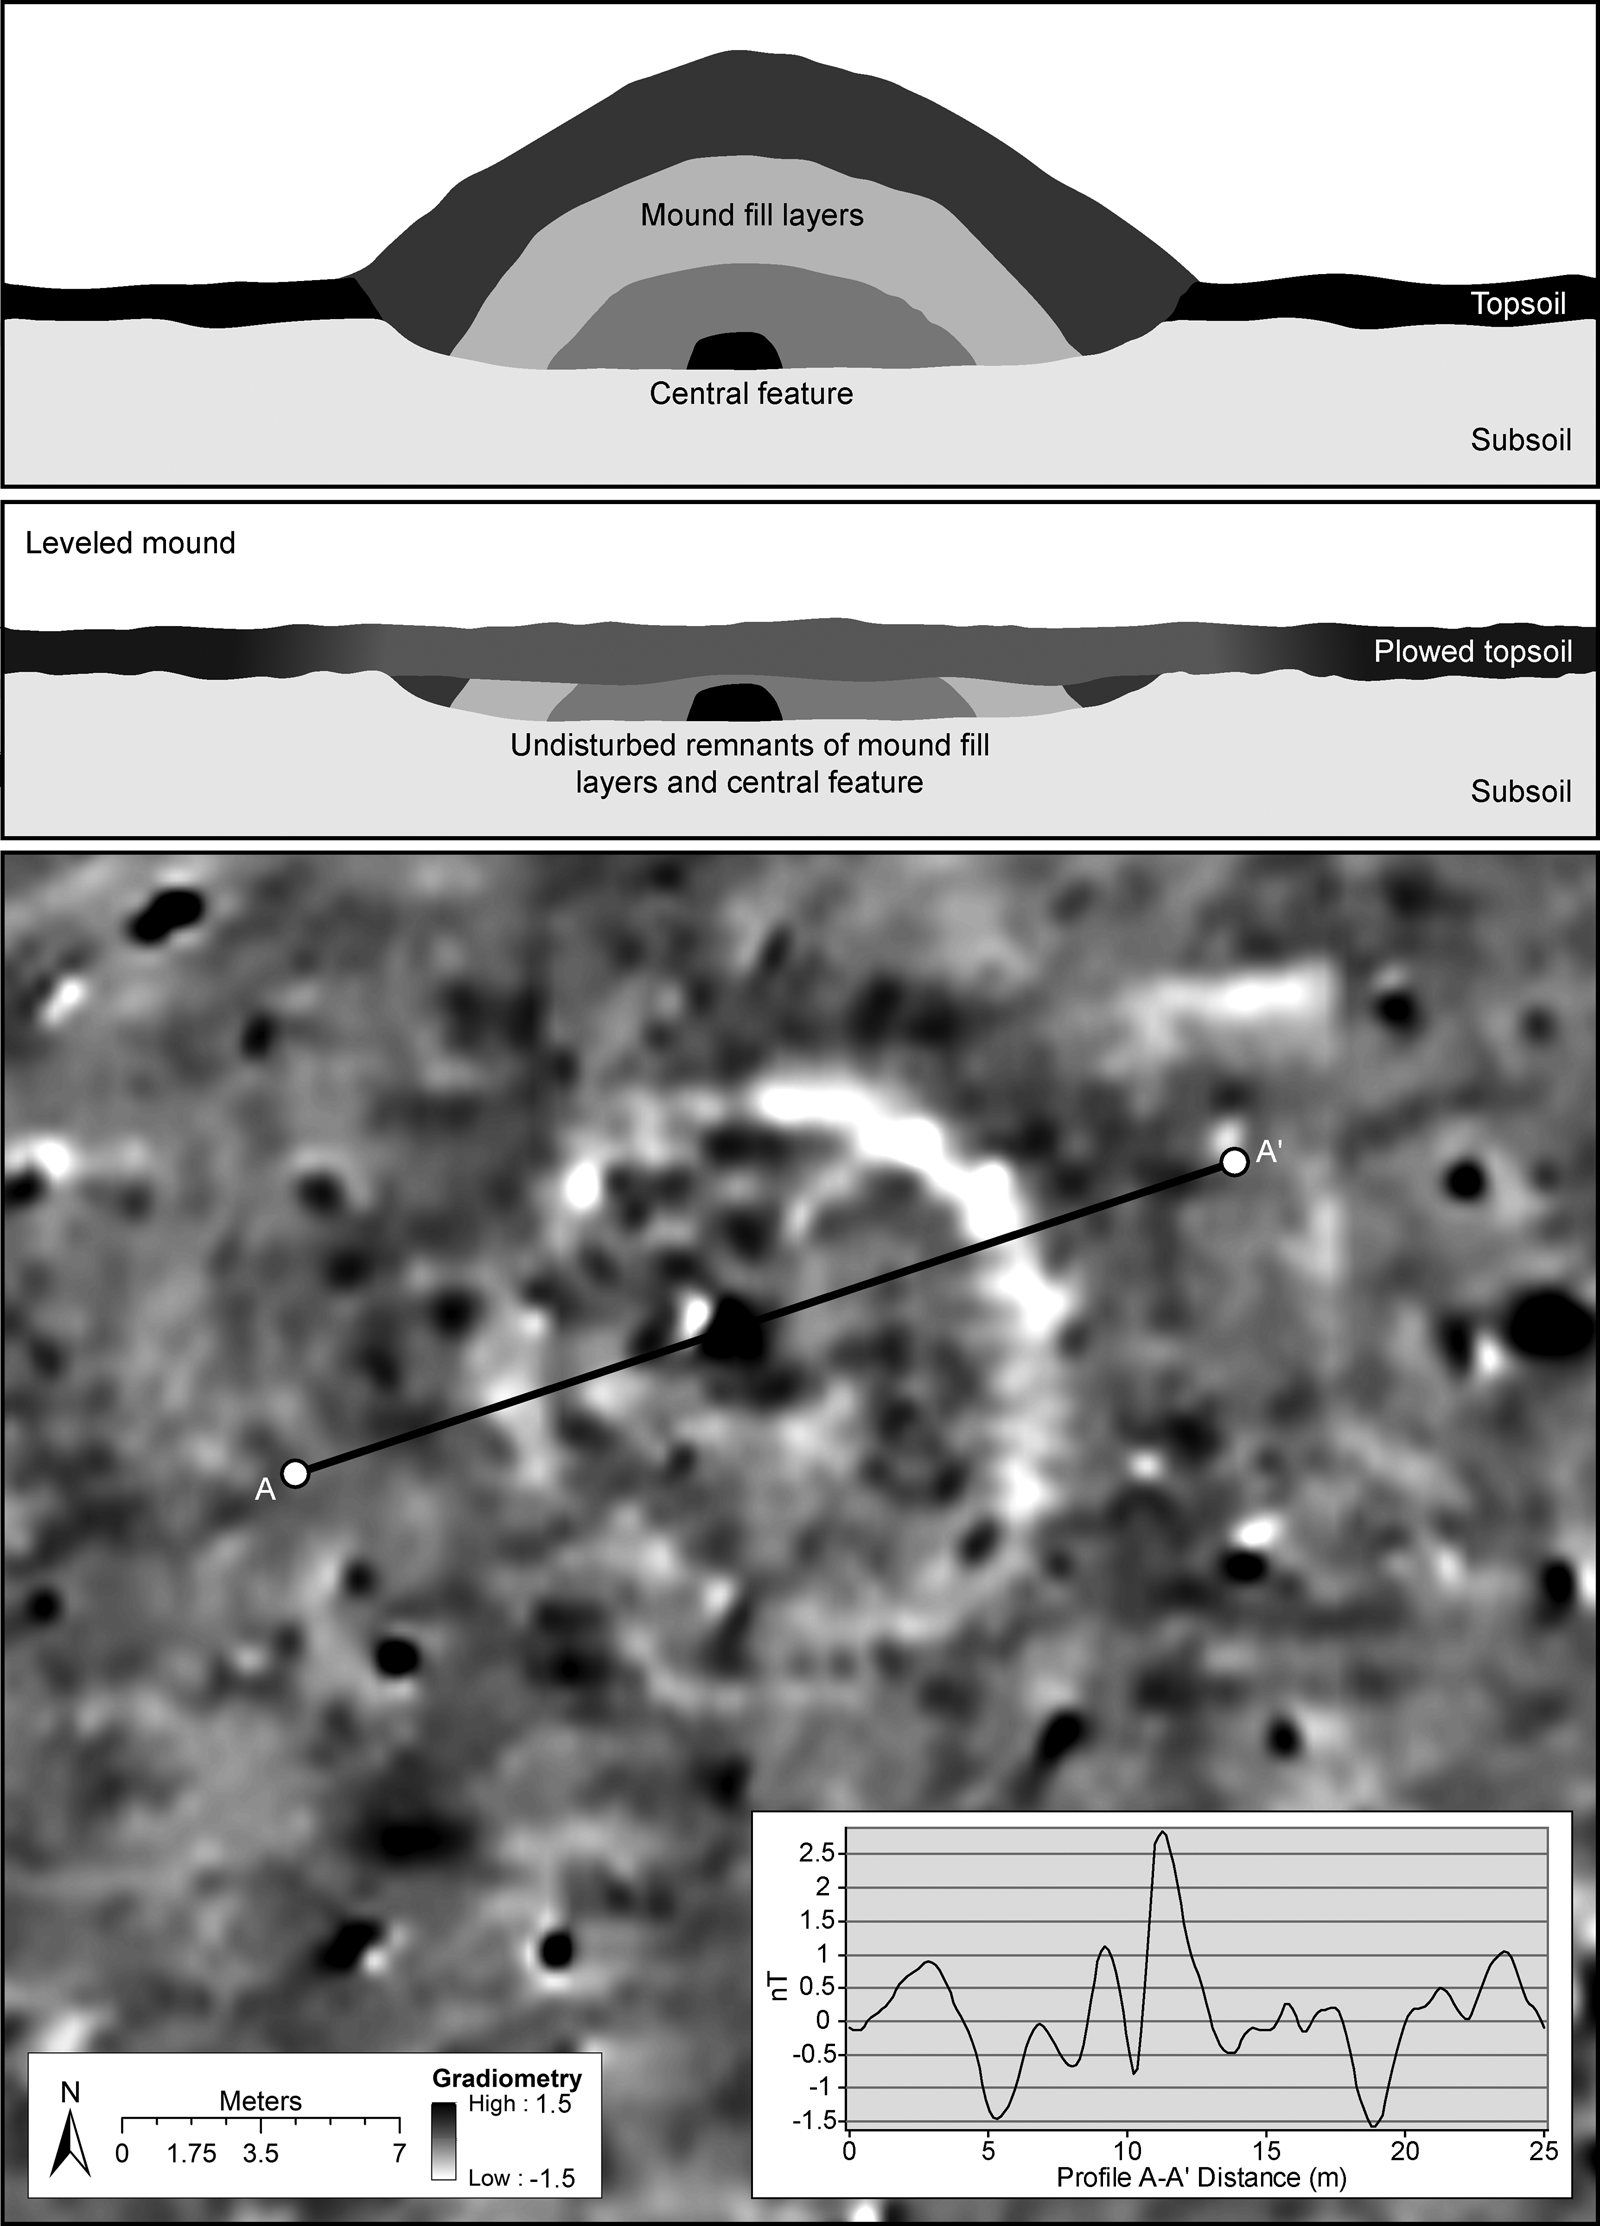
Figure 9. Top: conceptual profile of mound with subfloor burial chamber and alternating fill zones of high (dark) and low (light) magnetism. Middle: same mound plowed down, with burial chamber and traces of alternating high and low magnetic fill zones below the plow zone. Bottom: magnetic results of Mound 5 showing concentric high and low zones and central feature.
The mound group at Gast Farm consists of at least six mounds. The most conspicuous mound (Mound 5) is represented by a ring of negative magnetism approximately 15 m in diameter (Figure 9, bottom). This anomaly is encircled by a subtle halo of weakly positive magnetism with a diameter of about 22 m. A positive anomaly near the center of the mound probably signifies a burial chamber.
The largest circular anomaly (Mound 4, ca. 27 m in diameter) corresponds to the locus of the light-colored surface soil that apparently represents the base of the large mound leveled in the 1950s (Figures 2 and 8). Mound 4 is the closest in diameter to that mound, as reported by early observers. As with Mound 5, Mound 4 also exhibits concentric rings of higher and lower magnetism and a possible central crypt.
Mounds 1, 2, 3, and 6 are also roughly circular in plan, and they contain central features (Figure 8). The perimeter of Mound 1 is marked by a ring of negative magnetism. Mound 2 contains the clearest evidence of a central burial chamber, indicated by a positive anomaly nearly 3 m in length and about 1.5 m wide. Mound 3 differs in form and may represent an elongated or biconical mound structure as at the Kamp Mound Group (11C12) in Illinois (McKinnon et al. Reference McKinnon, King, Buikstra, Thornton and Herrmann2016). Kamp Mound 7 may consist of either two sequentially constructed tomb complexes that were capped simultaneously or a primary tomb complex with an intrusive tomb and extended ramp that were later capped. Whether Mound 3 at Gast Farm represents similar construction activities is unclear. The most apparent element of the mound is an approximately 12 m diameter circle, perhaps the primary or initial mound construction (Mound 3A), represented by a positive magnetic anomaly. A diffuse, weakly magnetic anomaly is located at its center, and this likely indicates a tomb. The mound appears to have been rebuilt or elongated nearly 5 m to the east (Mound 3B), but no secondary or intrusive tomb is noticeable. It is possible that the order of rebuilding was the opposite, given that the Mound 3A anomalies appear to be superimposed upon 3B. Mound 6 exhibits a wide ring of positive magnetism surrounding an interior that consists mostly of negative magnetic soil with a pronounced high-magnetic feature slightly offset north of the mound's center.
Faint traces of other possible mounds exist, but these six are the most clearly evident from examination of the magnetic data. The central features, which we suspect are crypts with burials, could instead represent looters’ pits that were backfilled with soil of higher magnetism. This is unlikely, however, because the fill of looters’ pits would be more heterogeneous, with mixed topsoil and mound fill. Test units excavated elsewhere on the site during the 1991–1994 field schools serve as useful analogs. Backfilled with mixed soil, they are difficult or impossible to discern in the magnetic data.
The mound group locus coincides with the only portion of Gast Farm that has both a surface concentration of Early Woodland pottery and few Middle or Late Woodland ceramics. Early Woodland artifacts in the mound locus might have been included in fill obtained from nearby habitation deposits. Alternatively, Middle Woodland people may have deliberately built the mounds on an earlier occupation area, albeit one with a low density of pit features.
Mound Height and Volume
If the outermost edge of each mound's magnetic signature represents the approximate edge of the mound before it was leveled, then comparisons with documented mounds allow us to estimate each mound's original height and fill volume. Because much of the mound fill at Gast Farm consists of light-colored sediment (as shown by Mound 4 surface soil and as suggested by negative magnetism within the mounds), knowing the approximate volume of fill displaced from the mounds might help clarify the origin of the light-colored bands thought to have been earthworks.
Several assumptions underlie the method we use to estimate mound height and volume: (1) the maximum diameter of each mound's magnetic signature approximates the mound's actual diameter, (2) the original form of each mound approximated a spherical cap (i.e., a dome), and (3) height-diameter relationships of nearby mounds can be used to estimate those relationships for the Gast Farm mounds. Assumption 1 is based on the observation that geophysical surveys of extant mounds show concordance between observed and magnetically surveyed mound edges (e.g., McKinnon et al. Reference McKinnon, King, Buikstra, Thornton and Herrmann2016), although we may underestimate mound diameters because final capping episodes probably extended mound boundaries beyond the edges of detectable sub–plow zone magnetic signatures. Assumption 2 recognizes that although many mounds have tapered rather than dome-like profiles, tapering is slight on minimally disturbed mounds (e.g., Charles et al. Reference Charles, Leigh and Buikstra1988; Herold Reference Herold1971; Walker Reference Walker and Deuel1952). Assumption 3 notes that although nineteenth-century mound measurements are rarely as precise as one would like, if a clear relationship exists between height and diameter among undisturbed mounds locally, there is no reason to suspect the Gast Farm mounds would deviate from that pattern.
In the late nineteenth century, enthusiasts affiliated with the Davenport and Muscatine Academies of Science recorded hundreds of mounds in Iowa and Illinois. Their reports constitute the only records of numerous mounds later leveled by plowing. Davenport Academy members measured the diameters and heights of 24 mounds located within 3 km of Gast Farm, nearly all of which are no longer extant (Blumer Reference Blumer1883; Gass Reference Gass1883). Diameters were measured to an accuracy of 5 ft. (1.52 m) and heights to an accuracy of 0.5 ft. (0.15 m) (Supplemental Table 2). Surface-area measurements would be preferable to heights in calculating volume, but they are not available for these leveled mounds. Figure 10 illustrates the relationship between reported mound diameters and heights. The resulting linear regression equation describes a positive correlation between the two measurements (R2 = 0.8385), permitting prediction of height on the basis of diameter. We applied that equation to the leveled Gast Farm mounds and calculated their approximate original heights, which range from 1.3 m for Mound 2 to 1.8 m for Mound 4 (Table 1). Height estimates are conservative because of our likely underestimation of mound diameters.

Figure 10. Dimensions of recorded mounds in the Gast Farm vicinity (see Supplemental Table 2) and linear regression of height-diameter relationship.
Table 1. Approximate Diameters and Inferred Heights and Volumes of Gast Farm Mounds.

With diameter (and radius) and height estimates in hand, and employing our assumption that original mound shapes approximated domes, we calculated the amount of each mound's fill using the formula for the volume of a spherical cap:

where h is the height of the cap (i.e., mound height) and a is the radius of the base of the cap (i.e., mound radius; Pamula Reference Pamula2020). Table 1 shows that the estimated fill volumes ranged from 128 m3 for Mound 2 to nearly 530 m3 for Mound 4. Volumes of Mounds 3A and 3B are calculated separately even though the apparent rebuilding episode probably incorporated much of the existing mound. For that reason, and in view of the possibility that mound shapes were slightly tapered rather than strictly dome-like, we reduce the total fill volume of 2,477.7 m3 by around 10% to 2,200 m3, still a conservative estimate.
Redeposition of approximately 2,200 m3 of mound fill through leveling and plowing can account for the light-colored bands once thought to be remnants of earthworks. The cardinal-direction orientations of the approximately 25 m wide bands can be traced for at least 450 m, so the area covered by the bands is no less than 11,250 m2. Spreading 2,200 m3 of fill over 11,250 m2 covers the filled area to a mean depth of 20 cm. The light-colored bands, consequently, may owe their origin to mound fill that was moved east and south—which have always been the orientations of the planting rows—as the mounds and their immediate surroundings were leveled. Field-school excavation units near one of these bands in the eastern part of the site revealed an Ap (plow zone) horizon slightly lighter in color than the immediately underlying A1 horizon (Whelan et al. Reference Whelan, Michael Dunne, Nansel and Neverett-Fulcher2001), possibly reflecting addition of redeposited mound fill. The small mounds must have been leveled in the nineteenth or early twentieth century because longtime owner Dan Gast knew about only the single large mound he leveled in the 1950s.
Discussion and Conclusion
In their call for an “inquiry-based archaeogeophysics,” Thompson and colleagues (Reference Thompson, Arnold, Pluckhahn and VanDerwarker2011) contended that “persistent places” (Schlanger Reference Schlanger, Rossignol and Wandschneider1992) are well suited to anthropological study using shallow geophysical methods. Changes and continuities in the forms of and relationships between dwellings, communities, and monuments are just some of the topics that geophysics can help address in places with long histories. Mound groups are persistent places in several senses. They were often built in stages over many years. They were often maintained and reused by descendant groups or newcomers. They generally retain their form for long spans of time. They continue to hold spiritual and religious significance for many Native Americans. And—as we see in the present study—certain of their features can remain intact even after the above-ground portion is removed. Gast Farm is doubly persistent: as one of the most prominent alluvial fans in its locality, it attracted settlement as soon as it formed in the early Holocene and ultimately supported numerous Archaic and Woodland communities (Bettis et al. Reference Bettis, Baker, Green, Whelan and Benn1992). Middle Woodland people who occupied the eastern part of the site on a periodic basis over approximately 200 years (Green Reference Green2018) modified the central fan surface by building at least six conical mounds and rebuilding or enlarging at least one of them.
Magnetic survey in the central part of Gast Farm addressed several research questions. We sought to determine whether the single previously reported mound retained any subsurface integrity (it does) and if structural features survive (they do). We asked if there was any subsurface signature of the apparent geometric earthworks (there is not). Consequently, we learned that leveled mounds are not necessarily destroyed and that features evident from aerial imagery require verification. The survey's finding that off-mound pit features appear to be sparse in the mound locus also supports the controlled surface collection results, which suggested that Middle and Late Woodland domestic activities and facilities remained apart from the Middle Woodland mortuary/ritual precinct.
A surprising result of the magnetic survey was that the site had not one but at least six mounds, demonstrating the method's effectiveness in identifying previously unknown mounds as well as verifying known mound loci. These mounds contain central features, probably crypts as in other Havana Hopewell mounds. The crypts at Gast Farm are small, comparable in size or smaller than the approximately 2 × 3 m burial pits beneath the Albany mounds (11WT1) in northwestern Illinois (Herold Reference Herold1971). In number and layout, the mound group resembles the Kingston site, a group of seven Havana Hopewell mounds on an alluvial fan 28 km south of Gast Farm (Scholtz Reference Scholtz1960; Straffin Reference Straffin and McKusick1971). The Kingston mounds have been plowed for decades and are good candidates for geophysical survey. The Gast Farm mounds are comparable in diameter to Middle Woodland mounds throughout the region (Alex et al. Reference Alex, Green and Lillie2019; Harrison Reference Harrison1886; Herold Reference Herold1970, Reference Herold1971; Lippincott and Herold Reference Lippincott, Herold and Herold1965). Spacing of Havana Hopewell mound groups along the Mississippi River suggests territorial demarcation (Benn Reference Benn and Benn1988), although little is known about contemporaneity or duration of site use.
Most Havana Hopewell primary mound interments are in crypts or other subfloor pits (Brown Reference Brown, Brose and Greber1979). Such treatment insulates those burials from disturbance by simple land-leveling or plowing. Similarly, Middle Woodland Goodall and Norton tradition mounds in Indiana and Michigan feature burial pits that escape plowing (Kingsley Reference Kingsley and Halsey1999; Schurr Reference Schurr1999). Similar patterns occur among mounds throughout Minnesota (Arzigian and Stevenson Reference Arzigian and Stevenson2003) and Wisconsin (Amy Rosebrough, personal communication 2020). We can therefore state with assurance that in the Prairie Peninsula and upper Great Lakes regions, mound leveling will not destroy all associated features at most Middle Woodland mounds. Subfloor burial features are likely to escape plowing and leveling in other areas too. Furthermore, our survey and earlier work (e.g., Mathys Reference Mathys1997; Schurr Reference Schurr1999) demonstrate that magnetic survey is an effective and efficient means of detecting leveled mounds and gaining information about mound diameter, fill variability, and pit feature location and size. Dimensional data for intact local mounds allow estimation of height and volume for leveled mounds. Here, these estimates helped us suggest the mound-fill origin of the surface discolorations we thought might be earthworks.
Large-area geophysical surveys now can be accomplished efficiently as motorized, multisensor arrays become mainstream (Kvamme Reference Kvamme, McKinnon and Haley2017; Opitz and Herrmann Reference Opitz and Herrmann2018). Geophysical surveys can rapidly cover large tracts where mounds have been reported or suspected. Follow-up work using targeted geophysical assessment or testing can be accomplished as needed. Previously unknown mounds, mounds that had been considered destroyed, and mounds whose status was unknown can be revealed or rediscovered, improving knowledge of ancient landscapes and expanding preservation and conservation opportunities.
Acknowledgments
We thank property owners Linda Gast and Jack Wilson as well as farm operator Bryan Hoben for permitting and assisting with fieldwork at Gast Farm. Fieldwork and analyses were supported by the National Geographic Society Committee for Research and Exploration (grant 9938-16) and a Keefer Senior Faculty Grant and developmental leave from Beloit College. Vergil Noble (Midwest Archeological Center, National Park Service) contributed support from the National Historic Landmarks Program and provided valuable input. Research was supported by the Spatial Archaeometry Research Collaborations program of the Center for Advanced Spatial Technologies, University of Arkansas (funded by National Science Foundation award #1321443); thanks in particular to Adam Barnes and Rachel Opitz. Lew Somers of Geoscan Research USA advised on strategies for interpreting magnetic data. Thanks also to former Beloit College and University of Iowa students Alexandra Flores, Brianna Hoffmann, Julie Plummer, and Glenne Tietzer, and to Iowa OSA staffers John Doershuk, William Whittaker, Mary De La Garza, and Michael Perry. Thanks to Alondra Landa and Linda Forman for the Spanish language abstract and to Mark Schurr, David Benn, and the American Antiquity reviewers for helpful comments and suggestions.
Data Availability Statement
Project data are housed at the Office of the State Archaeologist, University of Iowa, Iowa City; the Midwest Archeological Center, National Park Service, Lincoln, Nebraska; and the Spatial Archaeometry Research Collaborations program, University of Arkansas, Fayetteville. See Supplemental Text 1 for access to data.
Supplemental Materials
For supplemental material accompanying this article, visit https://doi.org/10.1017/aaq.2020.103.
Supplemental Text 1. Geospatial and Geophysical Data Processing and Access.
Supplemental Figure 1. Orthorectified low-altitude color infrared air photo of Gast Farm taken June 1972 (crops newly sprouted). Note light-colored leveled mound locus and dark-colored Middle Woodland and Late Woodland occupation loci. Light-colored bands in the center of the site were formerly considered possible earthworks. Bright area at east end of site is dredge spoil from adjacent slough. (Photo by Ferrel Anderson. Used with permission.)
Supplemental Figure 2. Top: Exaggerated vertical lidar image of Gast Farm with ArcScene enhancement. Bottom: Exaggerated oblique lidar image with ArcScene enhancement. (Images created by William Whittaker, Iowa OSA, and used with permission.)
Supplemental Table 1. Summary of Remote Sensing Datasets, Their Sources, and Feature Visibility.
Supplemental Table 2. Dimensions of Conical Mounds in the Gast Farm Vicinity Recorded by the Davenport Academy of Natural Sciences.


 Open access