


Introduction
A food system consists of all aspects of food production, distribution, and consumption. There has been growing attention to local food systems in the United States. The U.S. Department of Agriculture (USDA) defines local foods as the “direct or intermediated marketing of food to consumers that is produced and distributed in a limited geographic area.” Definitions related to geographic distance between production and consumption vary by regions, companies, and markets (USDA-ERS 2019). In rural areas where the population is sparser, and the distances between towns and cities are greater, local food production and consumption seem to support integrated social, economic, and ecological functions. Many scholars have discussed benefits and challenges of local food movement in small and mid-sized farms (Kang & Rajagopal Reference Kang and Rajagopal2014; Abate Reference Abate2008; Schonhart, Penker, and Schmid Reference Schonhart, Penker and Schmid2009).
For a region to reap the benefits associated with local agriculture, certain conditions must be met. First, there are physical land conditions that must exist to meet the requirements of local agricultural production. Second, certain supply and demand dynamics (i.e., market conditions) must exist for local agriculture to be successful. The northern New England region of the United States has set goals to expand and enhance local agriculture despite a lack of research on physical constraints and market conditions. This article uses northern New England as a case study, using a multi-tiered research approach, to investigate the potential for local agriculture in a region. Each tier of the research informs the next, attempting to create a holistic view of the region's local agricultural potential while answering key questions throughout the process, such as whether the capacity of local food production would be sufficient to support regional food demand and whether consumers in the region show reasonable willingness to pay for the local foods. In this article we take steps to (1) understand the growing physical potential of the region to meet the needs of local consumers using vegetables and melons as examples, (2) investigate local supplier constraints and perspectives about expanding local production in fruit and vegetable categories, (3) survey local consumers on their perceptions and willingness to pay for local produce, applying choice models and selected vegetable bundles, and (4) identify the role of intermediary markets such as restaurants in increasing consumers’ access to local options. Our continually informed stratified research, with both qualitative and quantitative methodology, can assist in understanding not only the potential for regional local agriculture but also how to meet the goals of expanding and enhancing local agriculture set on a regional level. While it is our intention to generalize the outcomes of the analysis, our study demonstrates a collaborative regional effort to (1) identify key factors of understanding local food systems from a regional perspective, (2) link local food production to intermediary and local consumption in a systematic approach, and (3) showcase an innovative research and extension platform that could be applied in other research and in other regions.
Our research and results showcase unique outcomes in several ways. First, while the methods used—focus groups, choice modeling, various logistic modeling techniques, supply and demand estimations—do not represent novel applications, the combination of the approaches creates a systems framework from which to analyze the region's agricultural status. We argue that this framework can serve as a paradigm which can help with local policy and business strategy. Second, while the region studied is small both relative to U.S. geography and population (New Hampshire, Vermont, and Maine make up just 1.4 percent of the country's land area and 1 percent of its population), our results reveal that consumer preferences, production by intensity and crop type, and percentage of food consumed in the region which is produced locally vary widely. This and further research thus should incorporate spatial modeling into the analyses. These first two features of our research and study area point to the need to approach local agriculture using methods (1) that are linked and inform each other, and (2) that reveal that extrapolation of previous studies even beyond the state level may lead to aggregation errors. Thus, as our results will demonstrate, we use direct input from local farmers to identify problems and strengths of local agriculture, which in turn inform how we structured our community surveys, which in turn uses these direct sources of data to develop policy and business strategies. Use of regional secondary data on consumption and production in the region provides directly relevant information to those who would seek to set goals for local production and casts light on the feasibility of some of these proposed policies. Thus, while the methods have been used in other studies on local agriculture (e.g., Bond, Thilmany, and Keeling-Bond Reference Bond, Thilmany and Keeling-Bond2008); Swenson, Reference Swenson2010), they are nonetheless the correct methods to use here, and the combination of methods produces a unique set of recommendations.
A Systematic Approach to Study Local Foods
Investigating Local Supply Capacity: The Potential Ceiling for Regional Produce Sales
The first step in understanding the potential for local agriculture in a region is to assess the physical growing abilities which are, and could be, dedicated to local production given local consumers’ consumption habits. In a recent paper, Griffin et al. (Reference Griffin, Conrad, Peters, Ridberg and Tyler2014) derived a measure they termed “regional self-reliance” (RSR) for the northeastern United States, indicating the degree to which U.S. regions can satisfy their own food needs. The motivation for this measure stems from perceived risks in regional supply such as climate change, overreliance on irrigation in certain regions, possible extreme pest outbreaks, and the geographic concentration of the production of some crop and livestock commodities (e.g., lettuce in California and swine in Iowa and North Carolina). Using secondary data, Griffin et al. conclude that RSR for the Northeast in plant-based foods ranges from 7.2 percent for pulses (dry beans and peas) to 26 percent for vegetables with a mean RSR of 16 percent for the region. These measures suggest that the Northeast region has moderate, yet variable, potential to be more self-sufficient in local food production.
In research efforts complementary to Griffin et al. (Reference Griffin, Conrad, Peters, Ridberg and Tyler2014), we examined the current supply of produce in northern New England using secondary data, aiming to quantify import substitution possibilities in the region. It is well known that consumers in northern New England import the majority of their food, despite the substantial amount of seasonal produce that is grown locally. Nonetheless, the import/export and local supply dynamics suggest that an increasing shift in supply could both reduce local prices and reduce imports to northern New England and add subsequent multiplier effects. However, there are reasons why the market has not yielded this result; it is not simply a matter of supply of agricultural land (or lack thereof) but also the productivity and quantity of soil, topography, technology, location, and other supply shifters, as well as population density and the opportunity cost of prime agricultural land which may preclude this outcome. Griffin et al. (Reference Griffin, Conrad, Peters, Ridberg and Tyler2014) speculate that increasing a region's RSR measures (i.e., increasing land in production of various agricultural products) might require a combination of conversion of marginal land to active use, conversion of sites with soils meeting optimal farmland designation that are currently not being farmed, changes from one crop category to another, and changes in crop productivity. Also, changes in population and dietary preferences will influence the demand for food. Finally, Griffin et al. (Reference Griffin, Conrad, Peters, Ridberg and Tyler2014) note that increased output would necessitate a substantial increase in the supply chain infrastructure in the region.
In summary, though valuable, it is not sufficient to solely estimate how much more northern New Englanders would consume from local sources if it were available at competitive prices and quality; it is also necessary to examine (1) why farmers are not expanding production to displace imports, and (2) specifically what constraints they face to increasing production, which will be further explored in subsequent research efforts. First, however, we present the maximum potential for northern New England to expand local production.
How Much Produce Can Northern New England Farms Supply?
Regions of northern New England, like many places in the United States, have explicit goals of increasing the consumption of local foods. Setting realistic targets, however, requires decision-makers to have a solid grasp of the amounts and the types of foods that are grown locally. Although some of the agricultural products harvested in a region could be transported elsewhere, the availability of farmland provides a capacity for items that could potentially be produced and consumed locally. In other words, the presence of farmland in a region does not guarantee that households will purchase local products, but it is a requirement that a region has land devoted to farming for households to consume local produce.
In this section, we estimate the capacity of farms in northern New England to provide vegetables and melons to satisfy the consumption needs of residents. The analysis considers 40 counties in Maine, New Hampshire, and Vermont, with local capacity estimates based on farmland acreage data for 51 products from the 2012 U.S. Census of Agriculture and 2012 population figures from the American Community Survey (U.S. Census). Following the approaches used by Timmons, Wang, and Lass (Reference Timmons, Wang and Lass2008) and by Swenson (Reference Swenson2010), the local capacity estimates are calculated by comparing a county's acreage per capita for a specific type of vegetable or melon to the number of acres per capita nationally, adjusted in cases where the amount of usage nationally exceeds (or falls short of) what is produced in the United States. Additionally, we estimate the percentage of these products that could come from farms in the county and growers located elsewhere in the same state.
Timmons, Wang, and Lass (Reference Timmons, Wang and Lass2008) estimated food consumption using national-level per-capita production figures adjusted for net exports. For example, they estimated a national benchmark of $45.74 production per person, as of 2002, in the category of “vegetables, melons, and potatoes.” To estimate the percentage of this consumption that could be satisfied locally, they calculated a ratio of the production in the region of interest—for instance, Vermont has $16.45 in production per capita in the category of “vegetables, melons, and potatoes”—to this national consumption benchmark. They interpret this ratio to mean that Vermont has a “maximum local food percentage” of 36 percent in this category.
Our approach estimates local food percentages from the same types of regional-to-national ratios, but instead of using information on the dollar amounts of production, we use data on farmland acreage. Since this information is available at the county level for a wide range of products, we can estimate local food capacities for 51 types of vegetables and melons. Although the use of acreage data (without knowing the amount of output generated per acre in each county) requires that we assume productivity levels are reasonably similar between the region of interest and the U.S. benchmark, the wide range of categories provides a detailed picture of locally available products (e.g., pumpkins, celery, beets, lettuce).
Using acreage data for detailed categories of vegetables and fruit, Swenson (Reference Swenson2010) calculated the economic impacts (e.g., job growth) associated with increased local food production. Swenson (Reference Swenson2010) supplemented these data, similar to what is used in our analysis, with information on yields, prices, and product weights. Swenson's study involved a scenario where the demand for products was matched to agricultural producers operating in the same state and a second case in which markets include metropolitan areas located within 150 miles of the region of interest. Our analysis takes the former approach and focuses on farmland located in a given county and its surrounding state, although an extension to our research could define local foods based on distances traveled and count out-of-state producers as “local” if they are operating within the prescribed distance.
It should be noted that, in our analysis, a county-level local food capacity of, say, 35 percent does not mean that households are purchasing 35 percent of their food locally. Such a result would instead suggest that the county has an amount (i.e., number of acres per capita) and mix (i.e., spread across different types of crops) of farmland devoted to vegetables and melons that are equivalent to 35 percent of the comparable numbers nationally. There are several assumptions about our approach:
1. The analysis does not incorporate information on the seasonal availability of the agricultural products considered. This means that although our results might suggest that a particular product is available in abundance in a county, this does not necessarily mean that it can be produced (and consumed) year-round.
2. Our analysis assumes that residents of northern New England counties have the same purchasing habits as the average American.
3. Our analysis assumes similar soil typology, practices, management, and farming patterns across the studied region.
4. The analysis assumes no or minimum price distortion due to climate variations or natural risks.
As an example of how the method works, consider the category of cucumbers and pickles in Androscoggin, Maine. This county had 17 acres of land devoted to the production of cucumbers and pickles in 2012, which amounts to 158 acres per one million residents. The United States as a whole had 111,900 acres for the production of cucumbers and pickles (362 acres per one million persons) and U.S. residents utilize 78 percent more cucumbers and pickles than are produced in the country (Minor and Bond, Reference Minor and Bond2017). This means that to meet the needs of all U.S. residents, the country would need an estimated 646 acres per one million persons. Since Androscoggin County has 158 acres of cucumbers and pickles per one million persons, we estimate that it has the capacity to produce 24 percent of the cucumbers and pickles consumed by residents.
If the local capacity value is greater than or equal to 100 percent, we assume that all of the product could come from local sources and, if it exceeds 100 percent, the county has an excess capacity that could be exported. More concretely, our method sums together the excess capacities for a given product across all counties in a state to determine its total excess capacity, and this amount is divided across counties in that state with less than 100 percent capacity. The amount that could be available in the county added to the amount that could come from other places (with over 100 percent capacity) is defined as the county and state capacity. For example, Cumberland County, Maine, has 35 acres of potatoes per one million residents, which translates into a county-level capacity of two percent. Aroostook County, Maine, however, has so much land devoted to the production of potatoes that it has the capacity to produce enough potatoes for the entire state. This means that although Cumberland County has a very low county capacity for potatoes, it has a county and state capacity of 100 percent.
In addition to calculating this type of information for 51 categories of vegetables and melons, we also estimated summary figures for each county. These values are constructed such that products with greater amounts of acreage nationally have heavier weights in determining the overall average and also are calculated using a method where the maximum county (or county and state) capacity for any product is 100 percent. This means that the summary measure can be interpreted as the percentage of vegetables and melons that could be available locally, based on the number of acres per capita devoted to the 51 products, and such that residents consume a mix of vegetables and melons similar to the mix consumed by Americans as a whole.
Results
Figure 1 shows the county, and county and state summaries, for vegetable and melon capacities in Maine, New Hampshire, and Vermont counties. In addition to showing the summary figure, the bubble sizes depict differences in the total amounts of acres per capita devoted to the production of vegetables and melons. In this figure, the total amounts of acres include all of the land used to produce vegetables and melons, even in cases where the local capacity exceeds 100 percent. This means that whereas more acres in one product (or a few products) might not increase the aggregate capacity figures very much, a large local presence in one or a few types of vegetables and melons would increase the bubble size.
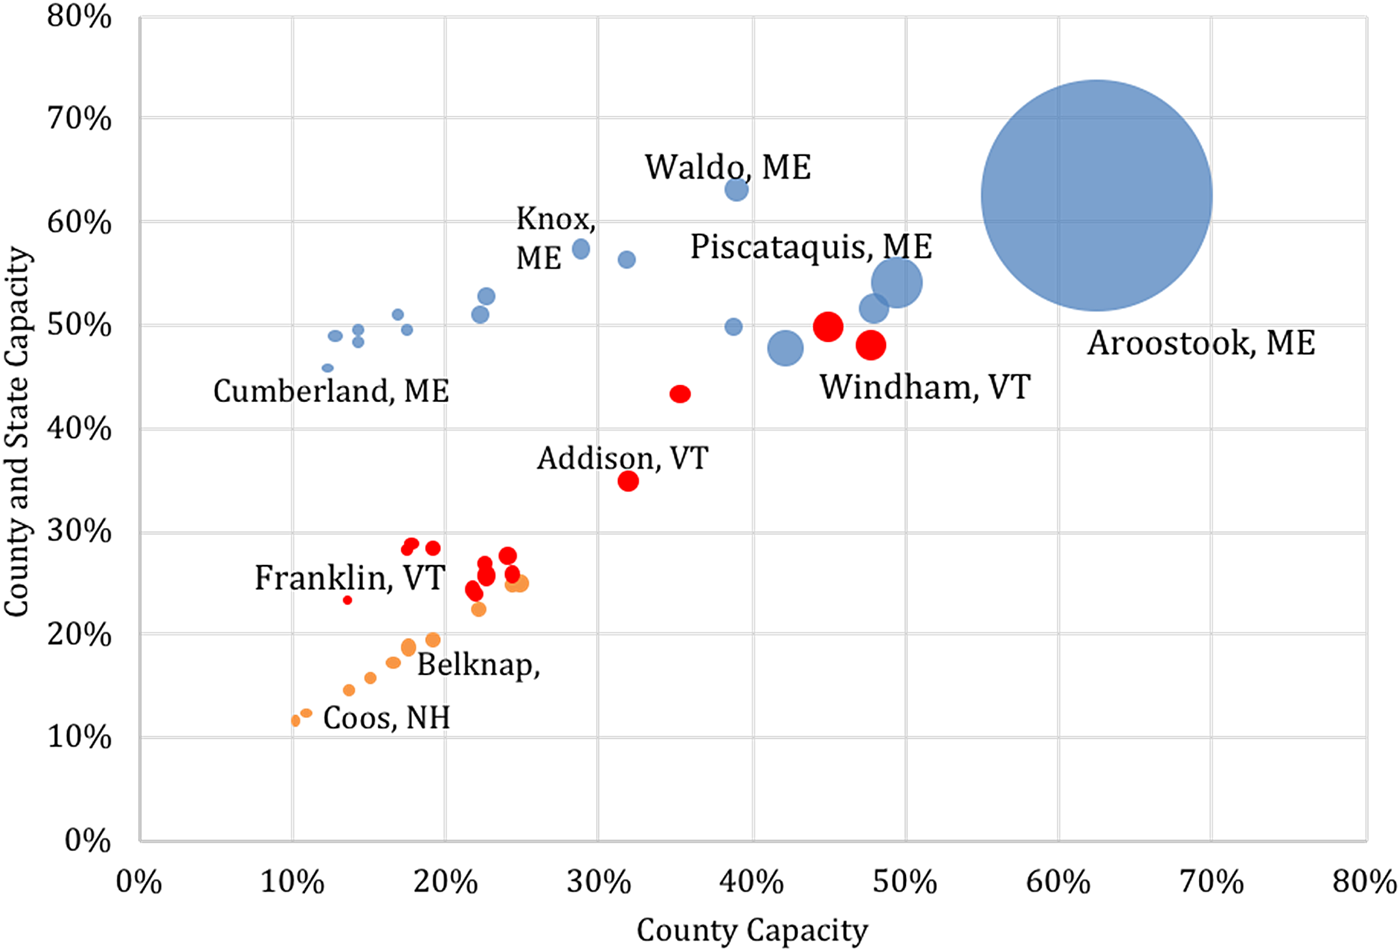
Figure 1. Total Local Food Capacity for Vegetables and Melons: Maine, New Hampshire, and Vermont
The largest bubble on the right side of Figure 1 represents Aroostook County, Maine, which has a county capacity of over 60 percent and by a wide margin the largest amount of acres per capita devoted to vegetables and melons. The fact that Aroostook's county and state capacity of 63 percent is almost identical to its county capacity of 62 percent indicates that other places in Maine do not have much of an excess of acres in vegetables and melons that are not already available to Aroostook County. Although several Maine counties (e.g., Cumberland) have capacities of less than 20 percent, and these areas have little land devoted to the production of vegetables and melons (indicated by the small bubble sizes), these places have county and state capacities that exceed 40 percent, due to a few counties in Maine with substantial excess capacities.
Figure 1 reveals a distinct difference between Maine and New Hampshire in terms of relative capacities and quantities of agricultural land. In New Hampshire, the linear trend of the bubbles almost 45 degrees from the origin suggests that the county capacities are almost identical to the county and state capacities. In other words, there are not many types of vegetables and melons in any one New Hampshire county whose production is great enough to enhance the county and state capacities elsewhere. Another feature of vegetable and melon production in New Hampshire is that the counties are similar in terms of the total number of acres per capita, as indicated by the roughly equally sized bubbles.
Results for Vermont are somewhat of a cross between what we found for Maine and New Hampshire. Similar to the case of New Hampshire, the analysis shows that several Vermont counties have county and state capacities for vegetables and melons that are less than 30 percent. Windham and Orange Counties, however, have local food capacities that are almost 50 percent, similar to what we found for most Maine counties. The key difference is that the vegetable and melon capacities of almost 50 percent in these places come from the acres of farmland available locally—that is, the county capacities are almost identical to the county and state capacities. Furthermore, although these places have a mix of acres devoted to vegetables and melons that can meet about 50 percent of the local needs for these products, they do not appear to have an abundance of farmland to provide excess products to meet the needs of other counties in Vermont. If they did, the other Vermont counties would have county and state capacities that are around 50 percent, which is the case for Maine due to the substantial amounts of farmland in a few counties.
Overall, the information presented in Figure 1 shows that the highest county and state capacities for vegetables and melons are in Maine, supported by the large amounts of farmland per capita in a few counties, followed by Vermont and New Hampshire. When interpreting these results, it is important to consider the caveats that these capacities may not be similar to the percentages of local foods that are consumed. Likewise, although vegetables and melons provide a good source of fresh foods that are important for a healthy diet, these products make up a small part of overall U.S. food purchases. For example, data from the 2015 Consumer Expenditure Survey show that U.S. households spend an average of $769 annually on fruits and vegetables—a broader category of items than considered in our analysis—which is only 11 percent of total food and beverage purchases, including food and drinks purchased at restaurants and bars. Despite these limitations, the results suggest that, at least in principle, residents in some parts of northern New England have reasonably good access to a diverse mix of local vegetables and melons. Understanding both the extent to which this access can be expanded by growers across the region and the preferences of local consumers for purchasing these products is an important next step in providing research-based evidence regarding local food consumption targets.
Investigating Local Supply Capacity and Constraints to Regional Local Agriculture Expansion
Understanding New England's ability to maximize local agricultural production is contingent not only on physical land constraints but also on the willingness of growers to enter the market or to expand current growing operations. Established growers, who have overcome start-up costs and may benefit from economies of size, would contribute substantially to meeting growing capacity through expansion and crop diversification, but little research has been conducted investigating the barriers that local growers face when operating in the Northeast region of the U.S. Examining the constraints and barriers of regional growers can provide insight on producers’ readiness to increase production and how to encourage growers in their efforts to expand local agricultural production.
Producer Perspectives on Expansion Methods
To investigate perspectives of local growers from northern New England, a series of focus groups were conducted during the late winter and early spring of 2015/2016. Participants were recruited through email and phone lists with the assistance of Cooperative Extension from the Universities of Maine, New Hampshire, and Vermont. Participants were identified as growers and producers actively selling fruits and vegetables through direct marketing methods (e.g., farm stand, Community-Supported Agriculture [CSA], farmers markets). Focus groups were led by trained facilitators who guided the discussions and encouraged participants to express opinions on questions that included the following: “What are the main/current obstacles you face when running your operations? And what are the obstacles you would encounter if you decided to expand your operations?” Transcripts of the focus group discussions, along with demographic data provided by each participant, were later uploaded into qualitative software for analysis. Guided by Friese (Reference Friese2014), the analysis incorporated thematic coding to identify emerging themes for each question that were then categorized into broader groups. Results were analyzed at different points in time to determine if an equilibrium had been reached or if additional focus group sessions were needed. We call this novel technique tracking convergence.
A total of 50 vegetable and fruit growers from Maine, Vermont, New Hampshire, and New York (n = 24, 12, 13, and 1, respectively) participated in one of the six focus group sessions. Forty-eight of the transcripts were used for the qualitative analysis (Maine (n = 22), Vermont (n = 12), New Hampshire (n = 13), and New York (n = 1)). The sample included 23 male and 24 female participants. Of the participants, 27 (56 percent) claimed to be conventional growers and 17 (35 percent) claimed to be organic growers, one participant identified as both, and three others did not identify as either. Participants included early-stage as well as seasoned growers. The age of the growers was not prompted in order to respect the growers’ personal information in a focus group setting; however, age variation was observed in the sessions.
Producer Perspectives Results
Results from this analysis suggest that the most prevalent constraints for local farming operations in northern New England are related to labor and laborers (26 percent), consumer constraints (16 percent), managing the business aspect of the farm (14 percent), and capital constraints (12 percent). Constraints related to the topic of labor and laborers mainly relate to finding dependable employees to work for little pay and only for a short season. Some farmers also expressed difficulties in working with high school or middle school students, due to lack of experience, knowledge, or motivation.
Focus group discussions indicated farm expansion is most restricted by capital constraints (22 percent), followed by time (11 percent), labor (11 percent), land (10 percent), and demand (10 percent). Expansion by early-stage and established growers requires additional capital for increased inputs, infrastructure changes, taxes, and insurance. Many of the participants who do not work on the farm full-time say they would have to quit their jobs to expand, which makes time another constraint. Though forested land is plentiful in New England, participants expressed that available land is one of their main expansion constraints. Many of the participants said that obtaining land was an extremely expensive venture and that finding cleared land suitable for growing was an even greater challenge. Understanding demand is another issue for producers; the infrequency and fluctuation of demand do not support the need for expansion, from some farmers’ perspectives. Growers’ perceptions of production barriers were analyzed at the state level to examine subregional congruence and dissimilarities. Here we find that Maine and New Hampshire growers are more similar when compared to Vermont growers, with labor being more problematic for Maine and New Hampshire growers, while capital was more problematic for Vermont growers. Expansion constraints are more uniform across states, with capital being either the first or second in the three states’ top constraints.
Conclusions on Producer Perspectives
In conclusion, both early-stage and seasoned local producers face significant barriers when running a successful business, such as labor/laborers and consumers. If the current barriers to local production are not addressed, the number of local growing operations will either stagnate or decrease over time. Many of the barriers to expanding local agricultural efforts are similar to the barriers faced during current production efforts. The tristate analysis demonstrates the similarities in the participants’ responses and highlights fundamental issues that need to be mitigated before increasing regional local production. If the region is to meet the maximum growing capacities described in the previous section efforts need to be taken to minimize supplier constraints and barriers to expansion.
Investigating Local Demand: Estimating Premiums for Local and Organic Produce in Northern New England Region
A key issue raised by the local growers who participated in the focus groups was a need to know why consumers are not buying local products and, conversely, what attracts purchasers. Many of the issues described by suppliers could also be solved by increasing profits and capital through increases in consumer demand. Understanding consumer perceptions and values are vital to interpreting the true potential for local agriculture in northern New England. In recent years, a body of literature has emerged suggesting that the average local food consumer tends to perceive local produce as fresher, healthier, and of higher quality compared to non-locally grown counterparts (Yue and Tong Reference Yue and Tong2009; Onozaka, Nurse, and McFadden Reference Onozaka, Nurse and McFadden2010; Adams and Salois Reference Adams and Salois2010; Pyburn et al. Reference Pyburn, Puzacke, Halstead and Huang2016). Besides, studies suggest customers who buy local food value helping local farmers, assisting in aiding the local economy, and decreasing negative environmental impacts (Onozaka, Nurse, and McFadden Reference Onozaka, Nurse and McFadden2010; Yue and Tong Reference Yue and Tong2009; Adams and Salois Reference Adams and Salois2010). And lastly, customers who participate in CSA or shop at local farmers markets view the experience of buying locally as a social benefit (Yue and Tong Reference Yue and Tong2009; Adams and Salois Reference Adams and Salois2010; Brown and Miller Reference Brown and Miller2008). Because of the real and perceived benefits associated with buying local, a significant number of studies suggest that consumers are willing to pay price premiums for locally grown foods over their non-local counterparts (Bond, Thilmany, and Keeling-Bond Reference Bond, Thilmany and Keeling-Bond2008; Adams and Salois Reference Adams and Salois2010; Loureiro and Hine Reference Loureiro and Hine2002; Darby et al. Reference Darby, Batte, Ernst and Roe2008; Carpio and Isengildina-Massa Reference Carpio and Isengildina-Massa2009; James, Rickard, and Rossman Reference James, Rickard and Rossman2009; Pyburn et al. Reference Pyburn, Puzacke, Halstead and Huang2016; Adalja et al. Reference Adalja, Hanson, Towe and Tselepidakis2015; Constanigro et al. Reference Constanigro, Thilmany, Kroll and Nurse2011; Onozaka, Nurse, and McFadden Reference Onozaka, Nurse and McFadden2010; Giraud, Bond, and Bond Reference Giraud, Bond and Bond2005; Onken, Bernard, and Pesek, Reference Onken, Bernard and Pesek2011).
Despite significant evidence that consumers are willing to pay price premiums for local produce, these trends have not been investigated in the northeastern U.S. One of our aims is to further the existing literature by investigating consumer preferences for organically and locally grown produce in northern New England. To examine this question, a discrete choice analysis was implemented through a consumer survey choice experiment. The consumer choice experiment varied four binary produce attributes and four non-binary price levels across six different produce options, generating unique hypothetical product “bundles” from which a participant can choose. Specifically, the survey investigates consumers’ willingness to pay (WTP) for snap peas, green beans, carrots, tomatoes, strawberries, and cucumbers, each characterized by the following attributes: locally grown, organically grown, blemished or irregular, and if the produce was purchased directly from the producer. In addition to the choice analysis, qualitative questions were asked to understand what consumers look for when purchasing any produce.
Survey Design and Econometric Techniques
The set of produce and attributes for this analysis was chosen based on a series of consumer focus groups and pilot studies, which provided guidance on the produce most preferred by consumers and those characteristics most considered when purchasing fresh produce.Footnote 1 Local and organic attributes were clearly defined for participants prior to the start of the choice set section of the survey; local is defined as produce grown within 50 miles from where it is purchased (Pyburn et al. Reference Pyburn, Puzacke, Halstead and Huang2016). “Organically grown” is defined as meeting USDA requirements and is Certified Organic. Additionally, the blemish attribute is a proxy for quality, while the direct-from-farmer attribute captures the value of the social elements of direct marketing. Price levels for each of the produce items were informed by a variety of sources, such as supermarkets, supercenters, health stores, and farmers markets over the summer of 2016 to ensure that the prices represented realistic ranges at the time of the survey deployment. An example choice exercise is presented in Figure 2, and the full set of choice experiment attributes and levels can be found in Figure 3.
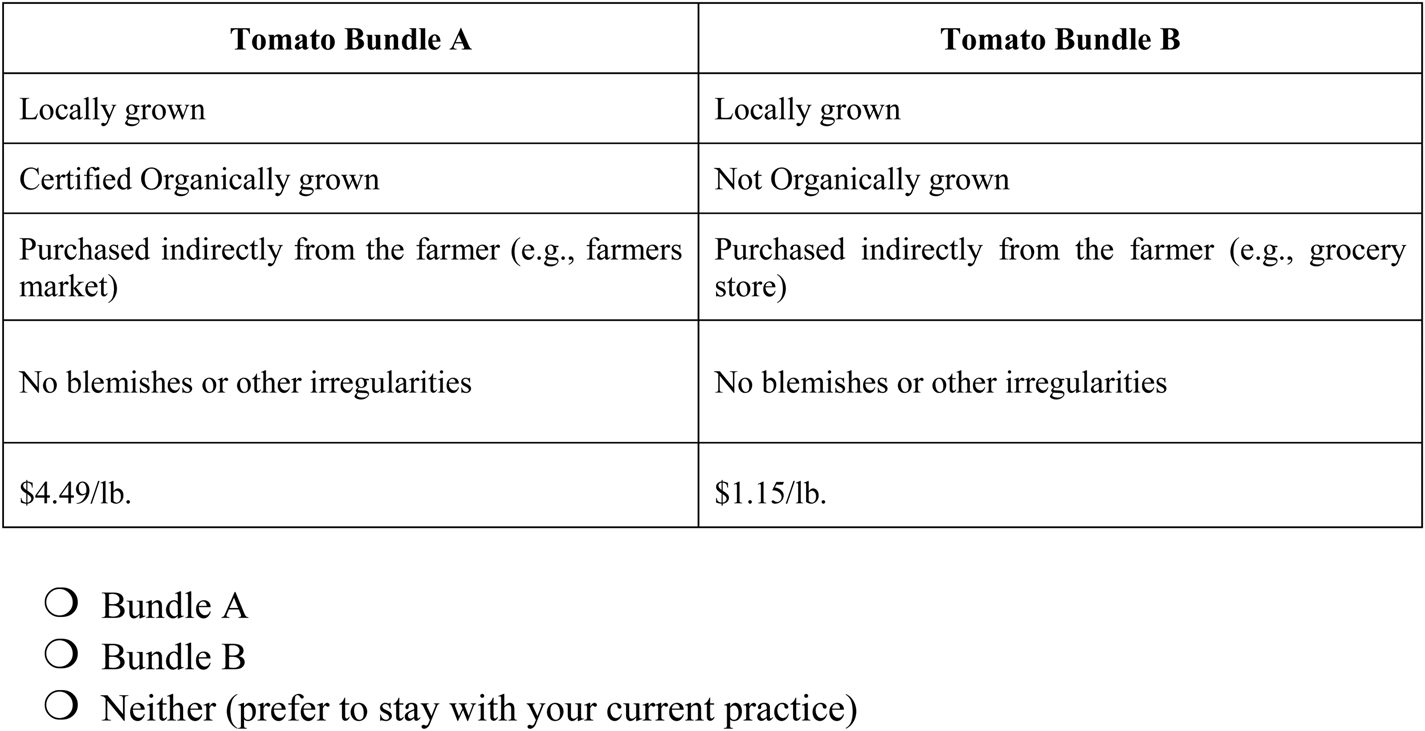
Figure 2. Consumer Survey Choice Experiment Bundle Example
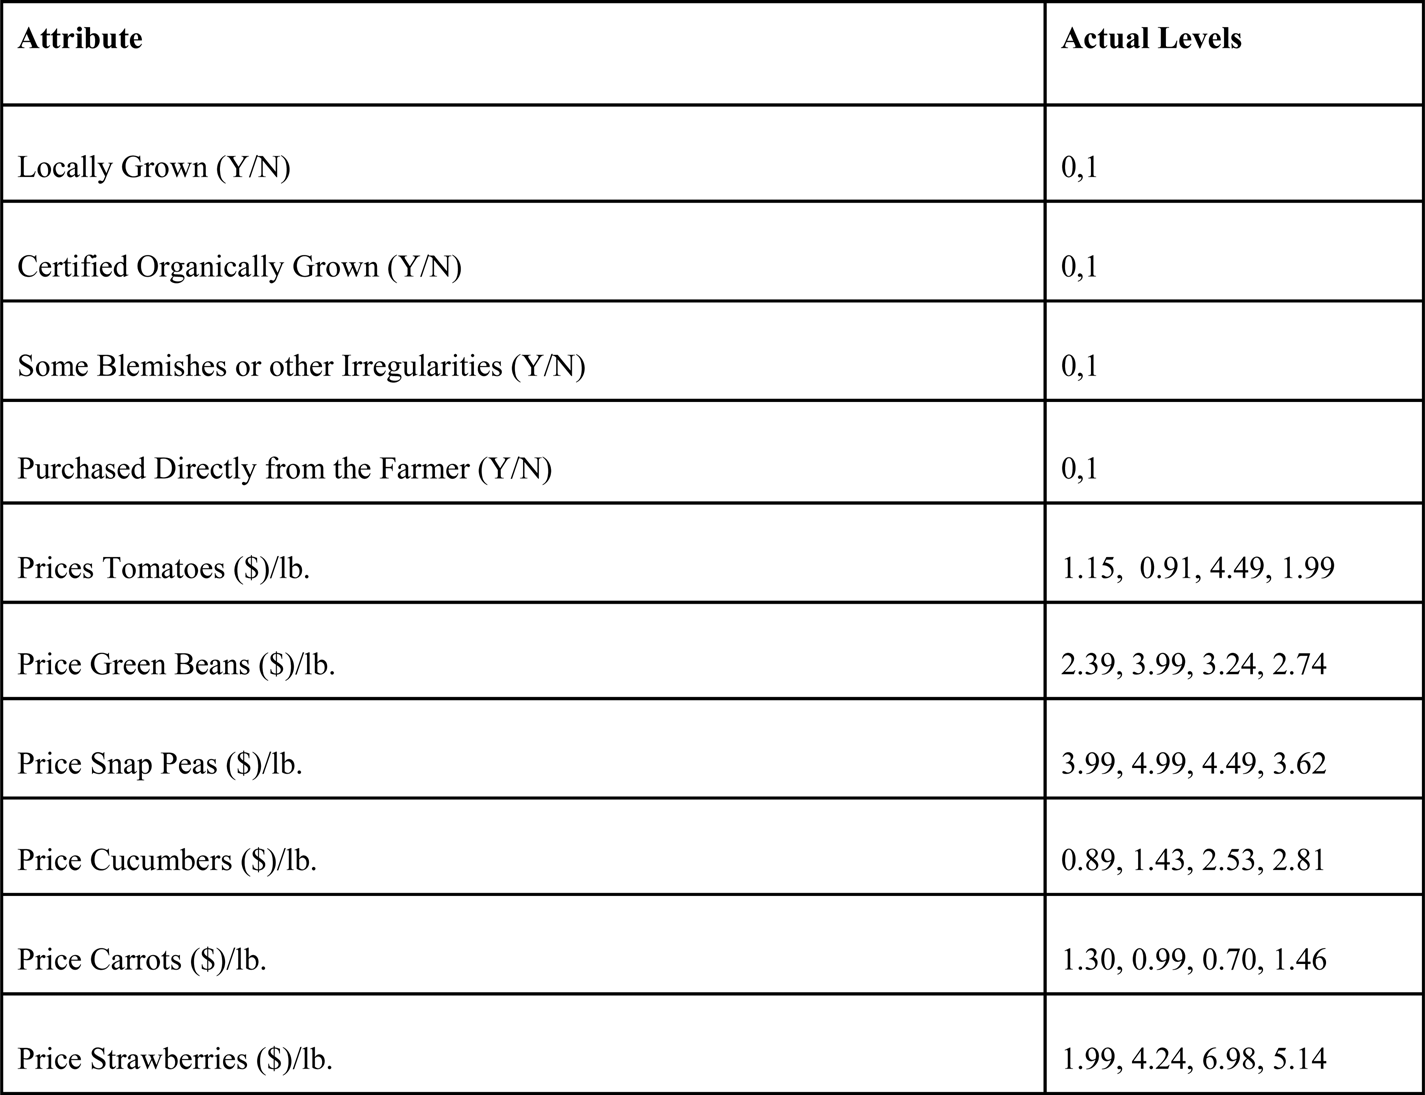
Figure 3. Choice Experiment Attributes and Attribute-Levels
The consumer was prompted to compare two hypothetical bundles (the choice set) and choose the preferred bundle. Each bundle has different attribute “levels” that vary in order to identify differences in consumer preferences for each attribute investigated. Additionally, the good's own-price is an attribute, from which WTP estimates can be derived. The difference between choosing one choice alternative over its binary counterpart can be examined as the opportunity cost or the marginal rate of substitution between options, resulting in a WTP estimate.
When faced with a particular choice set, the consumer can choose Bundle A, Bundle B, or neither (an “opt-out” choice). Using an opt-out choice is common for this type of experiment, to mimic marketplace conditions and decrease protest bidding (Ferrini and Scarpa 2007; Bernard and Bernard 2010). To minimize survey length, only three of the six produce options were presented in each of the surveys (eight survey versions in total). Each survey version presented two choice sets for each produce option, resulting in 12 bundles (six choice sets) per survey.
An invitation to take the survey was physically mailed to a random sample of 6,000 residents of Maine, Vermont, and New Hampshire following the Dillman Tailored Design Method (Dillman, Smyth, and Christian Reference Dillman, Smyth and Christian2014) in August 2016. Mailing addresses were acquired through the private firm Survey Sampling International and the adult, primary shopper of the household was invited to participate in an online survey. Any respondent who did not take part in the initial online survey was later sent a paper version of the survey to complete. A total of 245 online and 402 mail-in surveys were completed, a response rate of 12 percent.Footnote 2
To investigate consumers’ WTP for local produce in northern New England, discrete choice stated-preference models were used to analyze a decision-maker's choice among various alternatives. Here, a respondent's utility is assumed to be a function of both deterministic and stochastic components, following the RUM framework (McFadden Reference McFadden1974). The deterministic component of the utility function is assumed to be a linear function of choice attributes, the price of choice, and individual-level characteristics. This analysis uses the mixed logit class of models for estimation and welfare calculations, allowing for preference heterogeneity through the sample. In our estimation, we assume that preferences for local, organic, non-blemished, and direct purchase attributes are random and normally distributed throughout the population, whereas the coefficient on price is assumed to be constant across respondents. From these models, we derive WTP estimates which also control for individual-level characteristics, such as income, gender, education, and state of residence. Further, a variable capturing the choice of the status quo option is included to control for any status quo effects. Finally, the WTP for a given attribute is calculated as the ratio of the coefficient on the attribute and the coefficient on the price. Because preferences for all binary attributes are allowed to randomly vary through the population, WTP measures were calculated via simulation.
Qualitative Consumer Survey Results
Prior to the choice experiment, survey participants were asked to rank the importance of various attributes when considering purchase of any type of local produce (Figure 4). Produce attributes, including locally grown, organically grown, grown within the country, grown without pesticides, supports the local economy, and supports maintaining local farmland, were all investigated and participants were asked to rank their importance from “not important” to “very important.” Consumers rated maintaining farmland, supporting the local economy, and produce grown without pesticides as very important, while local and organically produced foods were relatively less important. This finding may indicate that people value the underlying benefits associated with locally produced options but not the term “local” itself. In other words, there may be a disconnect between the term “locally grown” and its resulting benefits. These results can aid local farmers and coalitions in educating consumers about the benefits of buying local produce and possibly increase local sales through informed marketing, which in turn, can alleviate some of the barriers to expanding determined in the previous section. This finding also suggests that regional consumers still value many of the components of local agricultural products, such as supporting the local economy or maintaining farmland but do not connect this to the term “local.” Other intermediary markets may allow for consumers to learn more about the benefits of buying local produce that are linked closely to consumer values. Overall, there seems to be a knowledge gap between the benefits of local produce and the term “local” which, if filled, could increase local purchases, diminish supplier constraints, and aid in maximizing regional local agriculture capacities. This new insight provides the building blocks for both regional and local policies, and can inform outreach efforts via Cooperative Extension and others.
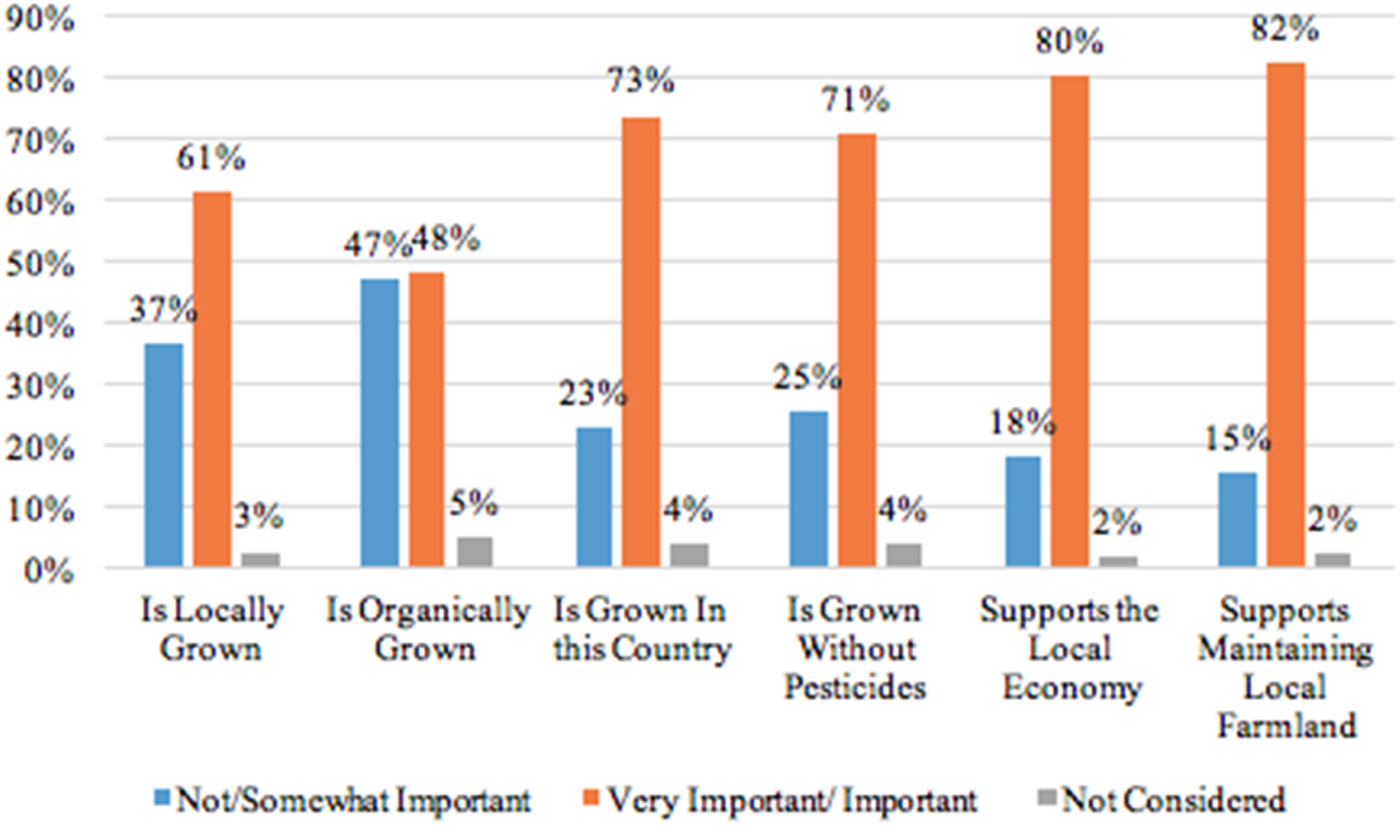
Figure 4. Factors Affecting Consumers’ Choice Over the Purchase of Fresh Produce
Quantitative Choice Experiment Results
Using the mixed logit modeling technique, the choice experiment data allowed us to directly estimate price premiums for six produce options when associated with the four attributes (local, organic, sold directly from the producer, and non-blemished). The mixed logit model results (Table 1) describe the propensity for a consumer to purchase a produce item given its association with a certain product attribute. Table 2 displays consumer WTP estimates in the form of a price premium in dollars per pound. These estimates represent the percentage markup of the average price consumers are willing to pay for the local and organic attributes across each of the produce options (Table 2).
Table 1. Mixed Logit Estimates for the Choice Experiment Including Demographic Controls, by Vegetable across New Hampshire, Maine, and Vermont
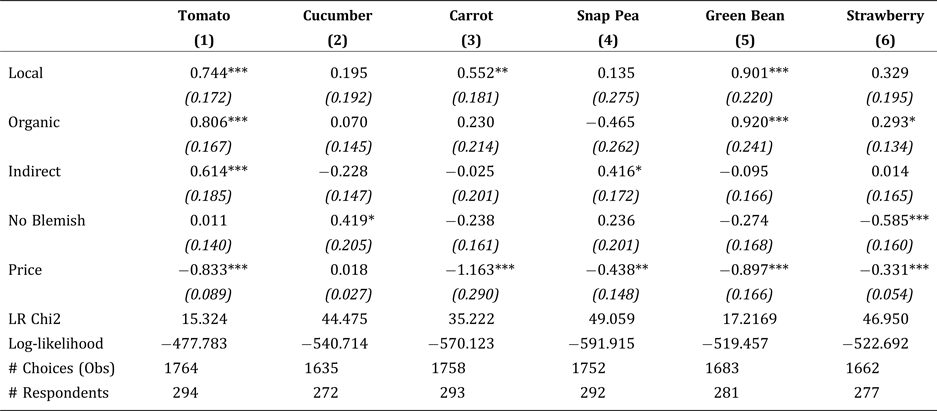
Notes: Data used in this estimation comes from the choice experiment described earlier. Numbers in parentheses are standard errors. *, **, *** indicate statistical significance at the 90 percent, 95 percent, and 99 percent levels, respectively. All models include a set of demographic controls for income, gender, education, and state, as well as an opt-out alternative, but have been omitted here for brevity. The mean coefficients on the random variables (local, organic, indirect, no blemish) are reported in Table 1.
Table 2. Willingness to Pay for Local and Organic Produce, by Vegetable

Note: WTP measures for a change in attribute level are derived using the mixed logit results from the choice experiment presented in Table 1. *, **, and *** represent statistical significance at the 90 percent, 95 percent, and 99 percent confidence levels, respectively. The 95 percent confidence interval is in parentheses below the premium.
Estimates on the local and organic variables are of particular importance in this study and are the focus of this discussion.Footnote 3 First, looking at the coefficient estimates in Table 1, we find the clearest set of preferences to be for local and organic tomatoes and green beans. That is, the positive and significant coefficient on the local and organic attribute suggests that respondents are more likely to choose one of those vegetables when associated with that particular attribute. Results also show that there is a relatively weak preference for locally grown carrots and organically grown strawberries, though no significant preference for purchasing cucumbers or snap peas that are either local or organic. These results are consistent with existing studies that examine a similar set of fresh produce options. (e.g., Campell et al. 2010; Onozaka and McFadden 2011; Adalja et al. Reference Adalja, Hanson, Towe and Tselepidakis2015; Pyburn et al. Reference Pyburn, Puzacke, Halstead and Huang2016). Many of the attribute-produce combinations had insignificant results, suggesting that these product characteristics do not impact the consumers’ propensity to purchase the produce option. Consumer comments, discussion with farmers, and experts in the field gave insight as to the cause of these non-significant values. Comments on the consumer survey indicated that cucumbers and snap peas are often not purchased or disliked altogether, which may explain the overall lack of significance on these options' coefficients. Local carrots were often praised by farmers for tasting much better than non-local, which can explain why consumers value local over other alternatives. Local strawberries are often heavily coated in pesticides, explaining why consumers may have a higher propensity to purchase organic strawberries, while local strawberries and blemished strawberries can mold at a faster rate than non-local or unblemished options. This explains why local options are not significant and the non-blemished attribute is highly significant and negative, indicating no significant propensity for local and a negative propensity to purchase blemished strawberries. These theories can also be applied to the significance, or lack thereof, on the WTP estimates.
To make this information more useful in the context of policy, we turn our attention to Table 2, which uses the results from Table 1 to calculate the specific price premiums associated with each of these produce-attribute combinations. Here, positive and significant coefficient estimates from Table 1 translate into positive and significant price premiums consumers are willing to pay for the corresponding local and organic attributes. In terms of the magnitude of the WTP estimates, results from Table 2 suggest that consumers are willing to pay, on average, a $0.89 per pound price premium for local tomatoes and a $0.97 per pound price premium for organic tomatoes. These premiums represent 42.6 percent and 46.6 percent mark-ups over the average price of a tomato for local and organic attributes, respectively. A similar set of results emerges for green beans, where results show that consumers are willing to pay a $1.00 per pound and $1.03 per pound premiums for local and organic green beans, respectively. These premiums represent about a 33 percent increase over the average price of green beans when purchasing local or organic. Further results from this analysis suggest a weak propensity for respondents to prefer locally grown carrots and organically grown strawberries, for reasons previously described. Specifically, we find that consumers from this survey are willing to pay a $0.47 per pound price premium for locally grown carrots and a $0.88 per pound price premium for organically grown strawberries. It should be noted that a robust finding from this analysis is the lack of any strong preference for local and organic attributes on cucumbers, snap peas, carrots, and strawberries. As these vegetables were chosen based on a series of focus groups and pilot studies, the expectation was to find some preference for the local attribute when associated with these goods. Instead, our findings suggest that, across the region, there is either no or a weakly significant preference for these produce options when associated with any product characteristic. This would suggest that local and organic premiums are not as robust as the literature suggests, for this region in particular. Overall, there is a medium-to-strong preference and willingness to pay for specific produce options when interacted with the local and organic attribute. However, the majority of the results suggest a weak or insignificant willingness to pay for many produce options.
Consumer Survey Conclusions
Results from our consumer survey suggest that northern New England consumers are highly variable in their WTP for particular produce options and their corresponding product attributes. When significant, the model estimates generally reveal a positive propensity to consume local and organic tomatoes and green beans, but the majority of produce-attribute combinations are insignificant. Across the region, green beans and tomatoes commanded a statistically significant price premium for either the local or organic attribute. This finding may support the role of “driver crops,” produce items that subsidize the low revenues generated by alternative produce options sold by a single grower. Besides, these results may hint at a disincentive for regional growers to diversify their crop production, despite the necessities for meeting the regional maximum growing capacities suggested by the results presented earlier. Until consumers are willing to pay for a variety of produce options, diminishing supplier constraints and meeting the regional growing capacities is unlikely. Further, there are no clear trends indicating that one state is willing to pay higher premiums for any one attribute when assessed across produce options or that locally grown produce commands a higher price premium over organic, as in previous studies (Adams and Salois Reference Adams and Salois2010; Loureiro and Hine Reference Loureiro and Hine2002; Onozaka, Nurse, and McFadden Reference Onozaka, Nurse and McFadden2010; Constanigro et al. Reference Constanigro, Thilmany, Kroll and Nurse2011; Bond, Thilmany, and Keeling-Bond Reference Bond, Thilmany and Keeling-Bond2008). Instead, consumer WTP for specific attributes and produce options varies across the region on a case-by-case basis, suggesting that New England farm profitability will vary depending on the types of produce offered and their associated attributes.
Investigating Local Demand: The Role of Intermediate Distributors
Though the consumer choice experiment suggests that consumers are only willing to pay price premiums for particular local produce options, qualitative results also suggest that consumers value many factors that stem from local agriculture, such as maintaining local farmland and supporting the local economy. For this reason, we explore the role of alternative sales avenues local suppliers can take to educate consumers, encourage produce diversification, and increase overall farm profitability. Based on our discussions with local farmers, we examine how restaurateurs in New Hampshire are working with local farmers and how their business ties may be further strengthened. Our survey aimed to identify and characterize the various types of food service establishments currently sourcing local food products and to assess the potential for increasing institutional purchases of locally grown products through the use of standard logistic modeling techniques. Moreover, our research extends previous literature by using a screening process to count only those whose monthly local food purchases are ≥ 41 percent of local purchasers . This threshold parameter is based on the average percentage of monthly purchases of locally grown food products among foodservice establishments found by the Food Processing Center study (2003). This screening process prevents establishments that purchase small percentages of local food from being classified as local buyers.
Intermediate Market Surveying Methods
There is a limited amount of intermediate market research specifically pertaining to the added value of local and organic meal options to a restaurant establishment. Using previous study results and expert local opinion, we surveyed 1,500 of the 3,063 eating and drinking establishments operating in New Hampshire (New Hampshire Lodging & Restaurant Association [NHLRA], 2017). Data collection began on October 12, 2017, and ended in March 2018 in order to capture and control for any purchasing trends during the winter months when local food production may be at its lowest. Respondents were asked to reflect on their food purchasing trends within the last calendar year (2017). From this sample, 109 usable surveys were obtained. Of the completed surveys, 81 percent are considered independent establishments, 3.6 percent are part of a chain, and 7.2 percent are corporate (6.3 percent identified as “other”). Of 109 establishments, 20.1 percent bought locally sourced food (i.e., ≥ 41 percent) while the remaining 79.8 percent did not (22 and 87 restaurants, respectively).
Curtis and Cowee (2009) define restaurants serving over 1,750 meals/week as “large” and less likely to purchase locally. Therefore, in this study we focused on restaurants serving fewer than 1,750 meals/week under the assumption that these small/mid-sized establishments will not require consistent, large volumes of food that local distributors may have difficulty supplying and therefore will be more likely to use local suppliers.
To identify factors pertinent to New England and inform the statewide survey, a pilot study was first employed in the Seacoast region of New Hampshire to identify perceptions of local food purchases and barriers between local food distributors and restaurants. Unlike Midwestern states, New Hampshire is limited by a much shorter growing season and by the variety of crops that can be grown. A series of preliminary interviews was conducted with outlets actively involved with local food distribution, including Maine's Farm Fresh, Unity Food Hub, UNH Extension, New Hampshire's Three Rivers Alliance, and the New Hampshire Farm to Restaurant Connection. These preliminary interviews provided insight into the supply side of the market and how the food network typically operates throughout New England. An interesting takeaway from these preliminary interviews suggests that local food distributors felt that they could compete with national suppliers in terms of price, quality, and quantity. Interview questions were shaped by these findings to identify consistency or inconsistency of perceptions on the intermediate consumer side. Previous surveys conducted by the Food Processing Center (2003), Ortiz (2010), and Starr et al. (2003) were also reviewed in structuring the survey questions. The definition of local, as it applies to local food, was determined by the survey respondents.
Logistic Model Design and Results
In order to understand the propensity of restaurant participants to buy and sell local produce options, we analyzed survey data using a binary logistic model as a function of the number of weekly meals served (<750, <1250, and <1750), establishment management type and length of time under this regime (Complete or Moderate Autonomy and Length of Autonomy), number of establishments (Store Locations), volume of annual produce purchased (Purchasing Volume), favorability of their supplier (Supplier Attributes), perceptions of food-related attributes (Food Attributes), and participant's knowledge of the products purchased for their restaurant (Production). In addition, composite variables were added to control for how the restaurants view the challenges of working with local growers and the broader benefits of buying locally, which may impact their propensity to purchase from local vendors (Challenges and Impacts, respectively). The logistic model results suggest that the coefficients for meals <750, Autonomy Length, Level of Autonomy (Moderately Autonomous), and the composite variable Production were statistically significant at the 5 percent level, all of which were positive besides the coefficient on <750 meals. The estimated coefficient for Impacts was positive and statistically significant at the 10 percent level.
Results suggest that buyers who served less than 750 meals/week were 19 percent less likely to buy local than restaurants that served greater than 750 meals/week, ceteris paribus. Buyers who indicated autonomy length of 5–7 years were 26.8 percent less likely to buy local than buyers with autonomy length of less than two years, ceteris paribus. Buyers with an autonomy length of 8–10 years were 30.5 percent less likely and buyers with an autonomy length of more than ten years were 28.8 percent less likely to buy local than buyers with an autonomy length of less than two years, ceteris paribus.
These marginal effects imply that buyers indicating that they were mostly autonomous were 38.1 percent more likely to purchase locally than restaurants with minimal autonomy, ceteris paribus. Mostly autonomous restaurants accounted for 12 percent of total respondents. Further, an additional one unit increase in the composite score for Production increases the probability of buying local by 4.4 percent. When there is no perceived value in knowing how and where a product was grown (score of 0), buyers are still 4.4 percent more likely to make local food purchases, but at a maximum score of 15, they are 52.8 percent more likely to purchase locally. An additional one unit increase in the composite score for Impacts increases the probability of buying local by 4.7 percent. When there are no perceived broader impacts of local food production, buyers are still 4.7 percent more likely to make local food purchases. However, if a buyer strongly agreed that local food had a positive impact on the local economy, the environment, and reducing their carbon footprint, they are 56.4 percent more likely to purchase locally.
Other qualitative results revealed where food service establishments make their food purchases. The most frequently cited source was from a national food supplier (49.5 percent), but nearly one-third of respondents indicated that they made food purchases directly from a farmer or regional foodservice distributor. When respondents were asked where they would prefer to make the majority of their food purchases, if given freedom of choice, almost half of the respondents indicated that they would like to purchase directly from a farmer (44 percent) despite the fact that 61 percent of buyers said “price” was a challenge to buying locally. Buying from a farmers’ co-op and buying from a regional distributor were tied for the second most preferred option, at 13.7 percent. Restaurants were least interested in purchasing from food hubs (1.8 percent) and farmers markets (2.7 percent).
Intermediate Market Conclusions
The results of this research imply that small and mid-sized restaurants, as defined by Curtis and Cowee (2009), have a negative propensity to purchase local food products. Specifically, restaurants serving fewer than 750 meals per week are 19 percent less likely to purchase local food products. A closer look at the raw data, however, revealed that 74 percent (n = 51) of buyers serving fewer than 750 meals per week sourced at least 11 percent of their food products from local sources. Only 1.9 percent of respondents sourced greater than or equal to the threshold parameter of 41 percent. Moreover, the implementation of a threshold parameter for the dependent variable may have caused the results to deviate from the previous literature. Upon closer inspection, it is clear that small and mid-sized restaurants do source a small percentage from local producers or suppliers, but they may not have the capacity to do so at larger volume due to resource and profit constraints.
Additionally, results indicated that restaurant owners and/or chefs who have been making food purchasing decisions for more than two years have a negative propensity to buy local. The significant negative coefficients on “length of autonomy” may be capturing aversion to changing long-standing business practices. The composite variables, Impacts and Production, were found to have significant and positive effects on the propensity to buy local. The coefficient on the valuation of attributes related to broader impacts of local food techniques may be capturing a moral obligation to purchase locally grown. In other words, restaurateurs may feel that it is their responsibility to help support the communities that they are serving. The positive coefficient on Production may be highlighting similar consumer awareness. Advocating the importance of personally knowing from whom and where their food came may help increase the intermediate purchase of locally grown food products.
According to survey results, there is little interest in making purchases from food hubs, but there is considerable interest in purchasing directly from co-ops and regional distributors. Additional responses, however, noted that making purchases from multiple suppliers can cost buyers valuable time and therefore impede their ability to source locally. Moreover, the lack of knowledge of available local suppliers and food hubs may be responsible for the information gap between New Hampshire restaurants and local food producers. Facilitating the distribution of information regarding the availability of local food products may help increase intermediate purchases of local food products.
Summary: Prospects for New England Agriculture
There are many economic and social benefits which stem from increasing local food production. In this article, we create a multifaceted framework to explore the different components necessary for expanding the local agricultural industry, using northern New England as a case study. Specifically, this article summarizes the results of a multi-year investigation of four principal areas of interest for local agriculture in northern New England: (1) production ceilings, (2) expansion constraints, (3) consumer preferences, and (4) the role of intermediaries, with each research avenue informing the next. The approach of sequentially investigating physical capacities, followed by elements of supply and demand using qualitative and quantitative methods, allows for a holistic view of the potential of local agriculture in the region.
First, we assessed the potential ceiling for regional produce sales by estimating county-level capacities for 51 products across 40 counties in Maine, New Hampshire, and Vermont. We estimated the capacity of county and state producers to satisfy local consumption needs. Results suggest the highest county and state capacities for vegetables and melons are in Maine counties, followed by Vermont and New Hampshire. Although all 16 Maine counties have county and state capacities of over 40 percent, six have county capacities of between 10 and 20 percent, indicating that many Maine counties (like those in NH and VT) do not have enough farmland in production to meet the needs of residents.
Given the results from the production ceilings research, we then investigated additional production barriers that can restrict counties/states from meeting their “maximum” local food capacities. To understand current and future expansion constraints, vegetable and fruit growers were interviewed in focus groups to answer questions regarding obstacles in maintaining and expanding production. Results suggest that the top constraints for northern New England farmers are related to labor, consumer constraints, managing the business aspect of the farm, and capital constraints. The operational constraints are similar to those of expansion, with barriers such as capital, labor,Footnote 4 demand, and time.
Understanding the demand for locally produced alternatives was the next step in understanding the potential for local agricultural production in northern New England. Consumer preferences were addressed in a consumer survey distributed to residents of Maine, Vermont, and New Hampshire in order to understand their qualitative and quantitative perceptions on local and organic produce. Qualitative questions gauged what consumers value when they purchase produce, while the quantitative aspect, a choice experiment, provided dollar estimates of what consumers are willing to pay for local and organic produce. No one state consistently valued a particular attribute over their alternatives, and the local attribute did not consistently demand the highest price premium across states and produce options. However, when price premiums were significant, they were generally positive and on the local, organic, and non-blemished WTP estimates. Overall, the upper bounds of the local percent price premiums are higher than premiums presented in previous literature, demonstrating the high variability in regional WTP for local produce. In addition, the high variation in estimates across the region supports the notion that premiums for local produce should be assessed at a state or county level. Overall, this suggests that northern New England farm profitability will vary depending on the types of produce offered and their associated attributes across the region, despite what consumers say they value. Though the local production capacities could be maximized through produce diversification and increasing farmland, as suggested by the production ceilings research, the regional supply and demand results demonstrate that these two primary goals may not be obtainable, ceteris paribus. Some supply constraints (e.g., capital, labor) could be internally solved by market forces given increases in the demand curve, but the demand investigation shows an overall weak and variable willingness to pay for the local attribute. On the contrary, most surveyed consumers, though not universally willing to pay more for locally produce options, stated that it is “very important” that their food purchases support maintaining local farmland and the local economy.
Our findings support that consumers in the Northeast care about maintaining local farmland and supporting the local economy but are only willing to pay price premiums for a few specific local produce options. To capitalize on consumer values and encourage paying price premiums for local produce, we investigated the role of intermediate markets. Results suggest that small and mid-sized restaurants have a negative propensity to make local food purchases greater than 41 percent of their total food purchases. Further results suggest that, if given a choice, restaurants would prefer to purchase local products directly from farmers, even though other distribution channels, such as food hubs, offer a service that helps aggregate purchases.
In summary, our study demonstrates that potential exists in northern New England states and counties to increase local agriculture production through diversification of produce and an increase in farmland acreage. The analysis of local agriculture supply and demand lends insight as to why current local agricultural market conditions exist and what factors need to be altered if production capacity maxima are to be reached. Supplier issues with capital, demand, and obtaining farmland, for example, are in direct opposition to meeting the growing capacity goals. Further, though consumers state that maintaining local farmland and supporting the local economy are important in their decision-making process, their willingness to pay for local produce is inconsistent and narrow in terms of their choices of produce, which also explains why local production probably can be expanded. Because of the benefits of local agriculture, along with the qualitative results of the consumer survey, alternative marketing methods may be the key to capitalizing on consumer values and increasing consumers’ willingness to pay for a variety of local products. One marketing alternative is purchasing in a restaurant setting. Buying local as an intermediate market proved to have its constraints, however. Further research on this avenue, and other intermediaries, could allow for consumers to make purchases aligned with their values which can decrease the constraints imposing on suppliers and, ultimately, move toward reaching local growing capacities.
Policy Insights from the Northern New England Study
The results presented here are, we hope, of immediate interest to the agricultural community in the region. There are also broader lessons to be gleaned from both the approach used and the influence these results can have on policy in northern New England and elsewhere. We conclude with a brief discussion of how our findings might affect future policies.
First, any attempt at expanding local production must consider the shortage of capable and willing labor in the region. Also, endemic in the New England region are thin, rocky soils, uneven topography, and substantial competition for prime farmland from residential, urban, and other sources. In addition, while much of New England is now heavily forested (Vermont, Maine, and New Hampshire currently are over 70–80 percent forested, compared to lows of 50–70 percent when the area was heavily farmed in the mid-1800s [Foster and Aber Reference Foster and Aber2004]), conversion of forested land back to agricultural land could affect both general ecosystem functions and greenhouse gas emissions (though new technologies may lessen these effects). Thus, of prime importance are policies that seek to both (1) lessen these labor and capital constraints, and (2) continue to consider the appropriate balance of uses for prime farmlands.
Second, knowledge of the premiums, if any, consumers are willing to pay for different types of produce in different regions can be useful in targeting agricultural policy (from direct investment programs to extension outreach) to those crops and areas with the highest probability for adequate profit margins. Our results indicate spatial differences across premiums by produce type, with tomatoes and green beans being consistently highly valued by consumers in our study. While it may be our own preconception of how New England is viewed by the rest of the U.S. (that is, as a homogeneous cluster of small states), these results show that policies to enhance local agriculture need to be modeled and implemented at a micro-level.
Third, better educated consumers can fundamentally change the demand for local produce. Our results show that there are substantial gaps in understanding of the benefits of buying local. It is particularly notable that the social capital benefits of buying local may be more of a motivation than more conventional benefits.
Fourth, new avenues for lessening the disadvantages small producers face in profitably competing in supplying food in the region, such as gaining economies of size, reducing marketing and transportation costs, and reducing transactions and setup costs, might become more tractable with a more cooperative, consolidated approach. However, our survey results of restaurateurs, while preliminary, show hesitancy on the part of medium-sized facilities and those managers/chefs who have been making purchasing decisions for longer periods of time to expand local purchasing. This may point to the need for improved information flows and cooperative supply efforts to expand these markets. While respondents were not particularly enamored with food hubs, the relative scarcity of operating hubs in the region may be contributing to the current lack of interest. Still, what our results say is “small” restaurants with “new” purchasers are the best potential clients for local producers. It would be worth studying this finding further to see if newer entrepreneurs may also be akin to early adopters.
Finally, while we argue that our results are not directly easily extrapolated to other regions due to the uniqueness of northern New England and its subregions, we believe our approach to the local agriculture issue provides a useful template for other studies. Furthermore, our (1) using secondary data to address local food capacities and potential for import substitution, (2) asking producers directly why they aren't supplying these products now (i.e., identifying constraints to agricultural expansion), (3) identifying consumer preferences for local produce, and (4) exploring expanded intermediate markets using input from local farmers, Extension, restaurants, and the general public provides a research model wherein each step in the process informed the next, and allowed us to adapt our approach accordingly.
Three major overarching findings seem to emerge: First, regions like northern New England are a long way from achieving anything close to self-sufficiency, or even some NGOs’ stated aspirations of producing half of its food locally. Second, while local food purchasers value the freshness of local produce, it may be that the aspect of supporting local agriculture—and more generally, local business—is more important. This facet of social capital, while important, may change the ceiling for local production. Finally, while we hoped that we could identify specific types of produce that local producers might target to obtain price premiums, it seems clear that the diversity of demand by consumers across the region does not lead to any obvious recommendations. Recall that the produce types chosen for this focused study were recommended by local farmers, giving us more confidence in our results.
Table 3. Estimated Marginal Effects of Independent Variables on the Willingness to Purchase Local Food Products for Binary Logit Model
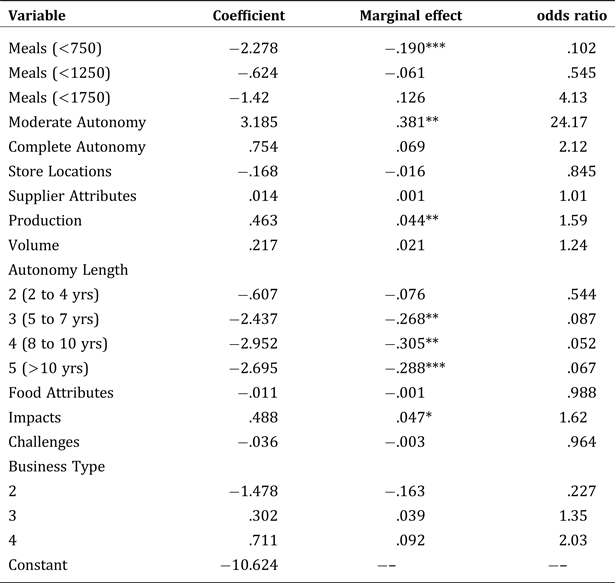
Notes: Data used in this estimation come from the logit model described earlier. *, **, *** indicate chi-square statistical significance at the 90 percent, 95 percent, and 99 percent levels, respectively.
Table 4. Variable Definitions
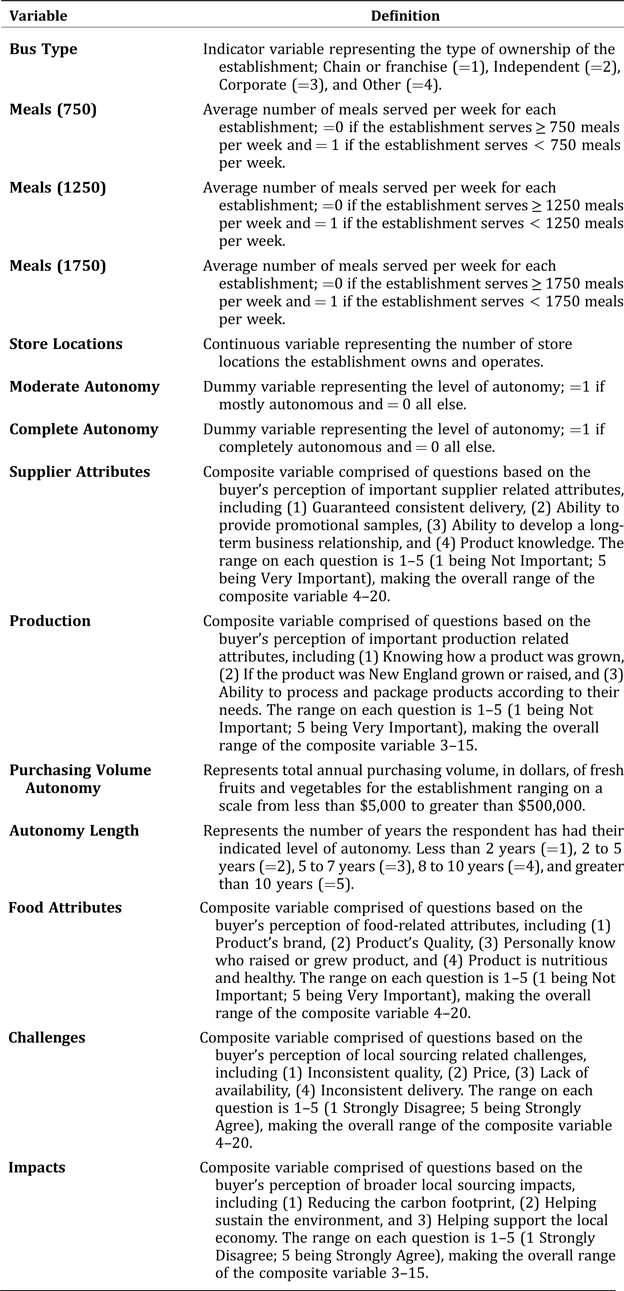
Note: These variables are used in the binary logit model described in Section 4.
Acknowledgments
This research was supported by the National Institutes for Food and Agriculture (NIFA), U.S. Department of Agriculture, and by the New Hampshire Agricultural Experiment Station under Multistate Project 1749. This is Scientific Contribution Number 2746. The authors wish to thank Nada Haddad, Richard Kersbergen, and the participants in our focus groups and surveys for valuable information and assistance. Finally, we thank the anonymous reviewers for valuable suggestions. Any opinions, findings, conclusions, or recommendations expressed in this publication are those of the author(s) and do not necessarily reflect the view of the U.S. Department of Agriculture.


 Open access