


NOMENCLATURE
- Δt
-
duration of flight in segment (min)
- ${C_D}$
-
drag coefficient
-
${C_{f1}}$
,
${C_{f2}}$
-
thrust-specific fuel consumption coefficients
-
${C_{f3}}$
,
${C_{f4}}$
-
descent fuel flow coefficients
-
$D$
-
drag (N)
-
$f$
-
fuel consumption for horizontal flight (kg/min)
-
${f_{{\rm{min}}}}$
-
fuel consumption for idle descent (kg/min)
-
${f_{{\rm{nom}}}}$
-
fuel consumption for descent from 8,000ft to 3,000ft (kg/min)
-
${F_{{\rm{arr}}}}$
-
spent fuel of arriving aircraft in exercise (kg)
-
${F_{{\rm{dep}}}}$
-
spent fuel of departing aircraft in exercise (kg)
-
${F_{{\rm{total}}}}$
-
spent fuel of all aircraft in exercise (kg)
-
${g_0}$
-
gravitational acceleration (m/s2)
-
$h$
-
geodetic altitude (m)
-
${H_p}$
-
geopotential pressure altitude (ft)
-
$m$
-
aircraft mass (kg)
-
$S$
-
wing planform area (m2)
-
$t$
-
time (s)
-
$T$
-
thrust in horizontal flight (kN)
-
${T_{{\rm{HR}}}}$
-
thrust (N)
-
${T_{{\rm{des}},{\rm{app}}}}$
-
thrust in approach configuration (N)
-
${T_{{\rm{max}},{\rm{climb}}}}$
-
maximum climb thrust (kN)
-
${V_{{\rm{TAS}}}}$
-
true airspeed (m/s)


Abbreviations
- ACFT
-
aircraft
- APP
-
approach control
- ATC
-
air traffic control
- ATCO
-
air traffic controller
- ATCOSIMA
-
Development of Common Air Traffic Controller Simulation Training Assessment Criteria based on Future Pan-European Single-Sky Targets
- ATM
-
air traffic management
- BADA
-
base of aircraft data
- ESTU
-
Faculty of Aeronautics and Astronautics at Eskisehir Technical University
- EU
-
European Union
- FFM
-
Frankfurt very high frequency omni-directional range
- FIR
-
flight information region
- FL
-
flight level
- ILS
-
instrument landing system
- INFO.
-
information
- LLZ
-
localiser
- MRVA
-
minimum radar vectoring altitude
- NO.
-
number
- OJTI
-
on-the-job-training instructor
- OPF
-
operation performance file
- ROC
-
rate of climb
- ROD
-
rate of descent
- RWY07
-
Runway 07
- SESAR
-
Single European Sky ATM Research
- ST
-
standard
- STD
-
synthetic training devices
- STDI
-
synthetic training devices instructor
- TMA
-
terminal airspace
- TUBS
-
Institute of Flight Guidance at Technische Universität Braunschweig
- ZFOT
-
Faculty of Transport and Traffic Sciences at University of Zagreb
Greek symbols
-
$\eta $
-
specific fuel consumption (kg/min·kN)
-
$\rho $
-
density of air (kg/m3)


Subscripts
-
i, i
$^{\prime}$
-
arriving and departing aircraft in exercise
- j
-
idle descent segment for arrivals
- j’
-
climb segment of departing aircraft
- k
-
approach thrust descent segment for arrivals
- k’
-
level-off segment of departing aircraft
- l
-
level-off segment for arrivals

1.0 INTRODUCTION
Air Traffic Controllers (ATCOs) are highly skilled and competent professionals who are responsible for maintaining aircraft separation, which directly influences air traffic safety. Besides, they are required to deliver expeditious and orderly flow of air traffic for efficient and economic provision of air traffic services(1). These important responsibilities require ATCOs’ training processes to be carried out with precision. ATCOs’ training and licensing processes are strictly regulated(2,3) . These regulations define phases of ATCO training (initial and unit), types of training (theoretical and practical), minimum prerequisites to become ATCO, two different ATCO licences, training plans etc(2). A common core content for initial training defines subjects, topics, taxonomy level and training methods(3). Besides comprehensive theoretical training, ATCO trainees should undertake practical training to improve their skills on Synthetic Training Devices (STD) to become competent in their profession. STDs are air traffic control simulators which enable real-time human-in-the-loop simulations with different aerodrome and radar control functionalities representing the real ATCO working environment, including airspace geometry, route configurations, flight procedures, aircraft performance etc(Reference Cetek, Aybek, Cinar and Cavcar4).
European regulation defines performance objectives for practical training that have to be checked and assessed at Air Traffic Control (ATC) simulators(2). Every ATCO trainee has to successfully perform these objectives and tasks at the minimum required level to satisfy the training and competence requirements. The progress of ATCO trainees during exercises is observed and monitored and finally evaluated by a certified air traffic control Synthetic Training Devices Instructor (STDI) or On-the-Job-Training Instructor (OJTI) holding assessor endorsement (instructors). After the exercise, instructors give trainees a final assessment score based on the required performance objectives.
The basic training, the first stage of the training process, requires trainees to learn and acquire a set of performance objectives listed in part ATCO.D.03(2). These objectives mainly include the safety objectives of air traffic. Therefore, each trainee should consistently demonstrate the required levels of performance and conduct, primarily regarding the safety of flight operations within the air traffic service. Although trainees are required to learn how to handle and separate aircraft in a safe way, along the training course, they are also expected to perform these tasks in a more competent manner in terms of flight efficiency, which will enable an expeditious and orderly flow of air traffic.
However, the above-mentioned regulations do not prescribe how to measure performance objectives, nor which additional assessment criteria are to be used for trainees’ evaluation. Also, the assessment process requirements do not define measuring and scoring criteria that include Single European Sky ATM Research (SESAR) flight efficiency goals for ATM development. These goals include reduction of flight time, flight distance, fuel consumption and CO2 emissions, which represent a challenge for future air traffic development due to the expected increase in air traffic(5,6) . There is guidance material on how to develop basic training plans, but assessment criteria considering flight efficiency indicators are not mentioned(7).
It is important to point out that, in practice, instructors also subjectively evaluate and consider trainees’ performance regarding flight efficiency, but they do not use any specified criteria and rather evaluate according to their impression of the trainees’ efficiency. When a trainee makes a major mistake or a number of minor mistakes, it could be necessary to adjust the traffic situation by giving additional instructions such as a number of turns that could influence flight distances and times, and ultimately fuel consumption. So, it could be expected that trainees with higher scores should be more efficient in air traffic control service provision regarding flight efficiency.
2.0 MOTIVATION
Various studies have been conducted recently to address the future ATCO simulation training issues regarding the implementation of new learning tools and technologies (Upgrove and Jafer(Reference Undegrove and Jafer8,Reference Undegrove and Jafer9) , Chayya et al.(Reference Chayya, Jafer, Coyne, Thigpen and Durak10), Coyne(Reference Coyne, Rice, Winter, Tamilselvan and Drechsel11)) and their impact on trainees’ learning skills such as cross-task cue utilisation and situational awareness (Falkland and Wiggins(Reference Falkland and Wiggins12)), as well as workload and engagement metrics (Bernhardt et al.(Reference Bernhart, Poltavski, Petros, Ferraro, Jorgenson, Carlson, Drechsel and Iseminger13)). These studies provide important insights into the development of ATCO simulation training content within the framework of regulations. On the other hand, how to improve the training assessment regarding flight efficiency considering future ATM system targets is a subject that has not been touched upon by regulating bodies or academia.
To address this gap, EU Erasmus+ Project Development of Common Air Traffic Controller Simulation Training Assessment Criteria based on Future Pan-European Single-Sky Targets (ATCOSIMA) started in 2017 under the consortium of three higher education institutions: the Faculty of Aeronautics and Astronautics at Eskisehir Technical University (ESTU), the Faculty of Transport and Traffic Sciences at University of Zagreb (ZFOT) and the Institute of Flight Guidance at Technische Universität Braunschweig (TUBS). The main task of the project is to define and develop new measuring and assessment criteria for the practical part of basic air traffic controller training. The project attempts to improve the current methodology for how ATCO trainees are evaluated during simulation exercises and assessment, which should result in better trainee competencies by taking into consideration integrated pan-European targets regarding flight efficiency.
The project is based on two stages: baseline simulations to evaluate ATCO trainees’ performance assessed using the current assessment criteria, and the development and testing of new assessment criteria which incorporate flight efficiency indicators. Both stages include real-time human-in-the loop simulation exercises in ATC simulators and integrated ATC-Flight cockpit simulator exercises(Reference Cetek, JuriČiĆ, Feuerle and RadiŠiĆ14).
The first stage, viz. real-time ATC simulator exercises, was conducted at ZFOT and ESTU on the Micronav BEST Radar ATC simulator by 19 trainees, of whom 14 were from the ZFOT and 5 from ESTU. All trainees were selected after previously finishing the approach radar control course at their respective university. Trainees had to practise 10 different radar approach control exercises in simulated Frankfurt Terminal Airspace (Frankfurt TMA). All exercises had different traffic situations with different levels of traffic complexity and number of conflicts, which grew with the number of exercises. By the end, a total of 190 simulations were carried out and a huge amount of data was collected during this project stage.
The preliminary results of the simulations in the first stage of the project were published in the paper Preliminary Results and Analysis of Real-Time ATC and Flight Cockpit Simulations. The authors carried out a statistical correlation analysis to study the relationship between ATCO trainees’ instructions and various flight efficiency indicators for simulator exercises done at both ZFOT and ESTU (ATC simulator)(Reference Cetek, Antulov-Fantulin, Frost, Donmez, Kaplan and RogoŠiĆ15).
The correlation of the ATC simulator exercises’ data aimed to find a relation between ATC instructions and performance (total flight level instructions, total speed instructions and assessment score) and defined flight efficiency indicators in the approach phase of flight (average aircraft spacing on the ILS course, total distance flown and exercise duration). Assessment score analysis showed a moderate negative −0 correlation of −0.494 with the total distance flown, while all other assessment score correlations were not significant(Reference Cetek, Antulov-Fantulin, Frost, Donmez, Kaplan and RogoŠiĆ15). These results imply that the assessment score is not connected with the defined flight efficiency indicators, although in practice instructors sometimes award trainees higher scores if they are more efficient in services provision. Fuel consumption was not included in the calculations within this preliminary analysis.
The aim of the current study is to investigate further correlations between the fuel consumption and assessment score using a more detailed approach for the first-stage real-time ATC simulator exercises conducted at ZFOT and ESTU. Therefore, the research aims to verify whether the current assessment criteria and the instructors’ evaluation of trainees’ performance are related to the fuel consumption as a flight efficiency indicator. The assumption is that trainees showing better achievement and having higher assessment scores should have better flight efficiency, i.e. less fuel consumption. The hypothesis, therefore, assumes that trainees’ achievement and fuel consumption have moderate negative correlation. To test this hypothesis, two initial tasks were required: analysis of trainees’ assessment scores, and extraction of aircraft trajectory data from simulators. These tasks were performed within the study of Rogosic(Reference RogoŠiĆ16).
3.0 METHODOLOGY
The general methodology of this study consists of three steps: real-time simulations performed at the BEST ATC radar simulator; data extraction and post-processing for fuel consumption calculations, and correlation analysis of the results of fuel consumption and trainees’ assessment scores given by ATC instructors (Fig. 1). As mentioned above, this research focuses on the baseline real-time simulations performed at the BEST ATC radar simulator by 19 trainees under the supervision and monitoring of ATC instructors.

Figure 1. General methodology: real-time ATC radar approach simulation circuit and data collection, extraction, post-processing and correlation analysis processes.
3.1 Real-time simulation setup and exercise scenarios
The process of ATC training involves at least three people: a trainee, an instructor and a pseudo-pilot(Reference PavlinoviĆ, JuriČiĆ and Antulov-Fantulin17). The simulation circuit consists of an ATC trainee workstation and pseudo-pilot workstations connected to the system manager, in which all airspace and air traffic data and communication settings are stored (Fig. 1). The trainee’s ATC workstation includes a radar screen, communication panel, keyboard, mouse and strip holders for paper flight strips. The pseudo-pilots are responsible for the movements of arriving and departing aircraft according to the instructions given by the trainee on a radio frequency. During the simulations, the system manager records the audio and video files for replay as well as simulation logs during the exercises. These data are crucial for the estimation of flight trajectories in order to calculate their fuel consumption.
The airspace used for the simulations was the generic Frankfurt TMA, which was unknown to the trainees from both ZFOT and ESTU before the exercises (Fig. 2). This fact enables the elimination of bias caused by earlier trainees’ airspace adjustment and assured consistency of data. The active runway in all exercises was RWY07. Overall, four instructors prepared trainees to work in the new airspace environment and to use new ATC procedures.

Figure 2. Simulated airspace of Frankfurt TMA.
The simulated airspace of Frankfurt TMA was defined by several navigation points. Some of the points were traffic entry and exit points (RASVO, COLAS, KERAX, OLALI, SIRPO, XINLA). The neighbouring control centres were defined, and transfer procedures established with Langen North, Langen South and Frankfurt Tower. ASIMA point was the final approach point for RWY07, where aircraft had to be transferred to Frankfurt Tower.
Ten exercises were carried out by trainees. The details of the exercises are given in Table 1. The number of departing aircraft remained between three and four after the first two exercises. The learning process during the exercises was focused on controlling the arriving traffic. As the number of aircraft rose, trainees’ workload also should have risen. Due to the dispersed entry points of aircraft converging towards ASIMA point, the air traffic complexity was ascending.
Table 1 Details of radar approach control exercises performed in ATC simulations

The expected duration of the exercise did not increase even when the number of aircraft was growing. This put trainees in a situation of controlling a greater number of aircraft in the same period. Considering the increase in air traffic complexity, a greater number of mistakes was expected(Reference RogoŠiĆ16).
3.2 Trainees’ assessment scores
Trainees’ performance assessments were done according to the existing performance objectives defined by European regulations(2), while measuring criteria were adopted according to common practice and had been coordinated and agreed by both institutions (ZFOT and ESTU). Instructors (three from ZFOT and one from ESTU) supervised and evaluated the trainees’ performance during simulations. To make the evaluation and measuring process more objective, in the used assessment criteria, different types of mistakes that trainees could make were considered. Instructors evaluated trainees’ performance by noticing and counting mistakes. The number and type of mistakes affected the trainees’ achievement. When a serious mistake or numerous minor mistakes were made, trainees needed to adjust the traffic situation. This included giving additional instructions that could have contributed to the flight duration and distance flown, as well as heading instructions and turns made, and, finally, influenced fuel consumption.
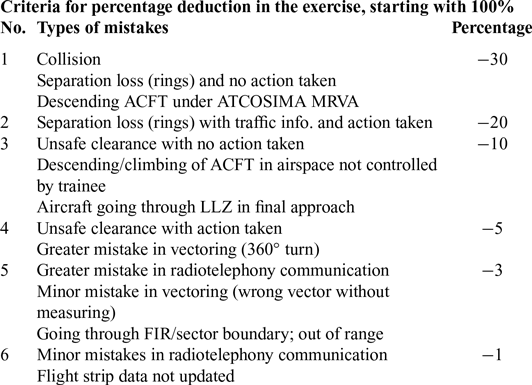
Every trainee began each exercise with a full score of 100%. Each time a trainee made a mistake, the score was decreased depending on the nature of the mistake. Mistakes were categorised based on their safety effect. There were six categories, as presented in the ATCOSIMA evaluation form (Table 2): (1) collision, separation loss with no action taken, descend below MRVA; (2) separation loss with traffic info and action taken; (3) unsafe clearance with no action taken, descending/climbing aircraft in airspace not controlled by trainee, aircraft going through the LLZ on the final approach; (4) unsafe clearance with action taken, greater mistakes in vectoring; (5) greater mistakes in radiotelephony communications, minor mistakes in vectoring, going through FIR/sector boundary; (6) minor mistakes in radiotelephony communications, flight strip data not updated.
Table 2 Assessment criteria for the simulation exercises
At the end of each exercise, trainees received a final assessment score for their performance based on the types of mistakes that they had made. The lowest passable score needed to fulfil the performance objective was 75%. The final assessment score for 19 trainees is presented in Table 3.
Table 3 Assessment scores of trainees per exercise
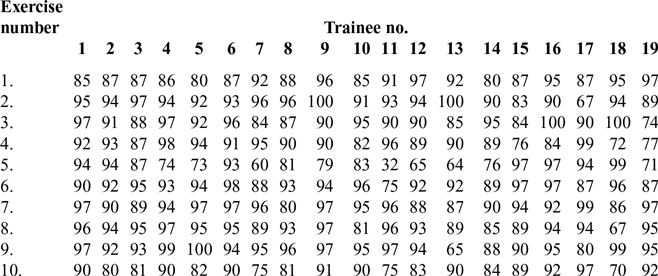
Note that some students could not reach the passable score and achieved less than 75% (for example students 4, 5, 7, 11, 12 and 13 in exercise number 5).
3.3 Fuel consumption calculations
The BEST simulator does not offer an option to provide output data regarding fuel consumption. Therefore, it was necessary to define a procedure to extract adequate data from the BEST simulator replay files for the fuel consumption calculation. The replay function was used for each aircraft separately. The data collection for arriving aircraft started at the time of initial call and lasted until the time that aircraft started to descend below 3,000ft and was transferred to Frankfurt Tower (FFM point).
The data collection for departing aircraft started at the time when aircraft reached 3,000ft and lasted until the time when aircraft flew over the exit point of the simulated Frankfurt TMA. All relevant flight data were written in Excel form.
Table 4 presents an example of the aircraft flight data necessary for the fuel calculation. Each row represents the horizontal, climb or descent part of a trajectory. Columns present the start (‘Start’) and end time (‘End’) of each part of the trajectory (later calculated in the ‘Minutes’ column), the start (‘FL S’) and end flight level (‘FL E’), the average speed for each part of the trajectory (‘Speed’), the nautical miles (‘distance’) flown (NM), the flight level difference (‘FL difference’) and the rate of climb/descent (‘ROC/ROD’), if there is a flight level change in that row.
Table 4 Example data for arriving aircraft

The data collection for the fuel consumption calculation was the most time-consuming part of the research, lasting several months and including four persons. The fuel consumption was calculated for each aircraft separately and summed as a total for all aircraft in the exercise. This allowed us to compare fuel consumption and trainees’ achievements per exercise.
The fuel consumption directly affects two different key performance areas according to the SESAR ATM master plan: environment and operational efficiency(Reference Cetek, Aybek, Cinar and Cavcar4). The more fuel that is consumed during the flight, the more CO2 emissions are generated, and the operational costs for the airline are higher. Approximately 1 ton of fuel produces 3.15 tons of CO2. So, a decrease in fuel consumption is an important indicator to consider to reduce the greenhouse effect as well as the costs of airline operations(Reference Novak, Bucak and RadiŠiĆ18).
For this research, the fuel consumption was calculated using EUROCONTROL’s BADA version 3.8. The BADA fuel consumption is based on a total-energy model which equates the rate of work done by forces acting on the aircraft and the rate of increase in potential and kinetic energy(Reference Nuic19):
 \begin{equation}\left( {{T_{{\rm{HR}}}} - D} \right){V_{{\rm{TAS}}}} = m{g_0}\frac{{dh}}{{dt}} + m{V_{{\rm{TAS}}}}\frac{{d{V_{{\rm{TAS}}}}}}{{dt}}\end{equation}
In Equation (1), T HR and D represent the thrust and drag forces (N), respectively, while m is the aircraft mass (kg), h is the geodetic altitude (m), V TAS is the true airspeed (m/s) and g 0 is the gravitational acceleration of 9.80665m/s2.
Since all the exercises used only a single type of aircraft (–Airbus A320), the fuel consumption calculations were done only for that type. The aircraft mass (64,000kg) was taken from OPF. Arriving traffic approached the RWY in the horizontal approach segment (level-off) and descent approach segment, while departing traffic was on the climb or horizontal segment (Fig. 3). Each of the segments required different calculations. The descent segment was divided into two different calculations: (1) when aircraft was descending above 8,000ft and (2) from 8,000ft to 3,000ft.

Figure 3. Flight profile models of arriving and departing aircraft within Frankfurt TMA.
Coefficient values from the Operation Performance File (OPF) for the A320 were used in the formulations. First, the fuel consumption of the aircraft on the descent segment above 8,000ft was calculated using the coefficients from the OPF file. The calculation with that data gave unrealistic results for fuel consumption. To obtain realistic values, the idle descent calculation was used for aircraft on descent above 8,000ft:
 \begin{equation}{f_{{\rm{min}}}} = {C_{f3}}\left( {1 - \frac{{{H_p}}}{{{C_{f4}}}}} \right)\end{equation}
In Equation (2), H p is the geopotential pressure altitude (ft) and C f3 and C f4 are the fuel consumption coefficients, given as 8.89 and 81,926 from the OPF. To estimate the fuel consumption from 8,000ft to 3,000ft, the following mathematical expression was used:
 \begin{equation}{f_{{\rm{nom}}}} = \eta \cdot {T_{{\rm{des}},{\rm{app\;}}}}\end{equation}
where T des,app (N) represents the aircraft thrust in the approach configuration. It was calculated using the coefficient for thrust in the approach phase and the maximum climb thrust. The fuel consumption for horizontal flight was calculated using the following mathematical expression:
 \begin{equation}f = \eta \cdot T\end{equation}
Where the specific fuel consumption, $\eta $
(kg/min·kN), is calculated using the following formulation:
$\eta $
(kg/min·kN), is calculated using the following formulation:
 \begin{equation}\eta = {C_{f1}}\left( {1 + \frac{{{V_{{\rm{TAS}}}}}}{{{C_{f2}}}}} \right)\end{equation}
In Equation (5), V TAS is expressed in kn and the fuel consumption coefficients C f1 and C f2 are given as 0.94 and 100,000, respectively, from the OPF. For a given airspeed V TAS, the thrust T is assumed to be equal to the drag D, such that
 \begin{equation}D = \frac{1}{2}\rho \cdot V_{{\rm{TAS}}}^2\cdot S\cdot{C_D}\end{equation}
In Equation (6), the term C D is the drag coefficient of the aircraft calculated using the coefficients defined in the OPF. The parameter ρ represents the density of air (kg/m3) at a given altitude, and S is the wing planform area of the aircraft (equal to 122.6m2 for the A320). For the climb segment, the fuel consumption was calculated using the following mathematical expression:
 \begin{equation}{f_{{\rm{nom}}}} = \eta \cdot {T_{{\rm{max}},{\rm{climb}}}}\end{equation}
In Equation (7), ${T_{{\rm{max}},{\rm{climb}}}}$
represents the maximum climb thrust, which is calculated using the coefficients for thrust during climb and the aircraft altitude. To obtain the total fuel spent in kg, the fuel consumption was multiplied by the duration of flight in each segment (Δt) for arriving and departing aircraft, such as
${T_{{\rm{max}},{\rm{climb}}}}$
represents the maximum climb thrust, which is calculated using the coefficients for thrust during climb and the aircraft altitude. To obtain the total fuel spent in kg, the fuel consumption was multiplied by the duration of flight in each segment (Δt) for arriving and departing aircraft, such as
 \begin{equation}{F_{{\rm{arr}}}} = \mathop \sum \limits_{i=1}^n \left( {\mathop \sum \limits_{j=1}^m {f_{{\rm{min}}j}}\cdot{\rm{\Delta }}{t_{ij}} + \mathop \sum \limits_{k=1}^o {f_{{\rm{nom}}k}}\cdot{\rm{\Delta }}{t_{ik}} + \mathop \sum \limits_{l=1}^p {f_l}\cdot{\rm{\Delta }}{t_{il}}} \right)\end{equation}
 \begin{equation}{F_{{\rm{dep}}}} = \mathop \sum \limits_{i=1}^{n\prime } \left( {\mathop \sum \limits_{j=1}^{m\prime } {f_{{\rm{nom}}j\prime }}\cdot{\rm{\Delta }}{t_{i\prime j\prime }} + \mathop \sum \limits_{l=1}^{p\prime } {f_{l\prime }}\cdot{\rm{\Delta }}{t_{i\prime l\prime}}} \right)\end{equation}
 \begin{equation}{F_{{\rm{total}}}} = {F_{{\rm{arr}}}} + {F_{{\rm{dep}}}}\end{equation}
In Equations (8) and (9), i and i’ are the indices of arriving and departing aircraft in the exercise, respectively, while j, k and l are the indices of the idle descent, approach thrust descent and level-off segments for arrivals. Similarly, j’ and k’ represent the climb and level-off segments of departing aircraft. The sum of the fuel consumption values for arriving and departing aircraft (F arr and F dep) provides the total fuel spent in a given exercise. Depending on the exercise and trainee’s instructions, the number of flight segments varies significantly.
All the fuel calculations were done in Excel 2013, which allowed a tabular data overview. Table 5 presents the maximum, minimum, average and standard deviation of the fuel consumption for all the exercises and trainees. The minimum and maximum fuel consumption grow from exercise number 1 to –10, which is reasonable considering the increasing number of aircraft in each exercise. The average fuel consumption also grows, while the greatest increase in fuel consumption appeared between the first and second exercises. In the first exercise, there were five arriving aircraft, while the second exercise had a mix of six arriving and two departing aircraft, so such an increase is reasonable.
Table 5 Variation of fuel spent in exercises

The standard deviation values present an interesting view regarding the exercise execution. The minimum standard deviation was calculated for the first exercise, while the maximum was calculated for the ninth exercise. This can be interpreted as indicating that trainees had a similar approach when resolving traffic situations in the first exercise but significantly different approaches when resolving traffic situations in the ninth exercise.
4.0 RESULTS OF CORRELATION ANALYSIS
The hypothesis of a negative correlation between trainees’ assessment score and fuel consumption was tested using RStudio. Trainees’ assessment score for each of the exercises and the fuel consumption calculated for that exercise were taken as data points. Therefore, each of the exercises has its own correlation coefficient. The Shapiro–Wilk test was used to check the normality of the continuous variables. The results of the test are presented in Table 6. In case of normally distributed data, Pearson’s test was used, and in other cases Spearman’s test(Reference Cetek, Antulov-Fantulin, Frost, Donmez, Kaplan and RogoŠiĆ15,Reference Shapiro and Wilk20–Reference Washington, Karlaftis and Mannering22) . The values of the coefficients are categorised in Table 7 (Reference UdoviČiĆ, BAŽdariĆ, BiliĆ-Zulle and PetroveČki23).
Table 6 Shapiro–Wilk normality test results

Table 7 Categorisation of coefficient values(Reference UdoviČiĆ, BAŽdariĆ, BiliĆ-Zulle and PetroveČki23)

This categorisation was used to interpret the results of the correlation for each exercise (Table 8). The P-value for each correlation coefficient of the exercise is shown in the last column of Table 8. P-values less than the significance level of 0.05, indicating a statistically significant correlation between the assessment scores and fuel consumption, were seen only for exercises 2 and 3, in which a moderate positive correlation was found. A positive correlation implies that students who had higher assessment scores also had higher fuel consumption while providing air traffic control.
Table 8 Correlation between students’ success and fuel consumption

None of the exercises showed the expected correlation defined in the research hypothesis, i.e. a moderate negative correlation with coefficient between 0.50 and 0.75. Indeed, there was a wide variation in the correlation coefficients.
5.0 CONCLUSIONS AND DISCUSSION
The correlation results show that the research hypothesis cannot be confirmed. Fuel consumption and trainees’ assessment scores did not correlate in the expected way. For most of the exercises, there was no correlation, or the correlation was even positive. Several conclusions can be drawn regarding why these two indicators did not correlate, which should be discussed in the context of ATCO training. Firstly, the assessment criteria that were used in the project do not contribute to fuel savings. Secondly, the evaluation of the trainees’ achievement by the instructors during the assessment focuses on safety performance but is not related to flight efficiency, which should be most relevant at the beginning of training when trainees practise to provide safe air traffic control but obviously some of their actions contribute to the performance of safe but inefficient traffic. This explains the moderate positive correlation found in exercises 2 and 3 when trainees were at the beginning of the training process and had to adapt to the working environment, human–machine interface, communication equipment and ATC procedures and strip marking. These correlations imply that trainees performed less efficiently to cope with safety since in these exercises there was a mix of arriving and departing aircraft in contrast to exercise 1. The same effect can be seen with exercise 5, where there were seven arriving aircraft, after three exercises in a row with six arriving aircraft. In exercise 7, although there was an additional arriving aircraft, no positive correlation was found. We assume in this regard that trainees improved their skills through the previous exercises and adapted to more complex traffic situations and worked more efficiently. Finally, the most complex exercises (8, 9 and 10) showed no correlation, which implies that trainees were more efficient then at the beginning of the training, but this was not evaluated by instructors probably because of the safety criteria (some trainees had 65% or 70% performance, Table 3).
These conclusions and those of Ref. [Reference Undegrove and Jafer8] are important for further ATCOSIMA project activities and the second stage of real-time simulations. They justify the need to develop new assessment criteria that will include SESAR flight efficiency indicators. Also, these results show that additional research should be done on the definition of scenario exercises and their complexity in terms of entry/exit points, ATC procedure strategies, aircraft mix, number of arriving aircraft etc.
One question that can be raised is whether it is important to focus on flight efficiency, among safety objectives, during basic training. However, if we look at the assessment scores in Table 3 and notice that some of the trainees had the same score per exercise, we can conclude that additional evaluation criteria could be used to fine-tune the trainees’ performances and scores by including flight efficiency indicators.
The development and evaluation of such additional criteria will be a major output of the ATCOSIMA project.
ACKNOWLEDGEMENTS
The data used in this study were obtained from the results of the ATCOSIMA project funded by the Erasmus+ Program of the European Union under contract 2017-1-TR01-KA203-046515.


 Open access