


In the past decade, a number of large, longitudinal, cross-contextual historical and ethnographic databases have been used to test theories of group dynamics (Atkinson and Whitehouse Reference Atkinson and Whitehouse2011; Johnson Reference Johnson2005; Peoples and Marlowe Reference Peoples and Marlowe2012; Watts et al. Reference Watts, Greenhill, Atkinson, Currie, Bulbulia and Gray2015). In spite of their potential impact on our understanding of prehistory, some of these theories have never been thoroughly tested using archaeological data (e.g., Mithen Reference Mithen, Whitehouse and Martin2004; Whitehouse and Hodder Reference Whitehouse, Hodder and Hodder2010). However, the emergence of large cross-cultural archaeological and ethnographic databases (e.g., electronic Human Relations Area Files) as well as the application of multivariate statistical and network analysis techniques now offer the opportunity to integrate data from ethnographic, historical, and archaeological resources into a single diagnostic framework for the purpose of hypothesis testing. These approaches bring us closer to examining and validating claims regarding the dynamics of human groups in prehistoric contexts. In this essay we outline a new method of Material Correlates Analysis (MCA), which includes targeted data gathering and use of a specific set of statistical techniques for the purpose of hypothesis testing using ethnographic and archaeological material.
In our example, we use a theory developed in the cognitive anthropology of religion—the Modes of Religiosity theory (Whitehouse Reference Whitehouse1995)—as a framework to assess the causal link between social bonding through rituals and the generation of the required levels of group cooperation in emerging sedentary agriculturalist communities, during the initial agricultural transition in southwest Asia. The modes theory describes different forms of group or social bonding based on a distinction between low-frequency high-arousal experiences—classed as imagistic rituals—and high-frequency low-arousal experiences—classed as doctrinal rituals (Whitehouse Reference Whitehouse1995). Pertinent to our research, recent analysis of large datasets of rituals from across the globe demonstrates that agricultural societies appear to be characterized by a tendency toward the doctrinal mode of religiosity (Atkinson and Whitehouse Reference Atkinson and Whitehouse2011; Whitehouse and Hodder Reference Whitehouse, Hodder and Hodder2010; Whitehouse et al. Reference Whitehouse, Mazzucato, Hodder, Atkinson and Hodder2014). Despite a number of promising qualitative observations, the full potential of the modes theory to examine social cohesion in the archaeological record has not been utilized in any systematic manner—particularly in relation to the agricultural transition—as any examination of the modes using archaeological data inherently has one major problem: that ritual frequency and arousal levels are often impossible to discern archaeologically with confidence due to material culture gaps in the archaeological record. Typically, ritual activity and religious beliefs can only be inferred indirectly, making results less certain than the documented evidence available for ethnographic samples. To limit the effect of this problem, the MCA method we outline uses sets of relevant material correlates derived from ethnographically known imagistic and doctrinal cultures, previously classified by Atkinson and Whitehouse (Reference Atkinson and Whitehouse2011), to examine (inferentially) the presence of imagistic or doctrinal modes of social cohesion in otherwise scant evidence from prehistory.
In what follows we use the Modes of Religiosity theory to illustrate the application of MCA for the purpose of hypothesis testing using a combination of ethnographic and archaeological data. By creating a generalized linear model matrix combining ethnographic and archaeological data, we demonstrate how sets of ritual and nonritual material correlates can be used to classify each of the archaeological cases in terms of a percentage probability of representing one of the two modes. In doing so, we examine one hypothesis—namely, that the agricultural transition is connected with the emergence of a more doctrinal mode to achieve the required levels of group cohesion in emerging sedentary agriculturalist communities. In presenting our example we (1) outline the application of the MCA method to examine a theory developed and tested by means of anthropological data in the archaeological record and (2) make the initial steps in expanding the reach of the modes theory beyond the currently available historical and ethnographic sources, to test certain hypotheses longitudinally in relation to prehistory.
MODES OF RELIGIOSITY
The Modes of Religiosity theory (Whitehouse Reference Whitehouse1995) proposes two principal courses for the transmission of religious ideas through ritual activity: the imagistic mode and the doctrinal mode. Imagistic ritual practice (low frequency, high arousal) involves the transmission of religious ideas through irregularly occurring, highly emotive experiences stored and recalled via episodic memories that specify who else was present during a given collective ritual performance (Whitehouse Reference Whitehouse1995, Reference Whitehouse2002). They are associated with highly cohesive local groups such as bands or tribes that rely on high levels of dependence between group members. In contrast, the doctrinal mode (high frequency, low arousal) centers on the transmission of religious ideas through frequent repetition of highly prescribed ritual practices that are stored in an individual's semantic memory specifying generic roles rather than individual participants. The doctrinal mode is associated with larger, (often) more geographically extensive groups. The doctrinal mode is considered a more recent development connected with the emergence of more centralized societies (Whitehouse Reference Whitehouse2004; Whitehouse and Hodder Reference Whitehouse, Hodder and Hodder2010).
To date, the modes theory has been readily used as a methodological framework in anthropological, historical, and cognitive science research using a variety of historical and ethnographic sources (Atkinson and Whitehouse Reference Atkinson and Whitehouse2011; Malley Reference Malley, Whitehouse and Laidlaw2004; Mithen Reference Mithen, Whitehouse and Martin2004; Naumescu Reference Naumescu2008; Pachis and Martin Reference Pachis and Martin2009; Whitehouse Reference Whitehouse2002, Reference Whitehouse2004; Whitehouse and Hodder Reference Whitehouse, Hodder and Hodder2010; Whitehouse et al. Reference Whitehouse, Mazzucato, Hodder, Atkinson and Hodder2014; Xygalatas Reference Xygalatas2012). Directly relevant to our research focusing on the agricultural transition is the extensive ethnographic examination of group cohesion via ritual activity by Atkinson and Whitehouse (Reference Atkinson and Whitehouse2011). Analyzing data on frequency, arousal level, and social structure for 645 religious rituals from a global, cross-cultural sample of 74 cultures via the electronic Human Relations Area Files, they statistically demonstrate that agricultural “intensity” is a significant predictor of mode of religiosity—that ritual frequency correlates positively with agricultural intensity and that dysphoric intensity correlates negatively with agricultural intensity. They define agricultural intensity on a scale from no reliance on agriculture to full dependence on agriculture (including cultivated crops and herded animals). This study suggests that agricultural activity may have been responsible for a general increase in the frequency of communal rituals and indirectly presented opportunities for other features of the doctrinal mode to appear—for example, the formation of uniform and prescribed regional traditions. Extrapolating from the ethnographic research by Atkinson and Whitehouse (Reference Atkinson and Whitehouse2011), we use the MCA method to examine the connection (if any) between group cooperation during the initial agricultural transition in southwest Asia and the emergence of the doctrinal mode of religiosity.
ANALOGY, ETHNOARCHAEOLOGY, AND THE MCA APPROACH
Since the nineteenth century, archaeologists have used some form of ethnographic analogy to interpret archaeological material (David and Kramer Reference David and Kramer2001; Sillar and Joffré Reference Sillar and Joffré2016; Stiles Reference Stiles1977). In the context of the new or processual archaeology of the 1960s, ethnoarchaeology gained prominence as a subdiscipline of archaeology. In one of the formative essays in the development of ethnoarchaeology, Ascher (Reference Ascher1961) discusses a number of the essential theoretical and methodological issues associated with the use of ethnographic analogy to infer past behavior. Middle Range Theory (Binford Reference Binford1967, Reference Binford1978)—which advocates the use of analogical inference and the objective testing of hypotheses to examine connections between the present and the past—greatly influenced the development of ethnoarchaeology. A principal objective of ethnoarchaeology has been to move away from simple suppositions of cultural continuity and to establish a more comprehensive approach to interpretation by identifying predictable features of human behavior (David and Kramer Reference David and Kramer2001; Sillar and Joffré Reference Sillar and Joffré2016; Stiles Reference Stiles1977). Since the 1960s, a number of cross-cultural ethnographic analogies have been utilized to interpret individual objects and techniques (production techniques and uses), as well as wider issues of social and economic organization such as exchange networks and social hierarchies (Sillar and Joffré Reference Sillar and Joffré2016; Stiles Reference Stiles1977).
However, the validity of ethnographic analogy has been heavily debated (Ascher Reference Ascher1961; Binford Reference Binford1967, Reference Binford1978; Fewster Reference Fewster2006; Gould Reference Gould1980; Gould and Watson Reference Gould and Watson1982; Hodder Reference Hodder1982, Reference Hodder1986; Lane 1994/Reference Lane1995; Orme Reference Orme and Renfrew1973, Reference Orme1974; Oswalt Reference Oswalt, Donnan and Clewlow1974; Politis Reference Politis2015; Ravn Reference Ravn2011; Shelley Reference Shelley1999; Stiles Reference Stiles1977; Trigger Reference Trigger1989; Wobst Reference Wobst1978; Wylie Reference Wylie and Schiffer1985; Yellen Reference Yellen1977). For example, Wobst (Reference Wobst1978) states that relying on ethnographic analogy limits us to interpreting the past based on behaviors accessible only via (current) ethnographic data—described as the “tyranny” of ethnography. Hodder (Reference Hodder1982) points out that when employing ethnographic analogy we must be aware of the inherent subjectivity in using present ethnographic data to interpret the past—making it difficult to use analogy to make valid inferences regarding archaeological material.
A number of researchers, critical of the problematic assumptions associated with ethnographic analogy, advocate a more systematic use of cross-cultural ethnographic data in archaeological analysis. For example, building on McNett (Reference McNett and Schiffer1979) and Murdock's (Reference Murdock1957) ethnological approach, Ember and Ember (Reference Ember and Ember1995) advocate the use of ethnographically discerned material correlates or proxy measures of human behaviors to examine statistically both causal (direct) and noncausal (indirect) links between variables (Peregrine Reference Peregrine1996). In doing so, they demonstrate how a systematic material correlates approach has the potential to aid our interpretation of the archaeological record.
Similarly, Ensor (Reference Ensor2003, Reference Ensor2011, Reference Ensor2017) outlines how taking a cross-cultural ethnological approach using material correlates—focusing on evidence for changes in resources and production—presents archaeologists with a framework to examine social transformation in prehistory via empirical archaeological interpretation. Peregrine (Reference Peregrine1996, Reference Peregrine2001) asserts that results generated from detailed cross-cultural research may represent an appropriate source for generating statistically valid inferences to identify and examine behavioral trends. For example, he (1993, 1994, 1996) suggests that settlement patterns and house forms reflect identifiable aspects of material culture that can be readily used in a systematic material correlates approach. Of direct relevance to our study, Peregrine (Reference Peregrine1996, Reference Peregrine2001) also promotes the use of cross-cultural ethnographic databases such as the Human Relations Area Files to (1) study the causal and noncausal associations between sets of material correlates and (2) develop sets of correlates to examine nonmaterial aspects of prehistoric culture such as religious beliefs—both greatly enhancing our interpretation and understanding of prehistoric cultures.
The traditional use of analogy has its limitations, particularly at the larger-scale cultural level. Building on the work of Ember and Ember, Ensor, and Peregrine, we developed a systematic cross-cultural approach (MCA) that uses particular sets of material correlates and statistical modeling to test our hypothesis.
METHODOLOGY
Sample Selection
To test our hypothesis it was necessary to design an integrated data gathering and analysis framework to collect, categorize, and quantify data from the electronic Human Relations Area Files (eHRAF) ethnographic database and the available archaeological sources. The known eHRAF cultures in our research were a defined subset of the original 74 groups classified as imagistic or doctrinal by Atkinson and Whitehouse (Reference Atkinson and Whitehouse2011). Two criteria were used to select this subset of cultures: dysphoric arousal levels (average dysphoric mean) and ritual frequency (frequency per year). The rationale was to generate an ethnographic sample that would relate directly to the central aspects of the Modes of Religiosity theory—ritual frequency and arousal level. Of the 74 cultures, those that represented the “most” imagistic and doctrinal cultures were selected, producing a subset of 34 cultures: 15 imagistic and 19 doctrinal. In order to examine the archaeology systematically, data relating to 49 site phases from across the agricultural transition in southwest Asia were assembled representing the Epipaleolithic to the Pottery Neolithic (PN) cultural horizons. To control for potential biases and limitations associated with cross-cultural studies, the recommendations by Ember and Ember (Reference Ember and Ember2009) and Levinson and Malone (Reference Levinson, Malone and Sanderson2000) regarding targeted data recording and analysis were employed when generating the data for this research.
We identified and recorded sets of material correlate data from the known sample of 34 eHRAF doctrinal and imagistic cultures, which were used (1) to identify and record sets’ ritual (apart from ritual frequency and arousal level) and nonritual material correlate variables that were directly connected to the known (imagistic or doctrinal) cultures in the ethnographic sample and (2) to derive material correlate variables that could be used to explore the presence of the imagistic or doctrinal mode in the archaeological samples. In total, we identified a set of 90 ritual, subsistence, and social complexity material correlate variables that could be examined in both the ethnographic and the archaeological records (Supplemental Text 1).
Data Gathering and Categorizing
The ethnographic component of this research focused on the collection, cataloging, and analysis of sets of ritual, subsistence practice, and social complexity material correlate variables from the sample of 34 previously classified ethnographic cultures provided by the eHRAF cross-cultural database (http://ehrafworldcultures.yale.edu/ehrafe/). Outline of Cultural Materials codes—a specific set of search codes used to catalog and search the cultural information provided by the eHRAF database—were used to extract and record the information relating to each of the selected ethnographic cultures (http://hraf.yale.edu/resources/reference/outline-of-cultural-materials/ [Supplemental Text 1]). As with all synchronic cross-cultural surveys, each eHRAF culture was assigned an explicit historical contextualization—a single time period directly related to the available documents in the eHRAF cross-cultural files, often referred to as an ethnographic present (Ember and Ember Reference Ember and Ember2009; Swanson Reference Swanson1980). The exploration of the eHRAF cultures resulted in the extraction and analysis of 65,432 paragraphs across the eHRAF cultures under examination (24,763 from imagistic mode cultures and 40,669 from doctrinal mode cultures).
The archaeological aspect of this research centered on the collection, categorization, and analysis of material correlate variables from a sample of 49 previously excavated site phases from the Epipaleolithic to the end of the Pottery Neolithic (ca. 20,000–5300 BC) in southwest Asia—encompassing present-day Jordan, Lebanon, Syria, Israel, Palestine, and southeast Turkey (Figure 1; Table 1). We used the archaeological material culture to generate a dataset of the instances and patterns of ritual activity, subsistence practice, and social complexity as the agricultural transition progressed in southwest Asia.
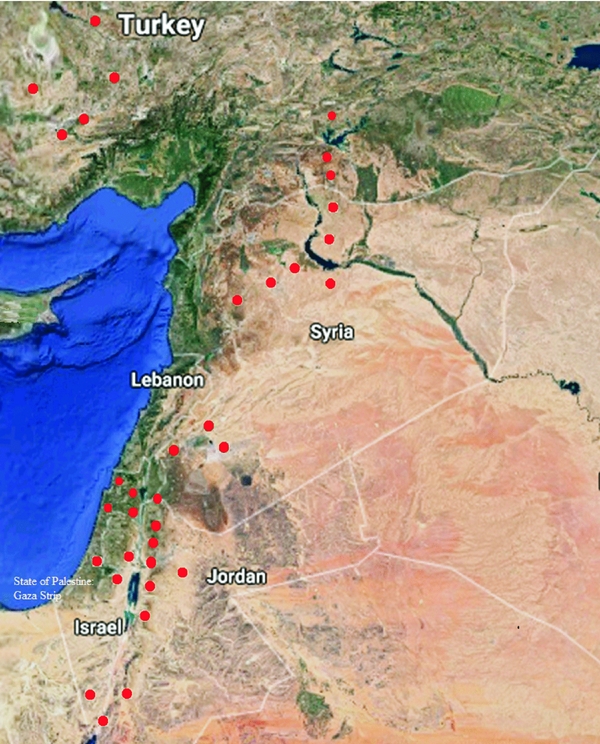
FIGURE 1. Distribution of southwest Asian Epipaleolithic and Neolithic sites (using Google Maps).
TABLE 1. Southwest Asian Chronology in Terms of Cultural Horizons.
Source: After Banning Reference Banning1998; Banning et al. Reference Banning, Rahimi and Siggers1994; Kuijt and Goring-Morris Reference Kuijt and Goring-Morris2002; Maher et al. Reference Maher, Richter and Stock2012; Twiss Reference Twiss2007.
For the purpose of uniformly coding, recording, and classifying the ethnographic and archaeological material correlates, categories of absence or presence (0/1) and intensity scales (e.g., 0–3) were used to identify and record the data (Supplemental Text 1). For example, categories of absence or presence (0/1) were used to identify and classify the main subsistence strategy of each culture, such as herding (0 = absent, 1 = present), and intensity scales were used to record in more detail aspects of each culture's subsistence strategy—for example, animal herding intensity (0–2), where 0 = no evidence of animal herding: the group was reliant on the hunting of wild animals; 1 = evidence of some herding: herded animals formed a large component of the meat protein intake, along with hunted animals; and 2 = evidence of intense animal herding: a substantial presence of herded animals (especially cattle) and little evidence of hunting. In addition, each eHRAF culture and archaeological site phase was categorized in terms of three group size measures: (1) less than 150 people, (2) 150 to 500 people, and (3) 500 to 5,000 people (Dunbar Reference Dunbar1992, Reference Dunbar1993; Hassan Reference Hassan1981; Kosse Reference Kosse1989, Reference Kosse1994). The categorized eHRAF cultures were used to construct a generalized linear model matrix of binary (0, 1) responses representing the known imagistic or doctrinal indicators, which could be used to classify the archaeological site phases.
Statistical Analysis
All of the collected data were subject to three complementary statistical techniques: multidimensional scaling (MDS), principal component analysis (PCA), and generalized linear modeling (GLM). First, MDS was used to provide a general picture of how the eHRAF cultures and the archaeological site phases, respectively, separated in relation to the recorded ritual, subsistence, and social complexity variables. Second, PCA was used to identify the specific sets of ritual, subsistence, and social complexity variables that were responsible for the separation in the eHRAF cultures and the archaeological site phases. Finally, GLM was used to examine which set of variables (identified via PCA) represents the best predictor of mode of religiosity (in the absence of ritual frequency and arousal data) and to generate the percentage probability of each ethnographic culture or archaeological site phase reflecting a culture engaged in an imagistic or doctrinal mode of religiosity.
Multidimensional Scaling
MDS is a dimension reduction method that produces coordinates in dimensional space that best characterize the structure of a dissimilarity matrix, using a Gower similarity coefficient (Baxter Reference Baxter1994; Davidson Reference Davidson1983; Gower Reference Gower1971a, Reference Gower, Hodson, Kendall and Tăutu1971b). The Gower similarity compares two cases i and j, and the coefficient is defined as
 $$\begin{equation*}
{S_{\textit{\scriptsize ij}}} = \sum_k {W_{\textit{\scriptsize ijk}}}S_{\textit{\scriptsize ijk}}/{{\sum_k^{} {{W_{\textit{\scriptsize ijk}}}_{}}}} \ ,
\end{equation*}$$
$$\begin{equation*}
{S_{\textit{\scriptsize ij}}} = \sum_k {W_{\textit{\scriptsize ijk}}}S_{\textit{\scriptsize ijk}}/{{\sum_k^{} {{W_{\textit{\scriptsize ijk}}}_{}}}} \ ,
\end{equation*}$$
where Sij is the similarity between two individual cases, Sijk is the influence of the k'th variable, and Wijk is the weight of the k'th variable (0 or 1; Baxter Reference Baxter1994; Gower Reference Gower1971a, Reference Gower, Hodson, Kendall and Tăutu1971b). In our study, MDS was conducted using the R statistics package (https://www.r-project.org/ [Supplemental Text 2]). It was employed to examine separation patterns relating to each set of ritual activity, subsistence, and social complexity variables from the ethnographic cultures and the southwest Asian archaeological site phases through the generation of three-dimensional dissimilarity matrices—presenting the multivariate distances of individual cases in relation to the first three principal components.
Principal Component Analysis
PCA enabled us to identify the sets of variables that accounted for the maximal amount of variance in the datasets, in terms of a complementary set of scores and loadings (Abdi and Williams Reference Abdi and Williams2010; Esbensen and Geladi Reference Esbensen and Geladi1987; Jolliffe Reference Jolliffe2002; Ringner Reference Ringner2008; Saporta and Niang Reference Saporta, Niang and Govaert2009). Through the production of correlation circles and factor maps, we were able to explore the relationship of plotted individual eHRAF cultures, as well as archaeological site phases, to each other in terms of the PCA-identified variables. As the recorded ethnographic and archaeological information reflected categorical data (e.g., 0 or 1) and ordinal data (using 0–2 or 0–3 scales), the variables were converted to normal quantile variables to give attractable distributions (normal distributions), enabling standard PCA to be performed. This was done using the FactoMineR package for multivariate analysis (http://factominer.free.fr/ [Supplemental Text 2]). PCA was carried out for each set of ritual, subsistence, and social complexity variables for the ethnographic and archaeological databases using mode of religiosity (for ethnographic cultures) and archaeological cultural horizons (e.g., Pre-Pottery Neolithic A [PPNA]) as the identifying factors. Central to our MCA approach, PCA enabled us to identify the specific sets of variables that were responsible for the separation in the samples of eHRAF cultures and archaeological site phases and provided a defined set of variables that could be used in GLM matrices to classify the unknown archaeological cases in terms of the two modes.
Generalized Linear Modeling
GLM is a multilevel binary regression statistical technique that provides a model that best accounts for the variance observed in a sample (Agresti Reference Agresti2007; Dobson Reference Dobson2002; Field Reference Field2005; Howell Reference Howell2009; McCullagh and Nelder Reference McCullagh and Nelder1989). GLMs are based on an assumed relationship (link functions) between the mean of the response variable and the linear combination of the explanatory variables (Dobson Reference Dobson2002; Guisan et al. Reference Guisan, Edwards and Hastie2002; McCullagh and Nelder Reference McCullagh and Nelder1989). GLM is an extension of the standard least-squares regression—the difference being that least-squares regression assumes that residuals follow a normal (Gaussian) distribution, whereas GLMs do not assume a normal distribution and can be used to model continuations, ordered and unordered data. Thus, GLMs provide a multivariate statistical method for modeling data that represents a number of probability distributions, including Gaussian, inverse Gaussian, normal binomial, negative binomial, Poisson, and gamma distributions (Baxter Reference Baxter1994; Guisan et al. Reference Guisan, Edwards and Hastie2002; Venables and Dichmont Reference Venables and Dichmont2004). For the purpose of hypothesis testing in our MCA method, GLMs were a particularly applicable formal inferential statistical technique, as they offered us predictor models to analyze archaeological and ethnographic data, which are (often) not represented by classical Gaussian distributions. GLMs are fit to data via the method of maximum likelihood, providing the percentage probability that an unknown sample can be classed in terms of a particular known category.
However, GLMs can be subject to overfitting, which happens when a model is extremely complex, usually by having too many parameters relative to the number of observations—the result being that the GLM cannot identify the important variables responsible for the separation between cases and describes random error or “noise” produced by the inclusion of nonsignificant variables (Bourne et al. Reference Bourne, Regular, Sun, Thompson, Trant and Wheeler2007; Guisan et al. Reference Guisan, Edwards and Hastie2002). To limit this potential error, it was necessary first to use PCA to identify the main set(s) of variables responsible for the distinction between cases.
We utilized the specific set of known imagistic and doctrinal cultures as a threshold to make a binary function, divided into imagistic or doctrinal (0 or 1), and a GLM (binary regression) was applied to it. Once the cases had been divided in terms of this binary relationship, the variables identified using PCA were used to apply a multilevel binary regression via the GLM. First, the GLM was applied to the known ethnographic sample to test the appropriateness of each GLM—to examine how successful the model was at correctly categorizing the known imagistic and doctrinal cultures. Second, the GLM was applied to the unknown archaeological site phases. The function cbind in the R statistics package (https://www.rdocumentation.org/packages/base/versions/3.4.1/topics/cbind) was used to create a matrix by binding the column vectors containing the binary numbers 0 and 1 assigned to the known ethnographic cases (Supplemental Text 2).
Each GLM was (initially) tested by plotting Receiver Operating Characteristic (ROC) curves (Supplemental Text 2). An ROC curve makes it possible to assess the accuracy of the received predictions by plotting the true positive rate against the false positive rate (Beerenwinkel et al. Reference Beerenwinkel, Sing, Lengauer, Rahnenführer, Roomp, Savenkov, Fischer, Hoffmann, Selbig, Korn, Walter, Berg, Braun, Fätkenheuer, Oette, Rockstroh, Kupfer, Kaiser and Däumer2005; Metz Reference Metz1978; Figure 2). The standard two-dimensional ROC curve is a graph of the proportion of positive responses in the sample plotted against the proportion of false responses—that is, a false rate. The origin point (0, 0) represents a situation of no positive classifications being assigned; such a classifier commits no false positive errors but also gains no true positives (Beerenwinkel et al. Reference Beerenwinkel, Sing, Lengauer, Rahnenführer, Roomp, Savenkov, Fischer, Hoffmann, Selbig, Korn, Walter, Berg, Braun, Fätkenheuer, Oette, Rockstroh, Kupfer, Kaiser and Däumer2005; Bewick et al. Reference Bewick, Cheek and Ball2004; Fawcett Reference Fawcett2005; Hartley et al. Reference Hartley, Harris and Lester2006; Johnson Reference Johnson2004; Li et al. Reference Li, Liu, Zeng, Cai and Li2006; Metz Reference Metz1978). In terms of an initial visual inspection, the more closely the ROC curve follows the left-hand border and then the top border of the ROC space (making a right angle), the more accurate the test—that is, the more appropriate the model is for generating true predictions (Figure 2). In a perfect test, an ROC curve would start at the origin (0, 0), go vertically up the y-axis to the (0, 1) coordinate, and then go horizontally across to the (1, 1) coordinate (Beerenwinkel et al. Reference Beerenwinkel, Sing, Lengauer, Rahnenführer, Roomp, Savenkov, Fischer, Hoffmann, Selbig, Korn, Walter, Berg, Braun, Fätkenheuer, Oette, Rockstroh, Kupfer, Kaiser and Däumer2005; Bewick et al. Reference Bewick, Cheek and Ball2004; Fawcett Reference Fawcett2005; Hartley et al. Reference Hartley, Harris and Lester2006; Johnson Reference Johnson2004; Li et al. Reference Li, Liu, Zeng, Cai and Li2006; Metz Reference Metz1978). The more closely the ROC curve tends toward a 45-degree diagonal line, the less accurate the test. A diagonal line (going from 0, 0 to 1, 1) represents the random assigning of classes. For example, if a classifier randomly predicts the positive class half the time, it can be expected to get half the positives and half the negatives correct; this results in the point (0.5, 0.5) in ROC space.
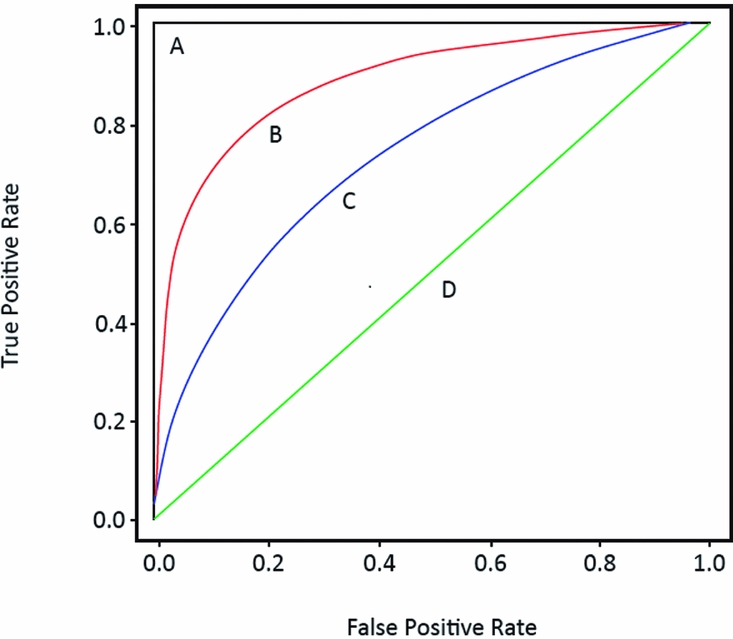
FIGURE 2. (A–D) Contrasting Receiver Operating Characteristic (ROC) curves (after Sing et al. Reference Sing, Sander, Beerenwinkel and Lengauer2005). A perfect test (A) has an area under the ROC curve of 1.0. The diagonal line (D) from (0, 0) to (1, 1) has an area under the ROC curve of 0.5.
Apart from visually assessing GLMs using ROC curves, a common method to examine the appropriateness of a GLM is to calculate the “area under the ROC curve” (AUC [Bradley Reference Bradley1997; Hanley and McNeil Reference Hanley and McNeil1982; Roomp et al. Reference Roomp, Beerenwinkel, Sing, Schülter, Büch, Sierra-Aragon, Däumer, Hoffmann, Kaiser, Lengauer, Selbig, Leser, Naumann and Eckmann2006]). The AUC value is always between 0 and 1 (or 0 to 100% of cases classified correctly). The larger or higher percentage (i.e., closer to 1.0 or 100%) the AUC is, the better the GLM's predictor power. The perfect predictor model will result in an AUC of 1.0 (or 100% of cases classified correctly), while a model producing random classifications will produce an AUC of 0.5 (50% of cases classified correctly) or less. A valid predictor model should have an AUC greater than 0.5 (or 50%); the closer the AUC is to 1.0 (100% of cases classified correctly), the better the predictor model is at classifying the cases correctly (Bradley Reference Bradley1997; Guo et al. Reference Guo, Liu, Shriver, Hu and Liebman2006; Hanley and McNeil Reference Hanley and McNeil1982; Roomp et al. Reference Roomp, Beerenwinkel, Sing, Schülter, Büch, Sierra-Aragon, Däumer, Hoffmann, Kaiser, Lengauer, Selbig, Leser, Naumann and Eckmann2006). The combination of recording the true positive vs. the false positive rate and calculating the area under the curve made it possible to use ROC curves to examine the validity and performance of the GLMs employed in our research. The ROC and ROCR libraries in the R statistics package (https://cran.r-project.org/web/packages/plotROC/index.html) were used to plot the (ROC) curves, as well as calculate the AUCs and the percentage of cases classified correctly.
We implemented an additional level of validation for all GLMs by generating half-normal quantile-quantile (Q-Q) plots using the method outlined by Collett (Reference Collett2014). These are plots in which the residuals are arranged in ascending order and plotted against an approximate of their expected values. A half-normal Q-Q plot provides a formal diagnostic assessment of the model's goodness of fit. It centers on plotting the ordered absolute values of the Pearson residuals (x-axis) against the corresponding half-normal quantiles (y-axis). A half-normal Q-Q plot simulates points in relation to a confidence envelope and a line that shows the means of the simulated values. The confidence envelope is such that if the fitted model is correct, the plotted points are likely to be located within the limits of the confidence envelope; generally a 95% confidence envelope is preferred for testing simulated points.
Using the simulated confidence envelope, a plot can be (visually) interpreted without having to make assumptions about the distribution of the residuals. Moreover, the generation of a number of outliers outside the simulated confidence envelope indicates that the fitted model is not appropriate to make reliable predictions/classifications. In addition, the closer the points are to the line showing the means of the simulated values, the more appropriate the model. However, Collett (Reference Collett2014) points out that even with a fit-for-purpose model, the residuals used in constructing a half-normal Q-Q plot may not be approximately normally distributed. Thus, a half-normal Q-Q plot of the residuals will not necessarily result in a straight line (an ideal line of the means of the simulated values) for the simulated points.
In our MCA approach, the generation of half-normal Q-Q plots (Supplemental Text 2) offered a critical validation of each GLM using the means of Pearson residuals obtained by simulation under the assumption that the model was correct along with a 95% confidence envelope enabling us to (1) assess whether the Pearson residuals from the fitted model (simulated points) were within the 95% confidence interval, (2) examine the model residuals in relation to a mean, and (3) identify outliers. For example, the half-normal Q-Q plot generated for the GLM used to classify the unknown archaeological cases (Figure 3) shows that all the simulations (the points generated) lie within the 95% confidence envelope (dotted lines) and are close to the mean line—with none of the simulated points as outliers. This half-normal Q-Q plot demonstrates that the model is appropriate to classify the unknown archaeological site phases in terms of the two modes.

FIGURE 3. Half-normal quantile-quantile plot for the generalized linear model of the southwest Asian site phases, demonstrating that all the simulations lie within the 95% confidence envelope (dotted lines) and are close to the mean line (solid line).
RESULTS
General Trends from the Statistical Results: MDS and PCA
In general, the MDS analysis of the eHRAF data demonstrated a statistical separation between the known imagistic and doctrinal cultures, even in the absence of ritual frequency and arousal data. For example, Figure 4 shows a separation between the imagistic and doctrinal cultures based on sets of ritual variables. In addition, PCA revealed the maximum separation between the imagistic and doctrinal cultures based on five specific variables. Interestingly, three out of the five PCA-identified variables were subsistence variables—that is, hunting, cultivation (both recorded in terms of 0 = absent, 1 = present), and crop intensity at 2 (intensive cultivation with domesticated staples [Supplemental Text 1]). The imagistic and doctrinal cultures were distinguished (generally) in the following terms: (1) imagistic groups engaged in a hunting and gathering subsistence strategy and secondary mortuary practices (including grave disturbance, excarnation/defleshing, or reburial), and (2) fully sedentary doctrinal groups engaged in intensive farming (including a range of cultivated crops and herded animals) and provided evidence of a long-term food storage strategy, private food cooking, resource monopolization, communal ritual structures, and cemeteries.
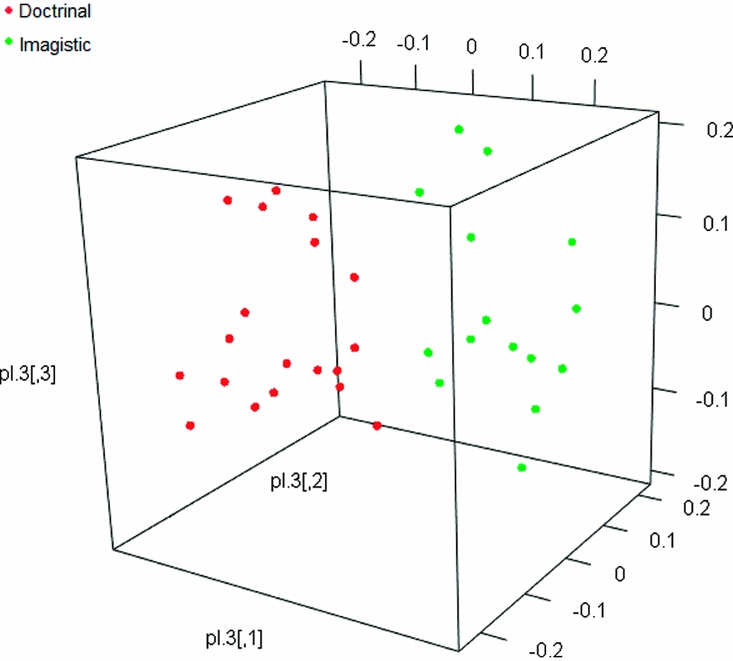
FIGURE 4. Three-dimensional multidimensional scaling plot based on the recorded ritual variables for the electronic Human Relations Area Files cultures, coded in terms of mode of religiosity.
The MDS and PCA of the archaeological dataset resulted in site phases from different cultural horizons being (commonly) separated in terms of (1) the site phases that provided evidence of hunting and gathering, individual burials, and flexed burials and (2) the site phases that provided evidence of intensive agriculture (including a range of cultivated crops and herded animals), communal ritual structures (ritual buildings and/or monuments), and storage of cultural knowledge (deliberate actions to externally store or transmit cultural knowledge, for the purposes of preserving and transmitting them [Supplemental Text 1]). These statistical distinctions generally characterize a separation between Epipaleolithic site phases and the Middle Pre-Pottery Neolithic B (PPNB), Pre-Pottery Neolithic C (PPNC), and PN site phases, respectively.
The variables identified by PCA that were common to the eHRAF and the southwest Asian archaeological datasets resulted in two broad groups: those with evidence of mobile or semisedentary hunting-gathering vs. those with evidence of intensive agriculture, a high level of sedentism, and communal ritual structures. The former group consisted of the known imagistic cultures from the eHRAF and the Epipaleolithic archaeological site phases. The latter group consisted of the known doctrinal cultures from the eHRAF and the Neolithic archaeological site phases. We suggest that archaeological material culture evidence of intensive cultivation, fully sedentary groups, and communal ritual structures reflect the emergence of a more doctrinal mode in the sample of site phases we used. Although expected in relation to the archaeology of the agricultural transition, the identified hunter-gatherer vs. agriculturalist divide is interesting as a parallel subsistence divide was also identified as marking a distinction between the known imagistic and doctrinal ethnographic cultures, suggesting a relationship between subsistence strategy (as it would be identified archaeologically) and each of the two modes. In relation to the analysis of the samples based on our three group size categories, relationships between the smallest group size (less than 150) and the known imagistic cultures as well as the archaeological site phases that were classified as imagistic were identified. The eHRAF cultures and archaeological site phases reflecting the largest group size category (500 to 5,000) grouped distinctly when examined using the social complexity and ritual variables. All of the eHRAF cultures and site phases in this group size category were classed as doctrinal, which suggests a connection between particular types of ritual activity and levels of social complexity and larger (mainly doctrinal) populations. Our (initial) results indicate that population size—particularly in relation to our smallest and largest group size categories—relates to aspects of ritual/religious practice, subsistence strategy, and levels of social complexity, which may be indicative of mode of religiosity in archaeological material.
General Trends from the Statistical Results: GLM
The assessment of the GLMs using ROC curves and half-normal Q-Q plots for the eHRAF data showed that the ritual variables recorded (other than ritual frequency and dysphoric arousal level) from the known sample can be used to correctly distinguish between imagistic and doctrinal cultures, with a success rate of 77% of the known eHRAF cultures correctly classified. This result is promising, as it demonstrates that previously classified cultures’ modes can potentially be correctly identified in the absence of ritual frequency and dysphoric arousal level information using a recorded set of ritual variables.
For the eHRAF dataset, the GLM results demonstrate that using a set of five variables (identified via PCA) selected from all categories (ritual, subsistence, and social complexity combined) represented the most appropriate manner to distinguish between imagistic and doctrinal cultures, with 85% (29 cultures) of the known eHRAF cultures correctly classified (Table 2). As previously noted, of the five PCA-identified variables used in the GLM, three of them were subsistence variables. This result further reinforces the findings from MDS and PCA, which demonstrate that subsistence variables represent a dominant set of distinguishing variables in the context of the known eHRAF cultures. Similarly, the assessment of the GLMs for the southwest Asian archaeological dataset shows that a GLM based on a set of PCA-identified subsistence variables represented the best predictor model for classifying the recorded archaeological site phases in terms of the two modes, with 78% of the known eHRAF cultures correctly classified using the archaeologically identified set of subsistence variables.
TABLE 2. Generalized Linear Model Output Summary Showing Percentage Probability and Mode Classification for Each Electronic Human Relations Area Files (eHRAF) Culture, Based on the Variables Identified via Principal Component Analysis.
a Atkinson and Whitehouse Reference Atkinson and Whitehouse2011.
Percentages Generated from the GLMs of the Archaeological Dataset
GLMs based on the PCA-identified variables from the archaeological dataset classified all of the Epipaleolithic site phases as imagistic, with high percentage probabilities (Figure 5; Table 3). In addition, 5.5% (2 site phases) of the Neolithic site phases were classified as imagistic, 89% (32 site phases) as doctrinal, and 5.5% (2 site phases) as indeterminate (a percentage probability result of 40%–59% as the sample cannot be considered positively as one of the two classifier cases [imagistic or doctrinal culture]). Of the PPNA site phases, 25% were categorized as imagistic, and 75% were classified as reflecting doctrinal cultures. Of the PPNB site phases, 90% were categorized as doctrinal cultures, and 10% were classified as indeterminate. Furthermore, all of the Early PPNB site phases were classified as doctrinal. Of the Middle PPNB site phases, 89% were categorized as doctrinal, and 11% were classified as indeterminate. Of the Late PPNB site phases, 75% were categorized as doctrinal, and 25% were classified as indeterminate. All PPNC and PN site phases were categorized as doctrinal cultures.
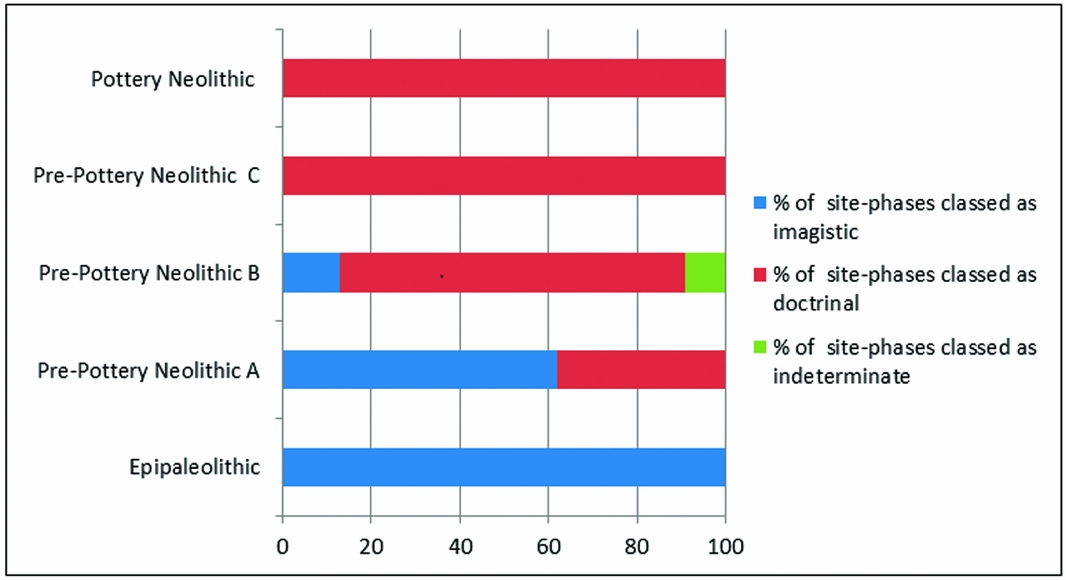
FIGURE 5. Percentage probability for each archaeological site phase classed via generalized linear modeling, showing a (general) increase in doctrinal classifications as the agricultural transition progressed.
TABLE 3. Generalized Linear Modeling Output Summary Showing Percentage Probability and Mode Classification for Each Archaeological Site Phase, Based on the Subsistence Variables Identified via Principal Component Analysis.
For the archaeological dataset, the highest percentage of doctrinal classifications occurs for the PPNC and PN site phases—with 100% of site phases classified as doctrinal (Figure 5). However, the high number of doctrinal classifications for the PPNB site phases (at 90%) is also interesting, as the PPNB period is connected with a significant population increase, high-intensity agriculture, and the development of large population centers (Asouti and Fuller Reference Asouti and Fuller2012; Bellwood Reference Bellwood2005; Fuller et al. Reference Fuller, Willcox and Allaby2011; Harris Reference Harris, Cappers and Bottema2002; Kuijt and Goring-Morris Reference Kuijt and Goring-Morris2002; Peters and Schmidt Reference Peters and Schmidt2004; Rollefson Reference Rollefson and Henry1998a, Reference Rollefson1998b, Reference Rollefson, Garrard and Gebel1998c, Reference Rollefson and Kuijt2000).
The GLM results demonstrate a clear distinction between site phases with evidence of groups engaged in hunting-gathering and those with evidence of an intensive agricultural subsistence strategy—with the former (generally) classified as imagistic and the latter (mostly) categorized as doctrinal. The results support the claims and previous findings by Whitehouse (Reference Whitehouse2004) and Atkinson and Whitehouse (Reference Atkinson and Whitehouse2011) in relation to the connection between engagement in an intensive agriculture subsistence strategy and the doctrinal mode. In this regard, we can suggest that subsistence evidence from the archaeological record can potentially be used to predict mode of religiosity. In relation to the hypothesis central to our research, the percentages generated by the GLMs suggest a general shift from an imagistic to a more doctrinal mode of religiosity associated with the agricultural transition in southwest Asia (Figure 5; Table 3). From the samples we used and the MCA method we employed, we can assert that, as the agricultural transition progressed, we can observe a decrease in imagistic classifications and an increase in doctrinal classifications.
DISCUSSION AND CONCLUSION
In this essay, we have outlined how the Material Correlates Analysis method, which centers on strategic data gathering and utilizing complementary statistical techniques, makes it possible to use archaeological data to extend hypothesis testing beyond the ethnographic or historical record. Using the Modes of Religiosity theory as an example, we have demonstrated that by identifying and statistically modeling common aspects of material culture, archaeological material culture can be used to bridge the gap between theories developed and tested using ethnographic sources and actual archaeological material culture. In doing so, we have shown how MCA can be used effectively in large meta-analytical studies integrating material evidence from a number of archaeological and ethnographic data sources, resulting in an interdisciplinary method of testing hypotheses.
Acknowledgments
The results presented are from Dr. Michael Gantley's doctoral research, which was carried out at the School of Archaeology and the Institute of Cognitive and Evolutionary Anthropology, University of Oxford. This doctoral research was funded by a National University of Ireland Travelling Studentship in Humanities and Social Sciences and supervised by Professor Amy Bogaard and Professor Harvey Whitehouse. Professor Whitehouse's contribution to this research was supported by a Large Grant from the UK's Economic and Social Research Council (REF RES-060-25-467 0085), an Advanced Grant from the European Research Council under the European Union's Horizon 2020 Research and Innovation Programme (grant agreement No. 694986), a grant from the John Templeton Foundation (grant No. 37624), an award from the Templeton World Charity Fund (grant No. TWCF0164), and a grant from the European Union's Horizon 2020 Research and Innovation Programme (grant agreement No. 644055). In addition, we wish to acknowledge the contribution of Dr. Dan Lunn. We would also like to thank Rosa Teira-Paz for translating the abstract into Spanish. Finally, we wish to thank and acknowledge the extremely helpful comments provided by the anonymous reviewers.
Data Availability Statement
A capsule of data and code to reproduce this article is available in Code Ocean, a computational reproducibility platform, at https://doi.org/10.24433/CO.3c61c67c-3e89-4a79-8277-d312f1c07444
Supplemental Materials
To view supplementary material for this article, please visit https://doi.org/10.1017/aap.2018.9
Supplemental Text 1. Ethnographic and Archaeological Material Correlates Codebook.
Supplemental Text 2. R-statistics Commands.


